Effective Low-Noise Rumble Strips (2024)
Chapter: 5 Suggested Effective Low-Noise Rumble Strips

CHAPTER 5
Suggested Effective Low-Noise Rumble Strips
Comparison of Interior Measurements
Established criteria indicate a minimum difference of 10 dB between on- and off-rumble strips for interior measurements would effectively alert drivers of lane departure. Interior noise and vibration on/off increments were used for each of the 20 design parameters to determine effectiveness in alerting the drivers, consistency of results, and limits for each of the parameters.
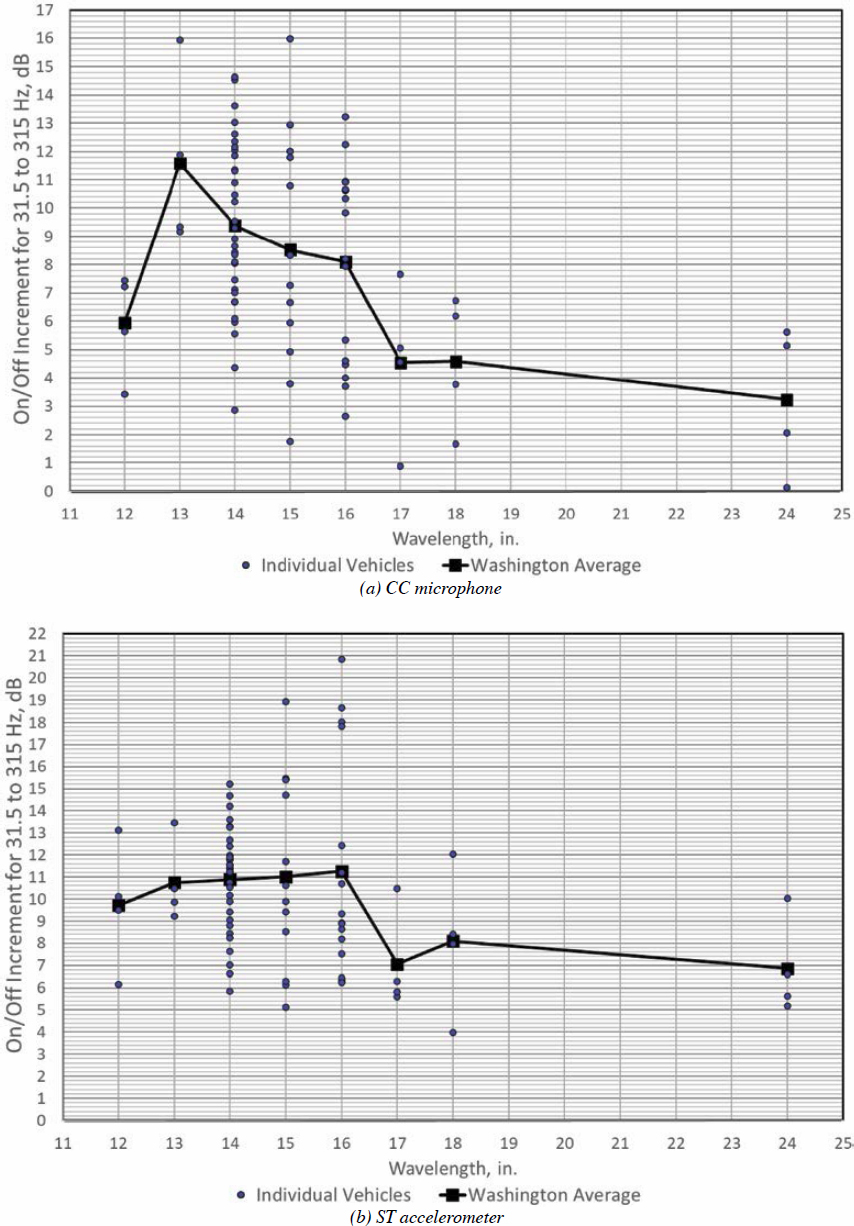
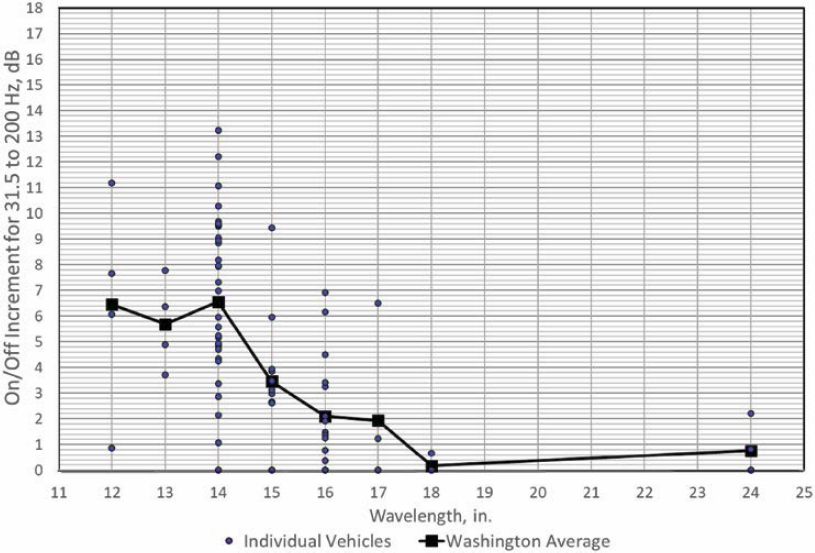
Figure 46 shows the on/off increments for all test vehicles measured at each of the 20 sinusoidal test sites with the CC microphone (a) and ST accelerometer (b) versus the wavelength of the individual sites at 60 mph. The overall levels used to calculate the on/off increments reflect the energy from 31.5 to 315 Hz to reduce the impact of the chip seal pavement in calculating the overall levels. All data collected at the 20 Washington test sites are shown in blue, while the average at each wavelength is shown in black. On average, the wavelengths that resulted in the interior on/off increment requirement of 10 dB or more at the ST sensor were 13-, 14-, 15-, and 16-inch sites, while only the average 13-inch wavelength resulted in a 10 dB or more increment at the CC microphone.
At 45 mph, none of the average increments resulted in 10 dB or more at the CC microphone when grouped by wavelengths. However, individual vehicles or sites with wavelengths of 14, 15, and 16 inches did have increments of 10 dB or more. At the ST sensor, average increments of 10 dB or more were measured at the 13-, 14-, 15-, and 16-inch sites. Consistently, sites with 13-, 14-, 15-, and 16-inch wavelengths provided interior noise level increments of 10 dB or more at both the primary microphone (CC) and the primary accelerometer (ST) when tested at 45 mph. These would be the most effective wavelength designs for meeting the requirement of alerting the driver of lane departure.
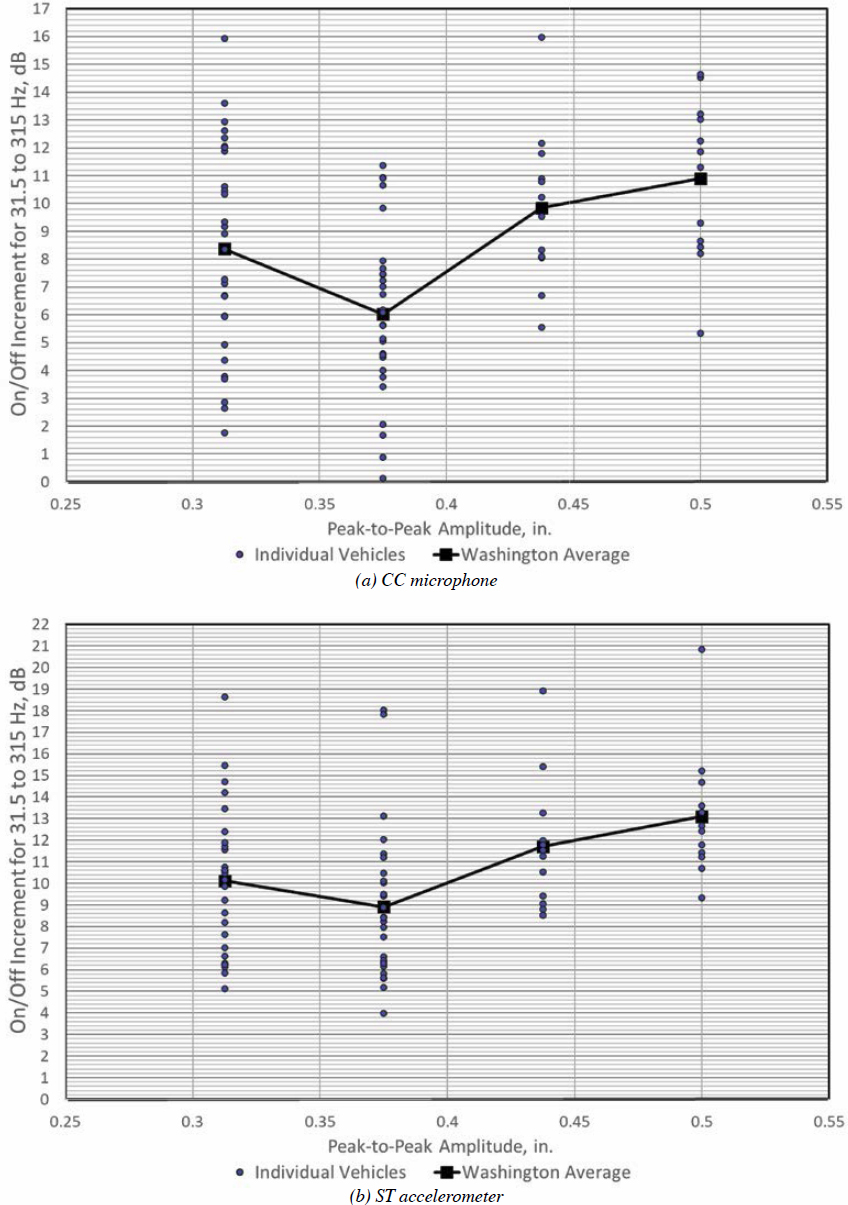
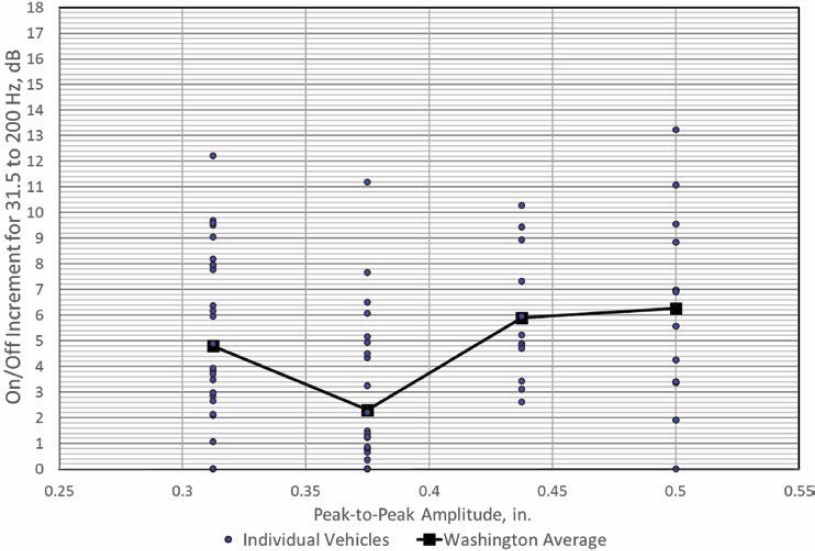
Figure 47 shows the increments versus amplitude for all test sites, as measured at the CC microphone (a) and ST sensor (b) at 60 mph. At the CC microphone, average peak-to-peak amplitudes of ![]() (0.4375) and ½ (0.5) inches resulted in increments of 10 dB or more. At the ST sensor, average peak-to-peak amplitudes of
(0.4375) and ½ (0.5) inches resulted in increments of 10 dB or more. At the ST sensor, average peak-to-peak amplitudes of ![]() (0.3125),
(0.3125), ![]() , and ½ inches resulted in increments of 10 dB or more.
, and ½ inches resulted in increments of 10 dB or more.
While none of the average peak-to-peak amplitudes resulted in increments of 10 dB or more at the CC microphone at 45 mph, individual vehicles at each amplitude showed increments of 10 dB or more. At the ST sensor, average peak-to-peak amplitudes of ![]() ,
, ![]() , and ½ inches resulted in increments of 10 dB or more, similar to the 60 mph results.
, and ½ inches resulted in increments of 10 dB or more, similar to the 60 mph results.
It was determined above that the sites with wavelengths of 13, 14, 15, and 16 inches would be the optimal designs for notifying the driver of lane departure. Washington test sites with only these wavelengths were isolated to compare the other design parameters. Figure 48 shows increments versus peak-to-peak amplitudes for all test vehicles at sites with wavelengths of 13, 14, 15, and 16 inches only, as measured at the CC microphone (a) and ST accelerometer (b) at 60 mph.
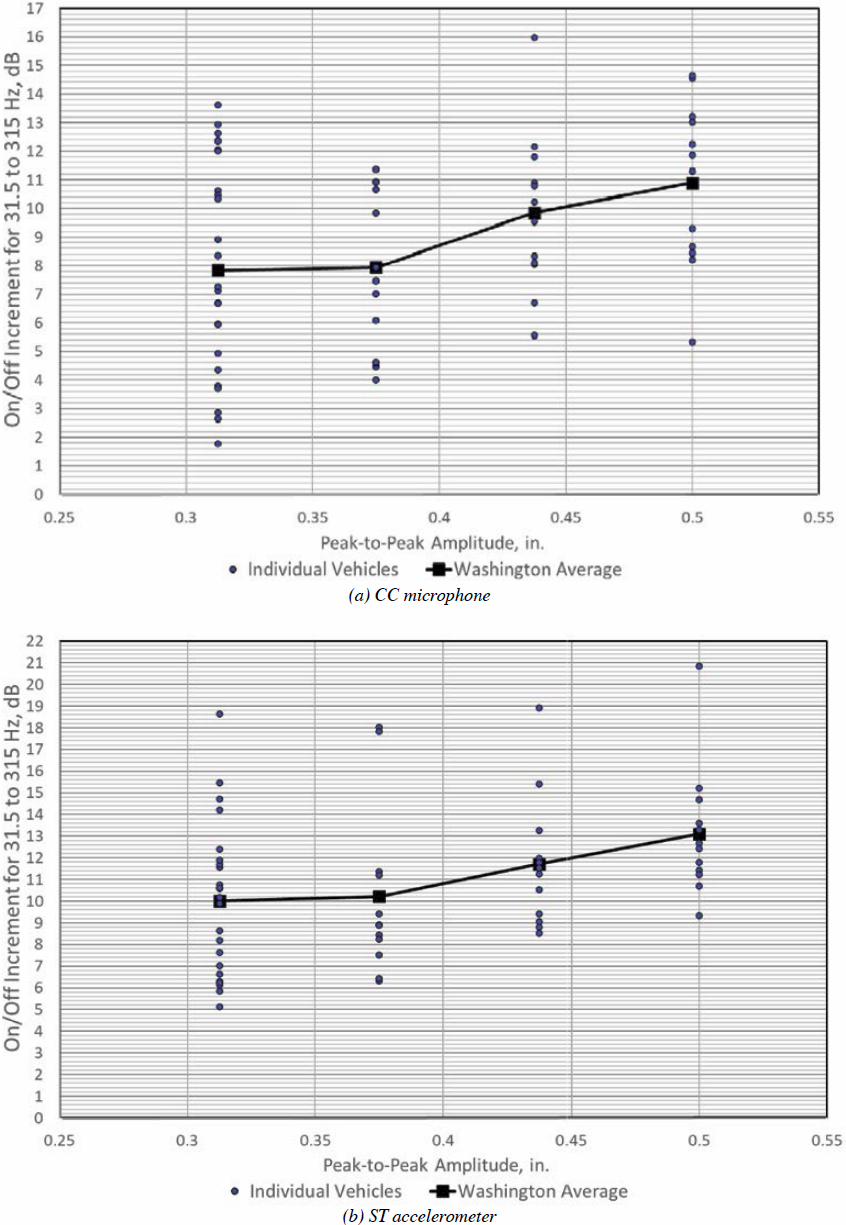
At the CC microphone, amplitudes of ![]() and ½ inches resulted in average increments of 10 dB or more, while amplitudes of
and ½ inches resulted in average increments of 10 dB or more, while amplitudes of ![]() and 3/8 (0.375) inches resulted in average increments of about 8 dB. At the ST sensor, all peak-to-peak amplitudes resulted in average increments of 10 dB or more.
and 3/8 (0.375) inches resulted in average increments of about 8 dB. At the ST sensor, all peak-to-peak amplitudes resulted in average increments of 10 dB or more.
While all amplitudes at 45 mph show average increments of 10 dB or more at the ST sensor, none result in 10 dB or more increments at the CC microphone. See Appendix E.
In general, the peak-to-peak amplitudes of ![]() and ½ inches show the highest on/off increments on the vehicle interior.
and ½ inches show the highest on/off increments on the vehicle interior.
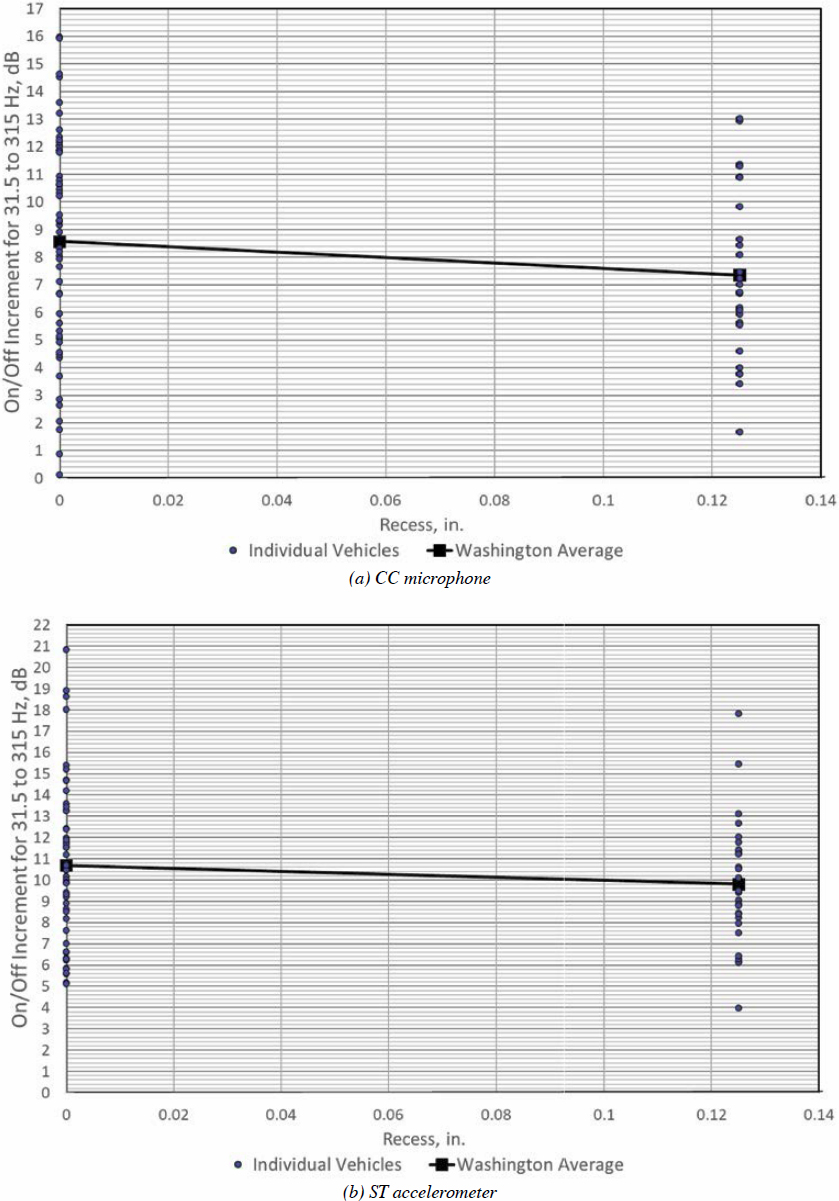
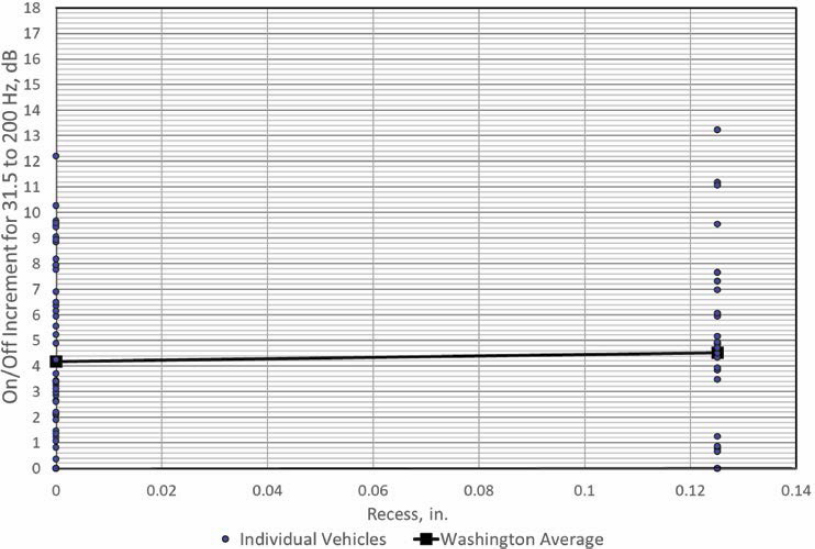
The recess design parameter relates to the distance below the pavement surface where the entire sinusoidal strip is set. From the figures of the pavement, a 0-inch recess would mean the peak of the sinusoidal wave would be flush with the pavement surface, while a ⅛-inch recess means the peak of the wave would be ⅛ inch below the pavement surface. Figure 49 shows the on/off increments for all test vehicles measured at each of the 20 sinusoidal test sites with the CC microphone (a) and ST accelerometer (b) versus the recess at 60 mph. Overall, the average increment at each recess value is within 2 dB of each other, which is not statistically relevant. The same results occurred at 45 mph. While it does not appear that this design parameter correlates to the on/off increments, a 0-inch recess would be better for bicycle safety and would be easier to install.
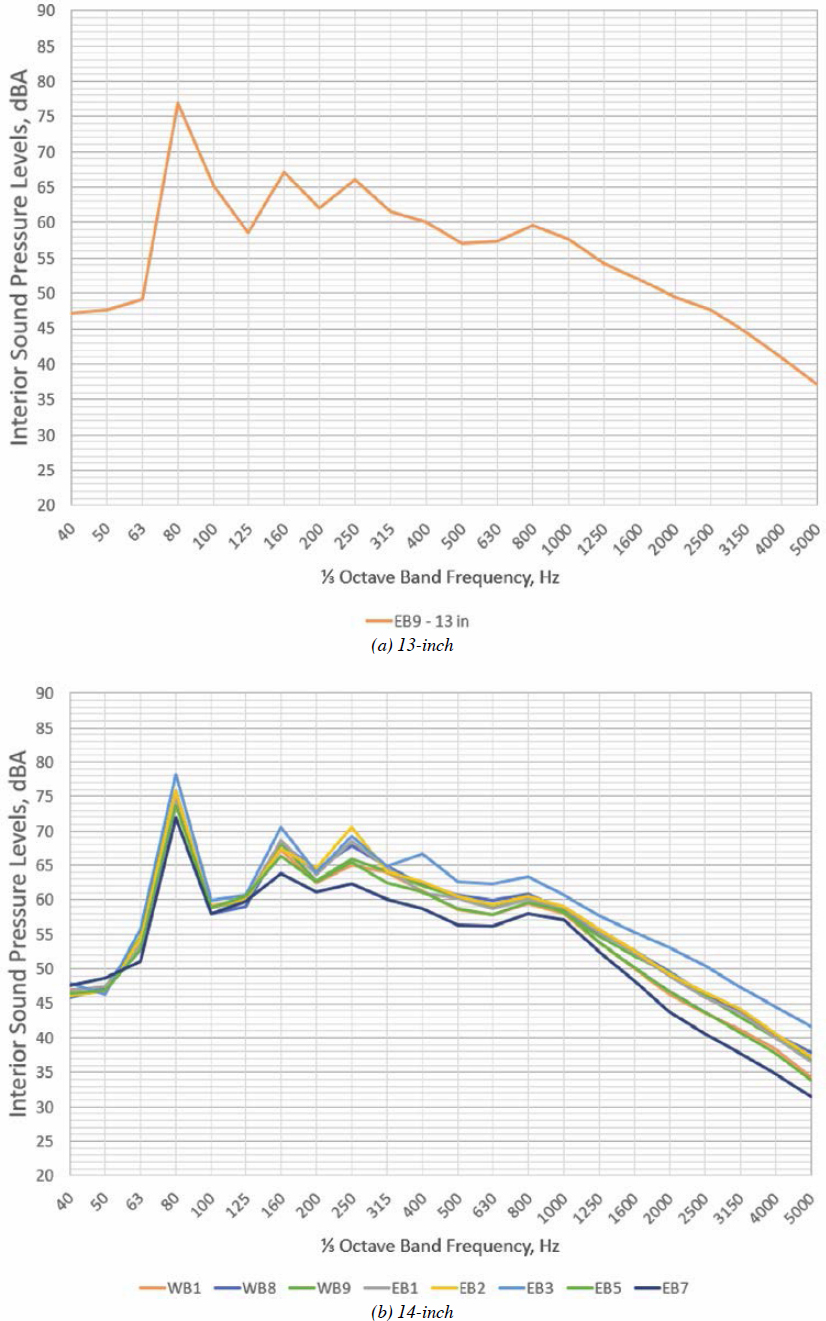
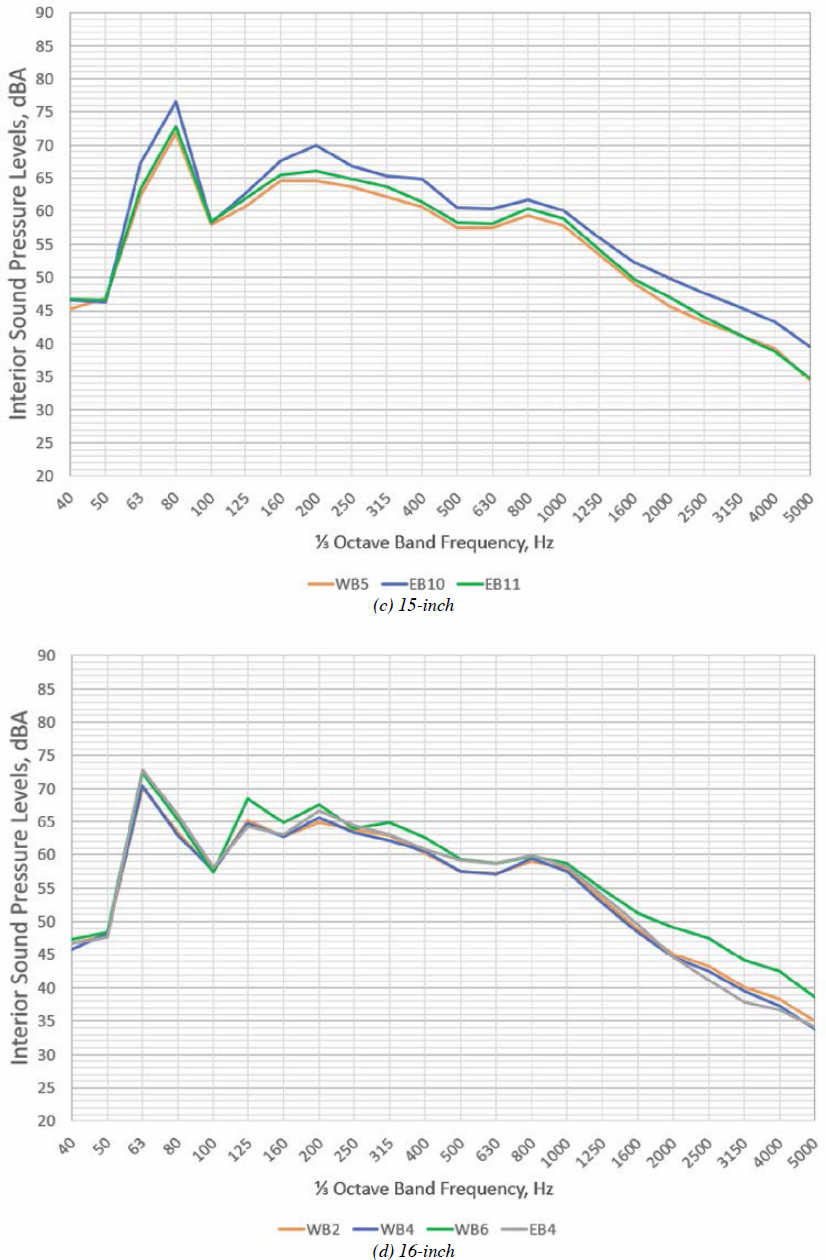
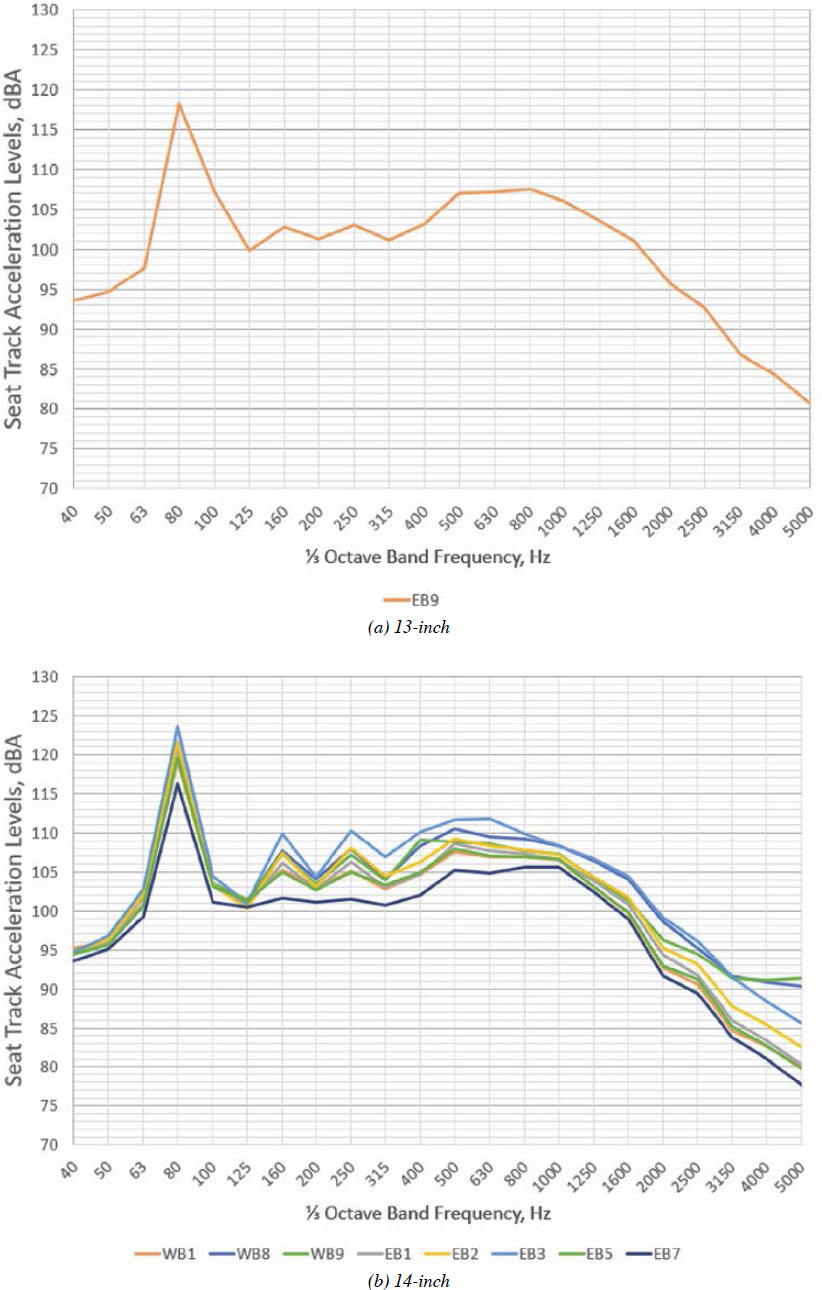
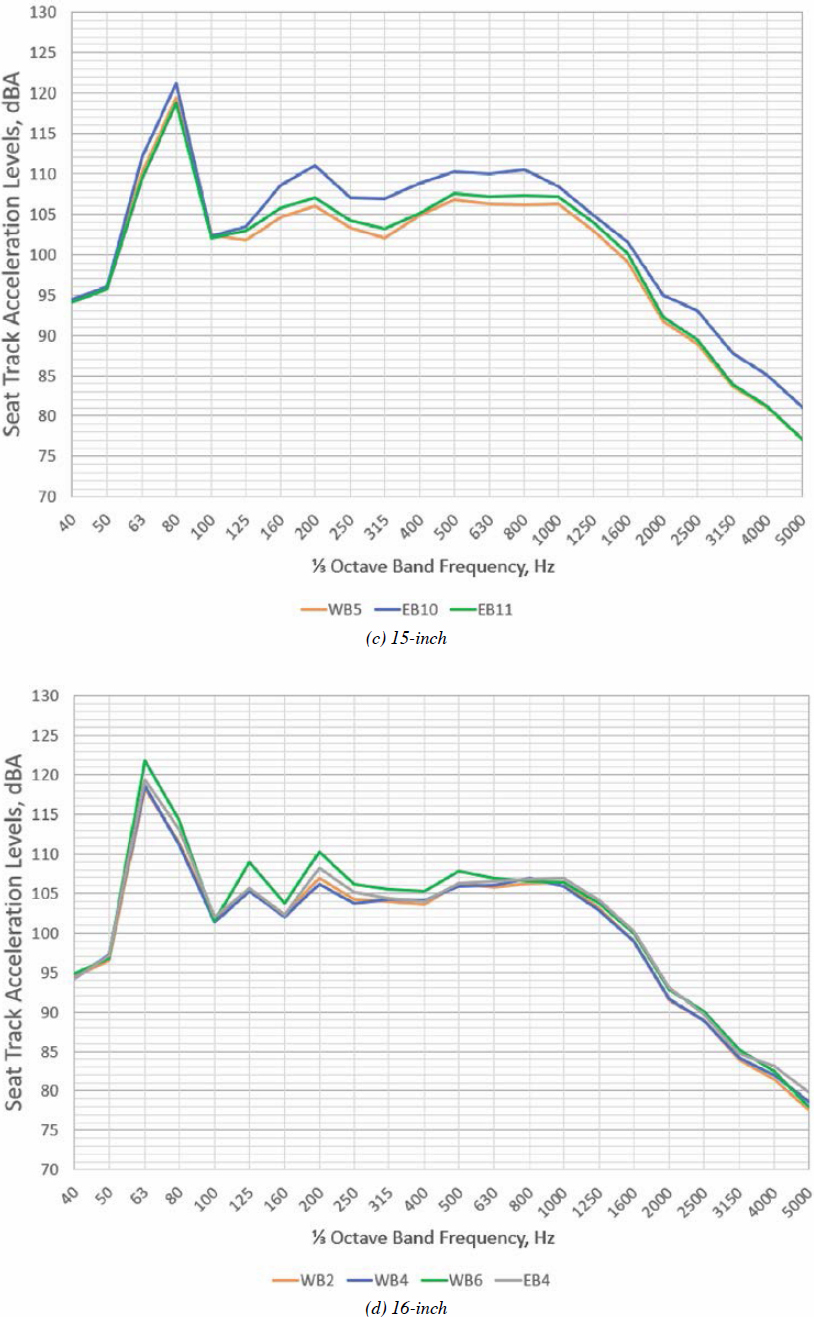
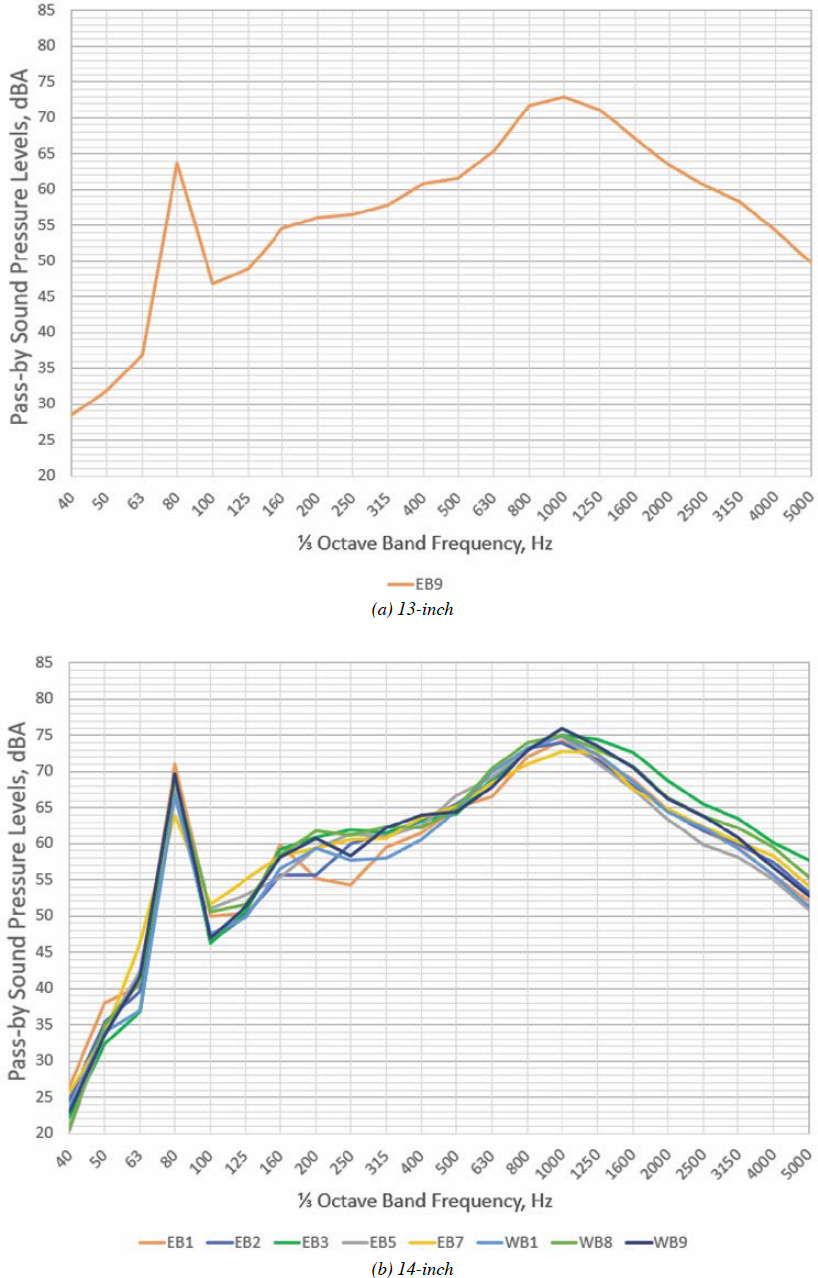
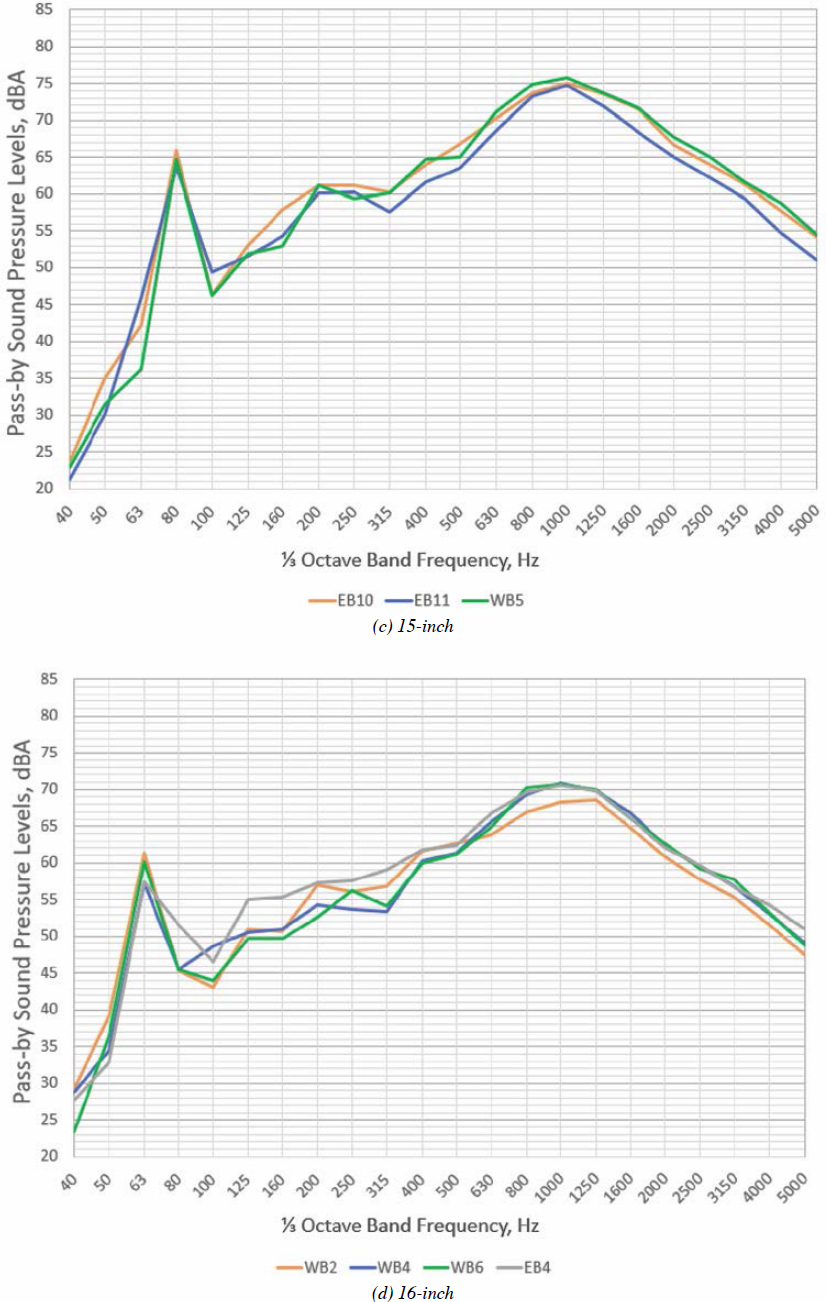
As discussed previously, comparing the amplitudes at the excited frequencies of the spectra for each test site is critical, especially at the Washington test sites since the off-strips pavement is chip seal. Figure 50 shows the spectra for the (a) 13-inch, (b) 14-inch, (c) 15-inch, and (d) 16-inch sites, as measured at the CC microphone. Figure 51 shows the same for the ST sensor.
Comparing the amplitudes at the excited frequencies for each site, with both sensors, the highest peak levels for each wavelength at the CC microphone occur at: EB9 (13-inch wavelength), EB3 (14-inch wavelength), EB10 (15-inch wavelength), and WB6 (16-inch wavelength). Comparing the spectra for these four sites, EB3 had the highest peak level at both sensors.
At 45 mph, the highest peak levels for each wavelength at the CC microphone and ST accelerometer occurred at the same sites as at 60 mph.
Comparison of Exterior Pass-By Measurements
Reducing noise levels propagated to the wayside is one of the main objectives of this study. Acceptable noise level reductions (or on/off increment levels) to meet this objective were not established prior to this research. However, the lower the on/off increments at the 25-foot pass-by microphone, the better. Since the foremost purpose of rumble strips is to alert drivers of lane departure, that should be considered when evaluating the pass-by results. The pass-by noise levels are intended to confirm lower levels than measured on the standard rectangular rumble strip design. Note that all increments for pass-by provided in this chapter reflect overall levels calculated by summing the energy between 31.5 and 200 Hz to reduce the impact of the chip seal pavement on the results.
Figure 52 shows the on/off increments for all test vehicles measured at each of the 20 sinusoidal test sites from a microphone positioned 25 feet from the center of the test vehicle. Sites with 12-, 13-, and 14-inch wavelengths have average pass-by on/off increments of 5.5 to 7 dB, which are the highest of all the sites. Sites with 15- and 16-inch wavelengths had average increments of about 1.5 to 3 dB. The lowest average levels occurred at sites with 17-, 18-, and 24-inch wavelengths and were about 1 dB or less, which would likely not be audible differences to people along the wayside. While sites with 17-, 18-, and 24-inch wavelengths did have the lowest average increments, which would be optimal for pass-by results, these rumble strip designs did not meet the interior noise and vibration on/off increment threshold of 10 dB.
At 45 mph, the average pass-by on/off increments for all wavelengths was 2 dB or below, which would barely be perceptible.
On average, the 14-inch wavelength sites generate the highest on/off differences along the wayside at 60 mph, while 13-inch wavelength sites generate the highest at 45 mph. Sites with 15- and 16-inch wavelengths resulted in average on/off differences that would have little to no perceptibility along the wayside at both speeds.
Figure 53 shows the on/off increments for all test vehicles and at all test sites versus amplitude at 60 mph. The increments in Figure 51 were calculated at the time of the maximum overall level during the pass-by event. As identified for the vehicle interior measurements, sites with ⅜-inch peak-to-peak amplitudes had the lowest average on/off increments of about 2 dB. The highest average increments of 6 dB were measured at the sites with amplitudes of ![]() and ½ inches. At 45 mph, the average increments were below 2 dB for all amplitudes.
and ½ inches. At 45 mph, the average increments were below 2 dB for all amplitudes.
Figure 54 shows the on/off increments versus the recess of each site at 60 mph. While the average increments at both recesses were within 2 dB of each other at 60 mph, which is statistically unremarkable, lower average increments were found at the 0-inch recess sites. Note, higher average increments were measured at the 0-inch recess sites on the vehicle interior. This provides the optimal results: lower on/off increments along the wayside and higher on/off increments on the vehicle interior. The average increments at both 0- and ⅛-inch recesses at 45 mph were virtually 0 dB.
Figure 55 shows the spectra for the (a) 13-inch, (b) 14-inch, (c) 15-inch, and (d) 16-inch sites as measured at the 25-foot pass-by microphone at 60 mph. Comparing the amplitudes at excited frequencies for each site, the lowest peak levels for each wavelength at the pass-by location occur at EB9 (13-inch wavelength), EB7 (14-inch wavelength), EB11 (15-inch wavelength), and WB4 (16-inch wavelength). Considering the peaks at the excited frequency bands, the optimal results were found at the 16-inch wavelength site (WB4).
Comparing the amplitudes at excited frequencies for each site at 45 mph, the lowest peak levels for each wavelength occur at EB9 (13-inch wavelength), EB7 (14-inch wavelength), EB10 (15-inch wavelength), and EB4 (16-inch wavelength). Considering the peaks at the excited frequency bands, the optimal results were found at the 16-inch wavelength site (EB4).
Optimal Designs
Table 5 summarizes all the sites and dimensions, as well as the average on/off increments calculated across all test vehicles for the pass-by microphone and both interior sensors at 60 mph. The goal for the designs is to achieve interior on/off increments of 10 dB or more for interior noise and vibration levels as measured at the CC microphone location and the seat track accelerometer location. For pass-by noise, the on/off increment is to be 5 dB or less. From Table 5, seven designs achieve the interior goals, and eight achieve the pass-by goal. However, only one design achieves all three goals. This is the design at site EB10 (bolded in Table 5), which has a wavelength of 15 inches, a peak-to-peak amplitude of 7/16 inches, and a recess of 0 inches. However, several sites produced performance within about 1 dB of these goals.
The results in Table 5 are reordered in Table 6 based on the average of the two interior parameters (i.e., average of the interior sound level and seat track acceleration level) in ascending order, which corresponds to the ability of the rumble strip to alert the vehicle operator of a road/lane departure. The designs with average interior measurements that meet the 10 dBA criterion are unshaded in Table 6. Of the eight designs meeting the 10 dB criterion for interior response, the wavelengths range from 13 to 16 inches. Within this subset, all the peak-to-peak sinusoidal amplitudes range from ![]() to ½ inches. All but one of the sites have recesses of 0 inches. Table 7 shows the data from Table 5 re-sorted based on the pass-by on/off-rumble increment in descending order. Using a pass-by increment of 5 dB or less as a criterion, the results that meet this are unshaded and range from 4.7 dB down to 0 dB. Of these designs, only EB10 with a 15-inch wavelength and WB6 with a 16-inch wavelength meet both the average interior criterion of 10 dB
to ½ inches. All but one of the sites have recesses of 0 inches. Table 7 shows the data from Table 5 re-sorted based on the pass-by on/off-rumble increment in descending order. Using a pass-by increment of 5 dB or less as a criterion, the results that meet this are unshaded and range from 4.7 dB down to 0 dB. Of these designs, only EB10 with a 15-inch wavelength and WB6 with a 16-inch wavelength meet both the average interior criterion of 10 dB
Table 5. Installed dimensions of the sinusoidal rumble strips with average on/off increments for all test vehicles, 60 mph.
| Site | Measured Dimensions | On/Off Increments | ||||
|---|---|---|---|---|---|---|
| Wavelength (in.) | Amplitude (in.) | Recess (in.) | CC Mic. | ST Accel. | Pass-by Mic. | |
| WB1 | 14 | 3/8 | 1/8 | 8.0 | 9.4 | 3.6 |
| WB2 | 16 | 3/8 | 1/8 | 7.3 | 10.2 | 0.6 |
| WB3 | 18 | 3/8 | 1/8 | 4.6 | 8.1 | 0.0 |
| WB4 | 16 | 5/16 | 0 | 6.8 | 10.4 | 1.4 |
| WB5 | 15 | 5/16 | 0 | 6.3 | 10.4 | 0.8 |
| WB6 | 16 | 1/2 | 0 | 9.7 | 13.3 | 2.7 |
| WB7 | 12 | 3/8 | 1/8 | 5.9 | 9.7 | 6.4 |
| WB8 | 14 | 7/16 | 0 | 10.0 | 12.1 | 7.6 |
| WB9 | 14 | 1/2 | 1/8 | 10.3 | 11.8 | 10.2 |
| EB1 | 14 | 5/16 | 0 | 10.1 | 11.2 | 8.7 |
| EB2 | 14 | 5/16 | 0 | 10.5 | 11.6 | 9.9 |
| EB3 | 14 | 1/2 | 0 | 12.6 | 14.2 | 5.5 |
| EB4 | 16 | 3/8 | 0 | 8.5 | 11.1 | 1.6 |
| EB5 | 14 | 7/16 | 1/8 | 7.8 | 9.9 | 5.4 |
| EB6 | 24 | 3/8 | 0 | 3.2 | 6.9 | 0.0 |
| EB7 | 14 | 5/16 | 0 | 5.7 | 6.8 | 1.5 |
| EB8 | 17 | 3/8 | 0 | 4.5 | 7.1 | 0.9 |
| EB9 | 13 | 5/16 | 0 | 11.6 | 10.8 | 5.7 |
| EB10 | 15 | 7/16 | 0 | 11.7 | 13.1 | 4.7 |
| EB11 | 15 | 5/16 | 1/8 | 7.5 | 9.6 | 4.3 |
Table 6. Sinusoidal rumble strip designs rank-ordered by the average of the interior noise and seat track acceleration increments at 60 mph – lowest to highest.
| Site | Measured Dimensions | On/Off Increments | |||||
|---|---|---|---|---|---|---|---|
| Wavelength (in.) | Amplitude (in.) | Recess (in.) | CC Mic. (dB) | ST Accel. (dB) | Interior Avg (dB) | Pass-by Mic. (dB) | |
| EB6 | 24 | 1/8 | 0 | 3.2 | 6.9 | 5.05 | 0 |
| EB8 | 17 | 1/8 | 0 | 4.5 | 7.1 | 5.8 | 0.9 |
| EB7 | 14 | 5/16 | 0 | 5.7 | 6.8 | 6.25 | 1.5 |
| WB3 | 18 | 1/8 | 1/8 | 4.6 | 8.1 | 6.35 | 0 |
| WB7 | 12 | 1/8 | 1/8 | 5.9 | 9.7 | 7.8 | 6.4 |
| WB5 | 15 | 5/16 | 0 | 6.3 | 10.4 | 8.35 | 0.8 |
| EB11 | 15 | 5/16 | 1/8 | 7.5 | 9.6 | 8.55 | 4.3 |
| WB4 | 16 | 5/16 | 0 | 6.8 | 10.4 | 8.6 | 1.4 |
| WB1 | 14 | 1/8 | 1/8 | 8 | 9.4 | 8.7 | 3.6 |
| WB2 | 16 | 1/8 | 1/8 | 7.3 | 10.2 | 8.75 | 0.6 |
| EB5 | 14 | 7/16 | 1/8 | 7.8 | 9.9 | 8.85 | 5.4 |
| EB4 | 16 | 1/8 | 0 | 8.5 | 11.1 | 9.8 | 1.6 |
| EB1 | 14 | 5/16 | 0 | 10.1 | 11.2 | 10.65 | 8.7 |
| WB8 | 14 | 7/16 | 0 | 10 | 12.1 | 11.05 | 7.6 |
| WB9 | 14 | 1/2 | 1/8 | 10.3 | 11.8 | 11.05 | 10.2 |
| EB2 | 14 | 5/16 | 0 | 10.5 | 11.6 | 11.05 | 9.9 |
| EB9 | 13 | 5/16 | 0 | 11.6 | 10.8 | 11.2 | 5.7 |
| WB6 | 16 | 1/2 | 0 | 9.7 | 13.3 | 11.5 | 2.7 |
| EB10 | 15 | 7/16 | 0 | 11.7 | 13.1 | 12.4 | 4.7 |
| EB3 | 14 | 1/2 | 0 | 12.6 | 14.2 | 13.4 | 5.5 |
Table 7. Sinusoidal rumble strip designs rank ordered by pass-by noise increments at 60 mph – highest to lowest.
| Site | Measured Dimensions | On/Off Increments | |||||
|---|---|---|---|---|---|---|---|
| Wavelength (in.) | Amplitude (in.) | Recess (in.) | CC Mic. (dB) | ST Accel. (dB) | Interior Avg (dB) | Pass-by Mic. (dB) | |
| WB9 | 14 | 1/2 | 1/8 | 10.3 | 11.8 | 11.05 | 10.2 |
| EB2 | 14 | 5/16 | 0 | 10.5 | 11.6 | 11.05 | 9.9 |
| EB1 | 14 | 5/16 | 0 | 10.1 | 11.2 | 10.65 | 8.7 |
| WB8 | 14 | 7/16 | 0 | 10 | 12.1 | 11.05 | 7.6 |
| WB7 | 12 | 3/8 | 1/8 | 5.9 | 9.7 | 7.8 | 6.4 |
| EB9 | 13 | 5/16 | 0 | 11.6 | 10.8 | 11.2 | 5.7 |
| EB3 | 14 | 1/2 | 0 | 12.6 | 14.2 | 13.4 | 5.5 |
| EB5 | 14 | 7/16 | 1/8 | 7.8 | 9.9 | 8.85 | 5.4 |
| EB10 | 15 | 7/16 | 0 | 11.7 | 13.1 | 12.4 | 4.7 |
| EB11 | 15 | 5/16 | 1/8 | 7.5 | 9.6 | 8.55 | 4.3 |
| WB1 | 14 | 3/8 | 1/8 | 8 | 9.4 | 8.7 | 3.6 |
| WB6 | 16 | 1/2 | 0 | 9.7 | 13.3 | 11.5 | 2.7 |
| EB4 | 16 | 3/8 | 0 | 8.5 | 11.1 | 9.8 | 1.6 |
| EB7 | 14 | 5/16 | 0 | 5.7 | 6.8 | 6.25 | 1.5 |
| WB4 | 16 | 5/16 | 0 | 6.8 | 10.4 | 8.6 | 1.4 |
| EB8 | 17 | 3/8 | 0 | 4.5 | 7.1 | 5.8 | 0.9 |
| WB5 | 15 | 5/16 | 0 | 6.3 | 10.4 | 8.35 | 0.8 |
| WB2 | 16 | 3/8 | 1/8 | 7.3 | 10.2 | 8.75 | 0.6 |
| EB6 | 24 | 3/8 | 0 | 3.2 | 6.9 | 5.05 | 0 |
| WB3 | 18 | 3/8 | 1/8 | 4.6 | 8.1 | 6.35 | 0 |
or greater and the pass-by criterion of 5 dB or less. However, there are several options that come within less than 1 dB of meeting both criteria. These include EB3 and EB9 with wavelengths of 14 and 13 inches, respectively. Both have no recess, and EB9 has a smaller wavelength than the others at 13 inches. EB4 is within 0.2 dB of the interior criterion with a wavelength of 16 inches, amplitude of ⅜ inches, and 0-inch recess; however, the interior noise increment by itself is only 8.5 dB.
Table 8 presents the measurement results at 45 mph sorted from lowest to highest average interior increment similar to Table 6 for 60 mph, with the unshaded rows representing the strips that achieved 10 dB or more. Considering interior only, none of the designs achieve the 10 dB increment level. Comparing Table 8 to Table 6, only EB10 and EB1 with a 15-inch and 14-inch wavelength, respectively, are shown to achieve the 10 dB or greater interior goal at both 60 and 45 mph; however, EB1 does not meet the pass-by goal at 45 mph. As a group, the interior noise increments at 45 mph tend to be less than those measured for 60 mph, with none achieving 10 dB or greater. Table 9 presents 45 mph results sorted from highest pass-by level to lowest as in Table 7 for 60 mph. The designs that produced pass-by increments of less than 1 dB are not shaded in this presentation. As a group, the pass-by increments are lower at 45 mph than at 60 mph except for the WB2 and WB3 designs. Further, all the pass-by increments are at least 1 dB below the 5 dB criterion and all but site WB1 are 3 dB or lower. The effect of sinusoidal profile recess appears to have a mixed effect on-strip design. In Table 6, for all the designs that achieve interior averages of 10 dB or greater, only one out of the eight (WB9) has a non-zero recess; however, for the pass-by increment (Table 7) no such trend is seen. For 45 mph, all the pass-by increments below 1 dB have no recess except for one out of the 12 (EB5).
In summary, for 60 mph, site EB10 with a 15-inch wavelength, ![]() -inch peak-to-peak amplitude, and no recess performed best of all designs for interior noise and vibration and pass-by noise and met their respective criterion. The other 15-inch wavelength sites, WB5 and EB11, did not meet the interior criterion. These sites had amplitudes of only
-inch peak-to-peak amplitude, and no recess performed best of all designs for interior noise and vibration and pass-by noise and met their respective criterion. The other 15-inch wavelength sites, WB5 and EB11, did not meet the interior criterion. These sites had amplitudes of only ![]() -inches with both having average
-inches with both having average
Table 8. Sinusoidal rumble strip designs rank ordered by the average of the interior noise and seat track acceleration increments at 45 mph – lowest to highest.
| Site | Measured Dimensions | On/Off Increments | |||||
|---|---|---|---|---|---|---|---|
| Wavelength (in.) | Amplitude (in.) | Recess (in.) | CC Mic. (dB) | ST Accel. (dB) | Interior Avg (dB) | Pass-by Mic. (dB) | |
| WB7 | 12 | 3/8 | 1/8 | 2.5 | 8.2 | 5.4 | 1.3 |
| WB6 | 16 | 1/2 | 0 | 2.7 | 8.5 | 5.6 | 0.0 |
| EB9 | 13 | 5/16 | 0 | 5.3 | 7.0 | 6.1 | 0.8 |
| EB5 | 14 | 7/16 | 1/8 | 5.2 | 8.1 | 6.6 | 0.0 |
| EB7 | 14 | 5/16 | 0 | 5.8 | 9.9 | 7.9 | 0.0 |
| EB6 | 24 | 3/8 | 0 | 5.6 | 10.2 | 7.9 | 0.0 |
| EB4 | 16 | 3/8 | 0 | 5.8 | 10.2 | 8.0 | 0.0 |
| EB3 | 14 | 1/2 | 0 | 4.9 | 12.1 | 8.5 | 0.0 |
| WB5 | 15 | 5/16 | 0 | 5.2 | 12.0 | 8.6 | 0.0 |
| EB2 | 14 | 5/16 | 0 | 6.8 | 10.6 | 8.7 | 0.5 |
| WB8 | 14 | 7/16 | 0 | 8.0 | 9.7 | 8.9 | 0.0 |
| WB9 | 14 | 1/2 | 1/8 | 7.1 | 10.7 | 8.9 | 2.1 |
| WB4 | 16 | 5/16 | 0 | 6.4 | 12.5 | 9.4 | 1.7 |
| EB8 | 17 | 3/8 | 0 | 7.2 | 12.9 | 10.0 | 0.2 |
| EB11 | 15 | 5/16 | 1/8 | 6.8 | 13.6 | 10.2 | 3.0 |
| WB2 | 16 | 3/8 | 1/8 | 6.9 | 14.5 | 10.7 | 1.8 |
| EB10 | 15 | 7/16 | 0 | 7.3 | 14.6 | 10.9 | 2.5 |
| WB1 | 14 | 3/8 | 1/8 | 8.2 | 14.5 | 11.4 | 3.7 |
| EB1 | 14 | 5/16 | 0 | 9.3 | 13.8 | 11.5 | 0.7 |
| WB3 | 18 | 3/8 | 1/8 | 9.9 | 17.0 | 13.5 | 1.3 |
Table 9. Sinusoidal rumble strip designs rank ordered by pass-by noise increments at 45 mph – highest to lowest.
| Site | Measured Dimensions | On/Off Increments | |||||
|---|---|---|---|---|---|---|---|
| Wavelength (in.) | Amplitude (in.) | Recess (in.) | CC Mic. (dB) | ST Accel. (dB) | Interior Avg (dB) | Pass-by Mic. (dB) | |
| WB1 | 14 | 3/8 | 1/8 | 8.2 | 14.5 | 11.4 | 3.7 |
| EB11 | 15 | 5/16 | 1/8 | 6.8 | 13.6 | 10.2 | 3.0 |
| EB10 | 15 | 7/16 | 0 | 7.3 | 14.6 | 10.9 | 2.5 |
| WB9 | 14 | 1/2 | 1/8 | 7.1 | 10.7 | 8.9 | 2.1 |
| WB2 | 16 | 3/8 | 1/8 | 6.9 | 14.5 | 10.7 | 1.8 |
| WB4 | 16 | 5/16 | 0 | 6.4 | 12.5 | 9.4 | 1.7 |
| WB7 | 12 | 3/8 | 1/8 | 2.5 | 8.2 | 5.4 | 1.3 |
| WB3 | 18 | 3/8 | 1/8 | 9.9 | 17.0 | 13.5 | 1.3 |
| EB9 | 13 | 5/16 | 0 | 5.3 | 7.0 | 6.1 | 0.8 |
| EB1 | 14 | 5/16 | 0 | 9.3 | 13.8 | 11.5 | 0.7 |
| EB2 | 14 | 5/16 | 0 | 6.8 | 10.6 | 8.7 | 0.5 |
| EB8 | 17 | 3/8 | 0 | 7.2 | 12.9 | 10.0 | 0.2 |
| EB7 | 14 | 5/16 | 0 | 5.8 | 9.9 | 7.9 | 0.0 |
| WB6 | 16 | 1/2 | 0 | 2.7 | 8.5 | 5.6 | 0.0 |
| WB8 | 14 | 7/16 | 0 | 8.0 | 9.7 | 8.9 | 0.0 |
| EB5 | 14 | 7/16 | 1/8 | 5.2 | 8.1 | 6.6 | 0.0 |
| EB3 | 14 | 1/2 | 0 | 4.9 | 12.1 | 8.5 | 0.0 |
| EB6 | 24 | 3/8 | 0 | 5.6 | 10.2 | 7.9 | 0.0 |
| WB5 | 15 | 5/16 | 0 | 5.2 | 12.0 | 8.6 | 0.0 |
| EB4 | 16 | 3/8 | 0 | 5.8 | 10.2 | 8.0 | 0.0 |
interior increments of below 8.6 dB. Of strips in Table 6 with average interior increments greater than 10 dB, seven out of the eight had no recess. For pass-by, the results for recess were not as conclusive as only eight out of 12 had no recess. Concerning wavelength, the 14- to 24-inch designs produced pass-by increments of less than 5 dB. However, for the 14-inch designs, only two out of the eight designs achieved the criterion of pass-by levels being less than 5 dB.
In summary, for 45 mph, all the designs met the pass-by criterion by being lower than 5 dB. Seven of the sites met or exceeded the 10 dB criterion for the average of interior noise and vibration; however, the noise increments varied from 6.8 to 9.9 dB. The two highest for interior noise were WB3 (18-inch wavelength) and EB1 (14-inch wavelength). In the Midwest testing, a design with an 18-inch wavelength and ⅜-inch amplitude performed poorly with an average interior increment of 4.8 dB (see Appendix C). The EB1 design was also repeated for EB7 and produced an average interior increment of 7.9 dB. Sites WB1 and EB10 also performed reasonably well with average interior increments in the middle of those with interior averages of 10 dB or greater.
For 60 mph, the most optimal designs have the following features:
- Sinusoidal wavelengths ranging from 13 to 16 inches. Considering potential issues with installation consistency, a tolerance of ±½ inch would be maintained.
- A recess of 0 inches is preferable. If other factors such as damage to the strips is likely, a ⅛-inch is typically only a slight degradation.
- Peak-to-peak amplitudes of
 to ½ inches tend to provide the lowest pass-by increments.
For 45 mph, the most optimal designs have the following features:
- Sinusoidal wavelengths ranging from 14 to 16 inches, and a tolerance of ±½ inch would be maintained.
- Recesses of 0 and ⅛ inches displayed no trends.
- Peak-to-peak amplitudes of
 to ½ provided no pass-by increments over 3.7 dB with 12 designs less than 1 dB.


