Evaluation of the Transport Airplane Risk Assessment Methodology (2022)
Chapter: 4 Improvements for the Input Data to TARAM
4
Improvements for the Input Data to TARAM
This chapter discusses the findings associated with the gaps in the current status of inputs to the Transport Airplane Risk Assessment Methodology (TARAM) and points to the recommendations in Chapters 3 and 5 that address these gaps to improve input data to TARAM.
IMPROVING COMPLETENESS, ACCESSIBILITY, AND QUALITY OF INPUT DATA TO TARAM
The quality of the estimated risk depends on the trustworthiness and quality of the input data. While the current TARAM Handbook requires specific input data to assess the risk of failure, the data sources to be used are not always explicitly specified. Thus, the TARAM analysts have to decide on the best available data sources for their risk calculations. Without clear guidance on what data to use, the TARAM analysis may produce results that lack the consistency and reproducibility required for regulatory purposes. Additionally, some of the required data sources are either outdated or not always available. The following list provides examples of deficiencies in TARAM input data:
- Several of the risk computations require knowing the injury ratios as input; however, the current injury ratio calculations are at least a decade old, dating back to around 2010, and the calculations used to derive the injury ratios are not documented, making it impossible to review assumptions and reproduce their calculations.
- When actual operational data are not available, TARAM analysts sometimes need to obtain design and certification data from the design approval holder.1 The process for obtaining data not provided to the Federal Aviation Administration (FAA) under Part 21.3 or by voluntary agreement is to have the Aviation Safety Engineer analysts request it from their design approval holder counterpart. For larger approval holders, the request is made through the Aircraft Certification Office (ACO) continued operational safety (COS) group to the design approval holder counterpart. Currently, there is no consistent framework documented for the data sharing process; hence, the data accessibility is left to the discretion of each design approval holder and thus can vary.
___________________
1 Federal Aviation Administration, 2012, “Monitor Safety/Analyze Data (MSAD),” Order 8110.107A, Washington, DC: Aircraft Certification Service (AIR).
- The quantification of the non-detection probability (ND), required as input to the wear-out failure assessment, relies heavily on subjective judgment by an analyst,2 and the data sources that can support the ND quantification are not explicitly identified in the TARAM Handbook.
- Multiple TARAM inputs can be influenced by the performance of humans such as pilots, cabin crew, and maintenance crew. For instance, if an intervention by pilots is included as part of the corrective action, the calculation of the Control Program Risk requires conditional probabilities that account for the effectiveness of the manual intervention. As another example, the ND for the wear-out assessment can be significantly influenced by the maintenance crew performance. In the current risk calculations in TARAM, however, human reliability analysis is missing, and no human reliability data source is explicitly identified in the TARAM Handbook. Based on the FAA briefing regarding the Seattle ACO Transport Airplane Safety Manual, when assessments require pilot human reliability and error analysis, flight test pilots’ subjective judgment has been used and, if needed, simulator data have been created to support the analysis.3 Currently, there is no documented framework for the human reliability data generation or sharing processes. The incorporation of human reliability analysis into the TARAM process is discussed in Chapter 5 leading to Recommendation 5.
- Common cause failure (CCF) is analyzed qualitatively in the Design Certificate4 and is considered as one of the Qualitative Safety Criteria in the COS decision-making for transport airplanes (Table 9 in the FAA Seattle ACO Branch Transport Airplane Safety Manual5). However, quantitative CCF analysis is not conducted in the TARAM analysis or used in the COS decision-making, and no CCF data source is explicitly identified in the TARAM Handbook. To incorporate quantitative CCF analysis into TARAM (see Recommendation 4 in Chapter 5), the CCF event database is required. For instance, for probabilistic risk assessment (PRA) of the U.S. commercial nuclear power plants, the U.S. Nuclear Regulatory Commission (U.S. NRC) maintains a CCF database and analysis system. Equipment failure data contributing to CCF events are extracted from the existing reporting data systems, including the Licensee Event Reports, Nuclear Plant Reliability Data System reports, as well as Equipment Performance and Information Exchange reports, and analyzed to estimate the CCF probabilities with consideration of uncertainties.6 The FAA could consider adopting the generic CCF rate parameters, from the U.S. NRC’s CCF database, with characterization of uncertainty associated with the degree of relevancy in equipment designs, operating conditions, and maintenance practices; however, an effort could be initiated to establish and maintain an aviation-specific CCF database, similar to the effort led by the U.S. NRC and Idaho National Laboratory for commercial nuclear power plants.7
- Engineering justifications for current risk thresholds, identified in the TARAM risk guidance table, may not be up to date.
Finding: Some of the TARAM inputs are quantified based on engineering judgment without consistent and documented data support. A consistent, complete, and up-to-date data source/repository for TARAM input data is needed.
___________________
2 For instance, as illustrated on slide 108 in S.I. Mariano and J. Craycraft, 2021, “FAA: Two Case Studies of TARAM Assessment, Part I and Part 2,” Presentation to the Committee on Transport Airplane Risk Assessment Methodology Questions, October 8, Washington, DC: National Academies of Sciences, Engineering, and Medicine.
3 M. Violette, Continued Operational Safety (COS) Technical Advisor, Aviation Safety COS Program Management AIR-722, 2022, “Application of MSAD & TARAM on Boeing Airplanes,” PowerPoint Presentation, Washington, DC: Federal Aviation Administration, February 4.
4 Federal Aviation Administration, 2000, “Analysis Techniques,” Ch. 9 in FAA System Safety Handbook, Washington, DC, http://rapeutation.com/FAAChap9_1200.pdf.
5 Federal Aviation Administration, 2021, Transport Airplane Safety Manual, September 1, FAA Aviation Safety Report, Seattle, WA: Transport Airplane Directorate ACO Branch.
6 T.E. Wierman, D.M. Rasmuson, and A. Mosleh, 2007, Common-Cause Failure Database and Analysis System: Event Data Collection, Classification, and Coding (NUREG/CR-6268, INEL/EXT-07-12969, Revision 1), Washington, DC: U.S. Nuclear Regulatory Commission.
7 Ibid.
Finding: Access to the data for TARAM input is provided at the discretion of each design certificate holder. For consistency throughout the industry, an industry-wide framework for data access in support of TARAM is needed.
To improve the completeness, accessibility, and quality of TARAM input data, the following considerations are needed:
- In line with Recommendation 3 (stated in Chapter 3), the FAA needs to reach COS agreements with airplane type certificate holders, manufacturers, their suppliers, and aircraft operators to develop an agreed-upon framework by which ASEs can access, in a timely manner, relevant data in support of TARAM inputs. Currently, clear documentation does not exist regarding which data are to be held and in what format they will be generated, owned, and maintained by each stakeholder.
- A team of data specialists could oversee all input data to TARAM to allow for a more homogeneous and consistent use of data across ACOs. This team could (1) update, document, and maintain (when appropriate) current data sources; (2) seek venues for a timely manner access to data streams from airlines, certificate holders, and original equipment manufacturers (OEMs); and (3) more comprehensively use the inspection and reporting, design certificate, and simulator data and other information sources, for example, the ones associated with CCF analysis and Human Reliability Analysis (HRA).
- In addition, the FAA could create and implement a periodic independent review process for assessing the quality of TARAM data sources, data access processes, and data mining techniques.
CHARACTERIZING UNCERTAINTY IN INPUT DATA TO TARAM
Most data inputs to TARAM lack uncertainty characterization. Uncertainties in the TARAM input data can be characterized by leveraging approaches used in PRA of other complex technological systems, such as those for the nuclear power plants8 and space exploration.9 Uncertainty considered in PRA arises from two distinct sources: the intrinsic random behavior of a system (referred to as “aleatory uncertainty”) and the lack of specific information or full knowledge associated with various elements of the risk model (referred to as “epistemic uncertainty”).10 Examples of epistemic uncertainty include the lack of precise knowledge about the model, either because the model and/or input parameters are unknown, or because of uncertainties in model specifications as the level of details in modeling depends on the judgments of multiple experts and/or a statistical learning of features.
In PRA, the common way of coherently quantifying both aleatory and epistemic uncertainties is through the use of probability distributions.11 In this approach, aleatory uncertainty is handled by a probabilistic risk model itself, where the randomness associated with the full system performance (e.g., success versus failure) is captured through “events” represented by discrete stochastic processes, such as a binomial process. The calculation of the probabilistic risk model with consideration of aleatory uncertainty generates point estimates of risk measures. Epistemic uncertainty is treated by quantifying uncertainty bounds for the estimated risk measures by performing three steps: (1) identifying potential sources of epistemic uncertainty, (2) characterizing uncertainty associated with each source using a statistical measure (e.g., confidence intervals, probability distributions), and (3) propagating these uncertainties from their sources up to the risk model outputs. The first two steps are explained in this chapter, and the methods associated with the third step are included in Chapter 5.
As a result of uncertainty quantification, the aggregated impact of the epistemic uncertainties on the risk estimations and, ultimately, on the risk-informed decision-making, can be evaluated. The readers are referred to
___________________
8 American Society of Mechanical Engineers and American Nuclear Society, 2008, “ASME/ANS RA-S−2008: Standard for Level 1/Large Early Release Frequency Probabilistic Risk Assessment for Nuclear Power Plant Applications.”
9 National Aeronautics and Space Administration, 2011, Probabilistic Risk Assessment Procedures Guide for NASA Managers and Practitioners, NASA/SP-2011-3421, Washington, DC: NASA Center for AeroSpace Information.
10 U.S. Nuclear Regulatory Commission, 2013, “Glossary of Risk-Related Terms in Support of Risk-Informed Decisionmaking (NUREG-2122),” Washington, DC.
11 S. Kaplan and B.J. Garrick, 1981, “On the Quantitative Definition of Risk,” Risk Analysis 1(1):11–27.
the Quantification of Margins and Uncertainties (QMU),12 a method developed in the late 1990s by the National Nuclear Security Administration Laboratories as an example of how to assess the reliability of complex systems considering the uncertainty in their inputs. The challenge in evaluating the uncertainty in the reliability of a complex system lies in correctly quantifying the aggregated impact of various uncertainty sources and characterizing the statistical dependencies among the sources of uncertainties. Hence, for an accurate uncertainty analysis, it is essential to model the dependencies among the various components of a whole system (see Recommendation 4 in Chapter 5, which addresses dependency treatment) and dependencies among the sources of uncertainties (see Recommendation 7 in Chapter 5, which addresses uncertainty characterization).
In the current TARAM practice, the dependencies among aleatory uncertainty sources and various system components are modeled by constructing a probabilistic causal chain (e.g., TARAM Handbook, Figure 3), considering the randomness associated with the events and conditions included in the causal chain. However, the TARAM Handbook does not provide any explicit guidance on the treatment of epistemic uncertainty. Based on the FAA briefing regarding the Seattle ACO Transport Airplane Safety Manual, in the current practice of COS decision-making for transport airplanes, risk sensitivity is sometimes studied by examining the impact of varying each input or modeling assumption on the risk outputs. The TARAM sensitivity analysis is conducted in a one-at-a-time manner and using only a predefined discrete input value or variation in a modeling assumption; thus, the current practice is limited and does not capture the entire range of epistemic uncertainty. Because some of the TARAM inputs are estimated based on limited empirical data (e.g., operating experience data) or engineering judgments, the epistemic uncertainty of the estimated TARAM risk outputs induced by the TARAM input uncertainty can be quite large, possibly creating a significant impact on the COS decisions. The lack of quantitative treatment of epistemic uncertainty may mislead the COS decision-making, especially when the TARAM risk outputs are close to the thresholds defined in the risk guidelines.
Finding: It is necessary to characterize the uncertainty associated with the TARAM input data and take appropriate conservative actions when uncertainties are large. The epistemic uncertainty associated with the TARAM input data could be so large that it may alter COS decisions, especially when the empirical data to support estimation of the TARAM inputs are limited (i.e., when less than several occurrences are observed in the historical operational data).
As stated above, epistemic uncertainties may also be induced by other sources associated with the models in TARAM, such as alternative assumptions and the level of detail in the models. The epistemic uncertainties associated with the models utilized in TARAM need to be analyzed by formal sensitivity analyses, which are explained in Chapter 5, in association with Recommendation 7.
To characterize epistemic uncertainty for the TARAM inputs, the potential sources of epistemic uncertainty can be identified. For instance, when a TARAM input is estimated based on very sparse data (e.g., only one event during the operating history), its associated epistemic uncertainty would be large and, therefore, could be identified as a potential source of uncertainty for further consideration. Then, among the identified sources of epistemic uncertainty associated with the TARAM input parameters, an analyst could select those that can have significant impact on the TARAM output uncertainty and include them in the scope of the formal uncertainty analysis. For this selection, expert judgment or results from a sensitivity analysis (if available) may be utilized. The comprehensive criteria for selecting the significant uncertainty sources need to be documented in the TARAM Handbook.
The uncertainty sources identified above could then be quantitatively characterized. For the uncertainty characterization, various statistical measures and techniques are available, and an adequate method needs to be selected based on the nature of the COS decision-making problem being analyzed and the level of supporting data and information available. Probability distributions could provide a useful mathematical description of uncertainty. For uncertainty characterization of the TARAM inputs, Bayesian analysis would be recommended. Bayesian analysis is a mathematical process to update the prior knowledge (represented by a “prior distribution”)
___________________
12 D. Eardley, H. Abarbanel, J. Cornwall, P. Dimotakis, S. Drell, F. Dyson, R. Garwin, et al., 2005, “Quantification of Margins and Uncertainties (QMU),” Report JSR-04-330, McLean, VA: JASON, The MITRE Corporation.
with evidence (represented by a “likelihood function”) in order to obtain the updated knowledge (represented by a “posterior distribution”) about an unknown of interest. Bayesian analysis offers three beneficial features for the uncertainty characterization of the TARAM inputs. First, it can offer a mathematically coherent paradigm for handling probability distributions and can deal with multiple data sources with various levels of data granularity and information content. Second, a Bayesian approach can provide a mechanism to continuously update the knowledge about the TARAM inputs whenever the new set of data becomes available. This feature helps the TARAM process quantify the epistemic uncertainty associated with the inputs more realistically by using the most updated data. Third, Bayesian analysis is capable of accounting for uncertainty induced by population variability,13 such as the variability in operational conditions, environmental factors, and human performance among diverse countries and operators.
Bayesian analysis can be applicable to various types of TARAM inputs, including the frequency of the condition under study, conditional probabilities in the TARAM causal chain, non-detection probability for wear-out failure analysis, injury rates, and human error data and performance-shaping factor data in human reliability analysis. The following example illustrates the application of Bayesian analysis to uncertainty characterization for the “rate of occurrence (F),” which is an input to the TARAM Constant Failure process. (The TARAM process is summarized in Chapter 2.) This example is included here to demonstrate the potential significance of considering epistemic uncertainties associated with the TARAM inputs in the COS decision-making
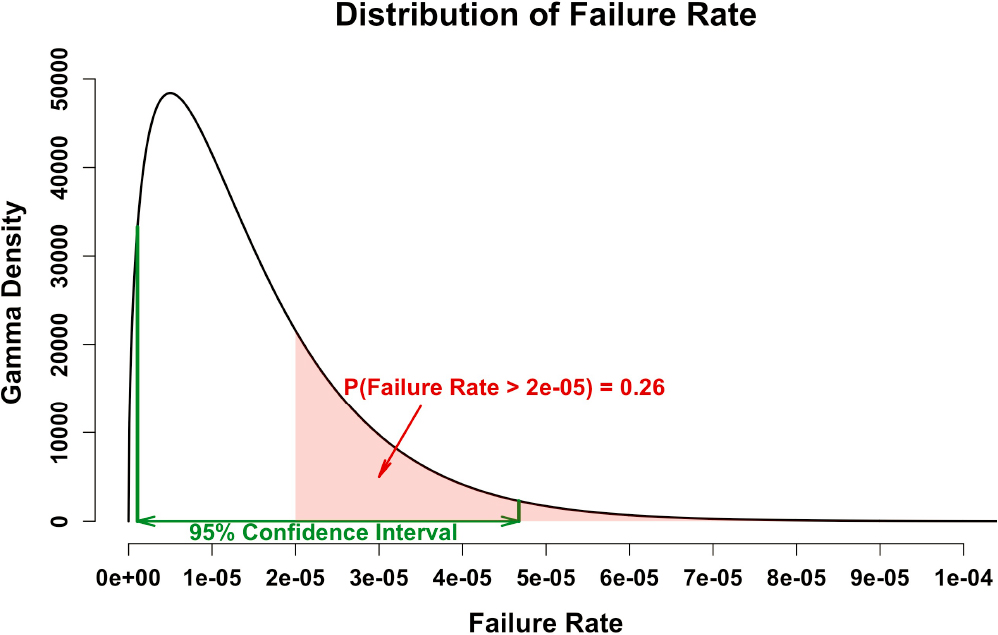
If analysts observe one failure during 100,000 flight hours, they could use these data to construct the likelihood function needed for Bayesian analysis. In the TARAM Constant Failure Rate Analysis, the number of failures is modeled as a Poisson random variable, and the likelihood function here can also be modeled by a Poisson distribution. If the prior information on the failure rate is not available, a Jeffreys non-informative distribution, equivalent to a Gamma distribution with the shape parameter a0 = 0.5 and rate parameter b0 = 0, is a reasonable choice14 for the prior distribution of the frequency of occurrence F. Using the Gamma-Poisson conjugate property in the Bayesian Analysis, the posterior distribution for the frequency of occurrence F is also a Gamma distribution with parameters a = 1.5 and b = 100,000. Figure 4.1 displays the posterior Gamma distribution along with the 95 percent confidence interval (1.079E-6, 4.674E-5) per flight hour. The confidence interval spans more than one order of magnitude, indicating that the epistemic uncertainty associated with the rate of occurrence (F) estimation is relatively large. Indeed, the width of the confidence interval is larger than the point estimate (1/100,000 = 1E-5 flight hour) by four-fold; and under this formulation, the probability that the failure rate is “2 occurrences per 100,000 flight hours” (i.e., the probability that the failure rate is actually twice as large as originally observed or the point estimate) is 0.26, which is a non-negligible probability. Thus, this epistemic uncertainty needs to be propagated up to the risk outputs and considered in the COS decision-making.
The characterized uncertainty in TARAM input data could be an input to the uncertainty propagation and sensitivity analysis methods that are discussed in Chapter 5 to support Recommendation 7, which states the need for incorporating uncertainty analysis into the TARAM process. Through uncertainty characterization and propagation, the uncertainty for the TARAM risk outputs could be quantified to quantitatively represent the degree of confidence in the estimated risk values. The resultant uncertainty of the TARAM risk outputs should be considered in the COS decision-making (Recommendation 8 in Chapter 6).
If a specific TARAM input is identified (based on sensitivity analysis discussed in Chapter 5) as the dominant contributor to the total uncertainty in TARAM output, refinements of its supporting data could be considered. One possible solution could be to develop a high-resolution model of the underlying causal process(es) and generate simulation-based data to update the TARAM input. For instance, if the epistemic uncertainty of the characteristic life parameter of a Weibull distribution used for calculating “DA”15 in the wear-out failure TARAM process (explained in Chapter 2) is the dominant uncertainty contributor, one possible approach could be to use a
___________________
13 U.S. Nuclear Regulatory Commission, 2003, Handbook of Parameter Estimation for Probabilistic Risk Assessment, NUREG/CR-6823, SAND2003-3348P, Washington, DC: Office of Nuclear Regulatory Research.
14 D. Kelly and C. Smith, 2011, Bayesian Inference for Probabilistic Risk Assessment: A Practitioner’s Guidebook, New York: Springer Science & Business Media.
15 In the wear-out failure TARAM analysis, DA is defined as “the number of airplanes predicted to experience the subject failure, if left undetected, during the time period under study” (Section 5 of the TARAM Handbook).
high-resolution physics-of-failure model (e.g., finite element analysis). The physics-of-failure simulation would be equipped with uncertainty quantification to make it probabilistic, creating a probabilistic physics-of-failure model.16 Bayesian analysis could then be used to facilitate the updating of the data-driven DA estimate with the probabilistic physics-of-failure simulation data.
___________________
16 M. Azarkhail and M. Modarres, 2012, “The Evolution and History of Reliability Engineering: Rise of Mechanistic Reliability Modeling,” International Journal of Performability Engineering 8(1):35–47.


