Transit Agency Goals and Non-Traditional Performance Indicators Focused on Equity (2024)
Chapter: Appendix A: Detailed Literature Review Documenting Agency Practices

APPENDIX A
Detailed Literature Review Documenting Agency Practices
Methodology
The research team developed and implemented a multi-phase literature review methodology, as described in Table 20. All results in the finding section were collected and processed using this method.
Table 20. Literature Review Methodology
| Phase | Description |
|---|---|
| Deep search conducted by the research team and TTI librarian |
|
| Thorough review of findings – multiple rounds |
|
| Phase | Description |
|---|---|
| Paraphrase and summarization assistance |
|
| Final literature review compilation and editing |
|
| Pre-publication review (future phase) |
|
Search terms were built by combining a search from the terms below in the tables labeled “A terms” and “B terms” using the following equation: Equit* + [term from A] + [term from B]. Example: equity AND transit AND goals
A terms
| Transit | Train | Trans* service |
| Transp* | Demand respons* | Bus |
| Public trans* | Paratransit | rail |
B terms
| goals | plan* | race |
| Stakeholder* | performa* | racism |
| Metric* | access* | ethnicity |
| data | income | demograph* |
| measure* | afford* | gender |
| analysis | Disabilit* | LGBTQ* |
| service* | disabled | redlin* |
| displac* | ADA | segregat* |
| renewal | Medic* | slave* |
| migra* | Doctor | engag* |
| intercity | veteran | Tool* |
| Evaluat* | Indicat* | Immigrant* |
| Tribe | Tribal |
Findings
This section provides a detailed discussion of the goals, objectives, and performance indicators employed by transit agencies throughout the U.S. (and one example in Canada) including, as available, information about the tools and data necessary to successfully measure progress towards equity goals.
During the literature search the research team found limited information about transit agency goals and non-traditional metrics focused on equity in industry publications (e.g., journal articles, guidance documents) and similarly limited information provided via public-facing agency documentation (e.g., websites about equity programs or consultant reports). The information that was discovered is summarized in the following sections organized by transit agency. Transit agencies in areas with supportive local or regional examples of equity goals or performance measures (e.g., from an MPO) include subsections for such information.
Following the transit-specific information is a section that documents similar findings (e.g., equity goals and/or performance metrics) from Transit Stakeholders, such as cities, Metropolitan Planning Organizations (MPOs), or community organizations.
Transit Agencies
Cecil Transit
Cecil Transit, a department of Cecil County, MD, provides four fixed routes, demand response, a volunteer driver program, and travel training. In 2013 Cecil County was designated as a High-Intensity Drug Tracking Area by the United States Drug Enforcement Administration. Drug overdose rates in the county have often surpassed the entire overdose rate for Maryland since 2007. These statistics highlighted the urgency and significance of addressing the transportation needs of individuals recovering from addiction in the region and inspired the grant application, and the Federal Transit Administration awarded an Integrated Mobility Innovation grant to implement a mobility on-demand (MOD) service called Cecil On-Demand Mobility Platform and Service Solution (COMPASS). The main goal of this grant is to pilot a transportation solution that provides service specific to the needs of individuals recovering from drug addiction in rural Maryland.
Cecil Transit partnered with a recovery house initially and gradually expanded the service over time. The goals of the program include enabling residents to travel to and from designated locations for work, job interviews, errands, and medical and legal appointments using the COMPASS platform. The data collected from the pilot program will be used to evaluate its success and impact.
The agency hopes to extend the COMPASS service to other populations, such as seniors and people with disabilities, as part of its long-term sustainability plan aligning with the transit agency’s broader goal of exploring and implementing mobility solutions for different target groups.
Compass uses trip purpose to understand customer needs—51 percent of trips are for retail establishments and errands, 28 percent are for potential and existing employment, and 21 percent are for medical providers. To complement this service data, Cecil Transit also surveys COMPASS users, which has revealed several positive outcomes and helped the transit agency understand COMPASS customers better:
- 75 percent of the users reported using COMPASS for their trips, indicating a high level of adoption.
- 19 percent of individuals missed medical appointments in the previous 60 days compared to 75 percent before COMPASS was available.
- The availability of COMPASS significantly reduced the time required for COMPASS customers to find employment, with an average of nine days compared to 31 days before its implementation.
- 79 percent of customers expressed satisfaction with their transportation choices, a significant increase from 21% before COMPASS was introduced.
Further exploring qualitative information to gauge performance, Cecil Transit also conducted a survey of staff at participating recovery houses. The results showed that:
- 78 percent of residents were using COMPASS independently (e.g., without trip planning assistance).
- The usage of COMPASS contributed to increased rates of successful recovery from addiction, lower unemployment rates, and greater independence.
- All recovery houses expressed satisfaction with the booking technology, service zone, service hours, drivers, vehicles, and wait times provided by COMPASS. The service effectively addressed the transportation needs that were previously challenging for Cecil Transit to manage.
Source: (Shared-Use Mobility Center, 2022)
Denver Regional Transportation District (RTD)
Denver RTD’s 2027 System Optimization Plan (SOP) presents a network redesign for all of RTD’s transit services that is intended to provide “high frequency service to those areas where the highest concentrations of equity community members [people with low incomes, people of color, and people in zero-car households] live or work and balancing the need to restore service to corridors that exhibit high ridership with the need to connect less densely populated areas so that riders can travel throughout the District.” In a complementary whitepaper, RTD staff outline the process followed by RTD to ensure compliance with Title VI of the Civil Rights Act of 1964 as well as the transit agency’s additional analyses conducted to evaluate the impacts of SOP changes on equity communities.
To understand the needs of people with low incomes, people of color, and zero car households, RTD collected travel data anonymously from regional cell phones and linked it to census block data in an effort to show travel patterns and allow the transit agency to surmise travel needs of equity communities across its service area. However, because personal information is not linked to the data used, demographic information is assigned based on characteristics of the census block group data using a technique developed in consultation with relevant stakeholders that identified thresholds to define equity zones. These zones were determined based on census block groups with shares of low-income, zero-car households, or people of color that were 10 percent higher than the regional average (see the thresholds in Figure 18).
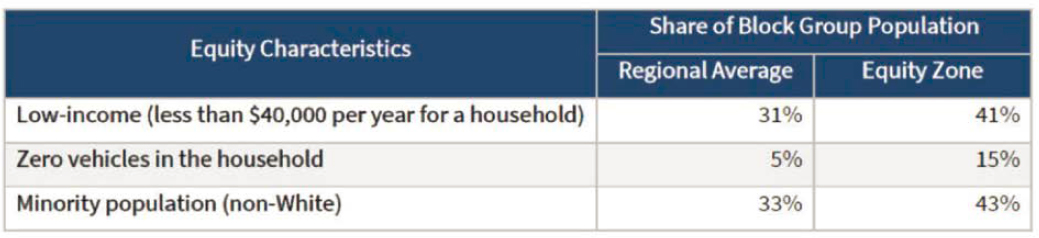
Devices identified as having a home located in equity zones (shown in the map in Figure 19) were considered equity devices, and trips made by these devices were considered trips made by equity populations. The data analysis revealed that equity zones captured a significant portion (61 to 74 percent) of all persons belonging to equity populations in the region. This implies that by considering the travel by residents of these zones, RTD effectively addresses the
transportation needs of the majority of low-income individuals, households without vehicles, and people of color in the region.

The SOP focuses on enhancing access to 15-minute-or-better service for areas with high concentrations of equity community members. It also aims to balance services between densely populated equity community areas and the suburbs by providing connecting services whenever possible. Figure 20 shows a performance analysis of the SOP network documenting population by service area region as a whole and within equity zones and a comparison of bus service hours per capita and population access to stops for the general service area and for the equity zones.

Source: (Denver Regional Transit District, 2022)
Durham Region Transit (DRT)
DRT provides transit service in the Durham Region of Canada’s Ontario Provence, serving eight cities and connects to the Greater Toronto Hamilton area. DRT operates fixed routes, demand response, and paratransit service. The transit agency’s service guidelines describe goals, objectives, performance measures, strategies/techniques to achieve service standards, and data used to track performance, as follows:
Goals:
- Ensure efficient and equitable transit service for customers in urban and rural areas.
- Minimize wait times for pick up and improve overall trip experiences.
- Provide accessible and inclusive transportation options for customers with disabilities.
- Increase service proximity by ensuring convenient access to bus stops.
Objectives:
- Maintain scheduled routes with headways no longer than 30 minutes and a minimum operating period of three hours.
- Offer 24-hour transit service in urban areas and specific operating hours in rural areas.
- Reduce customer wait times for Demand Response trips in urban and rural areas.
- Achieve similar average trip wait times for all Demand Response customers by 2025.
- Exceed a 99.6% accommodation rate for trip requests by eligible persons with disabilities.
- Ensure a high percentage of dwellings within walking distance of bus stops in urban areas.
- Provide curb-to-curb Demand Response service for all dwellings in rural areas.
- Offer accessible door-to-door trips for customers eligible for Specialized Services.
Performance Measures:
- Maximum wait time for pick up: 30 minutes in urban areas and 60 minutes in rural areas.
- Average overall wait time: Less than 15 minutes in urban areas and less than 45 minutes in rural areas.
- Accommodated rate for trip requests by eligible persons with disabilities: Exceeding 99.6%.
- Service proximity: 80% of dwellings within a 500-meter walk of a bus stop in urban areas, 95% within an 800-meter walk.
- Full coverage: 100% of dwellings served by Demand Response at the curb in rural areas.
Strategies or Techniques to Achieve Goals:
- Strategic deployment of vehicles to ensure timely pick up for Demand Response trips.
- Real-time scheduling for trips.
- Specialized Services for customers with disabilities.
- Combination of Demand Response and scheduled service for customers with conditional eligibility.
Data:
- Trip requests and pick-up times for Demand Response trips.
- Wait times for customers in urban and rural areas.
- Accommodation rates for eligible persons with disabilities.
- Proximity data measuring walking distances between dwellings and bus stops.
- Customer eligibility information for Specialized Services.
According to DRT’s Social Equity Guidelines, the transit agency aims to address existing inequities and provide reliable and accessible transit options for all community members, particularly those who rely on transit the most. To measure performance and progress towards achieving this goal, DRT utilizes various tools and data sources (alluded to above). The transit agency’s onboard technology and software for planning and reporting helps track ridership, assess crowding levels, and capture data within the Priority Neighborhoods identified by the
Durham Region Health Department. According to the Health Department, these areas require special attention to enhance health and well-being (and transportation can contribute to positive outcomes). The Priority Neighborhoods were chosen primarily based on income measures, as higher incomes generally correlate with better physical and mental health, while individuals growing up in families with low incomes are more likely to face various health issues throughout their lives. The seven identified Priority Neighborhoods are Downtown Ajax, Downtown Whitby, Lakeview, Gibb West, Downtown Oshawa, Central Park, and Beatrice North. These neighborhoods were selected in 2015 due to low median household income, high rate of child poverty, overall low-income rate, low education levels, and high unemployment compared to other neighborhoods in the region. The identified Priority Neighborhoods include approximately 15% of the population in the Durham Region.
Within and beyond the Priority Neighborhoods, DRT also identified specific challenges for their various user groups, as follows:
- Navigating the transit system can be challenging for newcomers with language barriers or settlement difficulties.
- Older adults may struggle with using transit after losing their ability to drive.
- Residents experiencing poverty heavily rely on transit for access to employment, education, healthcare, and recreational activities.
- Discrimination and lack of inclusivity in transit facilities affect individuals who identify as 2SLGBTQ+.
- Sole parent families with low incomes rely on transit for linked trips to various destinations.
- Persons with disabilities face challenges related to accessibility, especially during inclement weather.
- Underserved or rural communities face unique challenges due to overlapping disadvantages based on their identities and locations.
To address these challenges and prioritize equity, DRT has established social equity initiatives. These include service design guidelines, ridership minimums in priority neighborhoods, and supportive infrastructure improvements. DRT aims to install transit shelters near key locations and ensure equitable amenities and design at terminals, including gender-neutral facilities. DRT also focuses on improving service proximity by reducing distances to bus stops and hubs, identifying gaps in sidewalk networks, and creating protected road crossings.
DRT leverages GIS data and tools to analyze land use, transit routes, and demographics, to determine travel times and walking distances to boarding points. In addition, DRT uses Statistics Canada census data to gain insights into the region’s population, including income levels, education, age, and employment status. They also gather feedback through their customer service call center, which assists in identifying areas for improvement.
DRT’s approach to achieving equity involves actively listening to and learning from equity priority groups. The transit agency engages with relevant committees to understand the needs and experiences of these groups. Additionally, DRT invests in training opportunities on social equity and inclusion for staff, aiming to integrate equity planning into their daily operations.
DRT has established measurable equity-specific goals to ensure they deliver on their commitment to social equity, as follows:
- Listen and learn:
- DRT will continue to engage and listen to identified equity priority groups to further understand needs and experiences to support an inclusive and equitable transit system. DRT currently engages with a variety of committees that represent the groups identified, such as the Age Friendly and local accessible committees. To further advance engagement, DRT staff will strive to engage, listen, and learn from relevant groups and organizations.
- Train and grow:
- DRT will continue to seek training opportunities on social equity and inclusion to provide staff with the knowledge and tools to ensure equity planning is a standard practice within our daily operations.
For staff (and community oversight) DRT provides an Equity Checklist that includes the following categories and questions.
- People and participation
- When identifying the community groups that will benefit from or be impacted by a proposed initiative, have you asked, “who’s not here?”
- Have you collaborated with community members and learned their needs?
- Have you identified relevant performance metrics/indicators that address equity and the social wellbeing of the community?
- Destinations, routes, vehicles, and stations
- Does the proposed project increase access to essential goods and services and/or employment for equity priority groups?
- Have you considered the social and political history of the area?
- Have you considered physical and social safety issues and safety for all genders and abilities?
Sources: (Durham Region Health Department, 2022; Durham Region Transit, 2022, 2023b, 2023c)
EMBARK Oklahoma City
EMBARK is the transit agency in Oklahoma City, OK. The transit agency operates fixed route, paratransit, a short ferry service, and the downtown parking system. The Climb Ride program developed by EMBARK aimed to expedite family reunification via a comprehensive transportation solution to families in the foster care system, with the objective of facilitating the completion of court-ordered services and reunification with their children. The Climb Ride Program is coordinated by EMBARK’s Mobility Management Division, specializing in transportation options for vulnerable populations. The program utilizes a customizable and scalable model that aligns public transit with social services. A Mobility Coordinator embedded within the DHS team maintains frequent contact with parents and assists with transportation
while identifying and addressing program attendance issues. The program aims to shorten the time to permanency, improve case outcomes, and support parental success. Additionally, Climb Ride offers responsible habit training, incentives, and comprehensive travel training to support participants.
The Climb Ride program tracks the number of participants served, trips provided, and successful reunifications. However, Climb Ride focuses its performance measurement on outcomes rather than counting trips or their cost. Participants’ feedback highlights the positive impact of the program on families and social service staff, providing qualitative measures of success. According to EMBARK, the program also demonstrates that strategic investment in mobility coordination and transportation services can lead to positive outcomes and cost savings for the Department of Human Services (DHS).
One example of using participant feedback to improve the program came from learning that challenges such as frequently changing phone numbers / residential locations and limited access to necessary cellular data led to the development of a custom trip scheduling platform that could automatically schedule trips based on the family’s specific court-ordered Individualized Service Plans. This system also provided data for reporting purposes and could host trip credits to be used under the Climb Ride Flex Trip program (transportation credits for trips other than foster care system appointments or hearings earned by having no history or late trip cancellations, no “no shows,” and no positive drug tests [if relevant]).
During the Climb Ride pilot phase, the program facilitated the reunion of 22 families, resulting in significant cost savings for the state. Each case saved up to $30,000 in foster care services and support. Additionally, the program led to quicker reunifications, benefiting both the families involved and the community as a whole. The Climb Ride program provided safe and reliable transportation, ensuring that families in Oklahoma County had access to necessary services.
The Climb Ride team identified opportunities for improvement including enhanced service provider coordination, scheduling, and communication through a working group, as well as establishing a centralized information sharing portal to streamline case-related information access for the Climb Ride Mobility Coordinator. Additionally, staff emphasized the need for clear expectations, consistent application of program rules, and efficient communication with agency staff. Lessons learned include the need for efficient case information exchange and setting boundaries for participant accountability.
Sources: (Dillon et al., 2022; EMBARK, 2022)
King County Metro
King County Metro (KCM) provides transit service in and around the Seattle, WA, area as a department of King County. The transit agency incorporates equity considerations in its transit service performance measures and utilizes King County’s equity tools (developed for all county functions) including the Equity Impact Review Process, Equity Impact Awareness Tool, and Equity and Social Justice Strategic Plan. This section first outlines KCM’s equity considerations before describing each of the King County equity initiatives/tools.
King County Metro - Equity in Transit
As shown in Figure 21, equity is built into the transit agency’s performance measures for planning service and assessing existing routes. KCM’s equity performance measures are
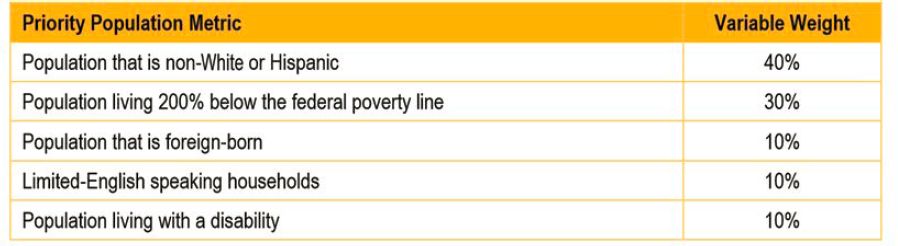
designed to show how well specific routes serve people in equity priority areas (areas with a high proportion of priority populations, such as communities of color, low-income populations, disabled populations, foreign-born populations, and populations with limited English proficiency) which are identified using demographic information for each bus stop’s census block group. Priority areas are identified using demographic analysis and variable weighting consistent with King County’s equity strategy, giving higher weight to race and income (see weights shown in Figure 22). KCM’s focus on these areas to ensure that equity is considered in transit service growth. Each bus route receives two equity scores: the equity prioritization score (EPS), calculated as the average of the route’s equity prioritization area scores, and the opportunity index score (OIS), based on the percentage of stops with the highest equity priority area score. These route-level equity scores help prioritize service investments and reductions and are included in KCM’s annual System Evaluation report.

KCM’s process of setting target service levels involves land use, equity, and geographic value considerations, as described in the transit agency’s service growth methodology (summarized in Figure 23). The equity prioritization score, representing the average equity priority area score for all stops along a route, is used to assign points for 25 percent of the total score in setting target service levels. Routes with higher equity prioritization scores receive more points.

Opportunity Index Scores, which are quintile rankings based on the percentage of stops serving block groups with an equity priority area score of five, are considered in setting priorities for potential service reduction. Routes with a higher percentage of stops within the highest priority areas receive a score of five, while routes with a lower percentage receive a score of one. Additionally, information about physical community assets is used to ensure that important places throughout the county are served by Metro.
To center equity in planning and engagement and collect qualitative information about the transit agency’s performance, the King County Equity and Social Justice Strategic Plan and Metro’s Mobility Framework guide the transit agency in engaging communities and shaping decisions about service. This involves focusing on priority populations by using demographic data and past engagement experiences to design engagement strategies. Mobility boards, consisting of community members living, working, or traveling in specific areas, are formed to co-create and share in decision-making processes. Metro also values the expertise and time of community members by engaging them early in the process, working collaboratively, and meeting them in the community—the aim of these efforts is to build long-term relationships and continuously improve service based on feedback. Metro collaborates with jurisdictions, community-based organizations, and other partners to promote and market new services, ensure accessibility, and gather feedback for service improvement.
According to the King County Metro 2014 Sustainability Plan Update, KCM also tracks performance in the following equity related areas (a more recent version of this plan update is not available on KCM’s website):
- Number/percentage of employees receiving customer service or engagement training by type of training
- Number/percentage of interviewers who received anti-bias training
- Number of new recruitment strategies used to diversify the applicant pool
- Number of human resource practitioners who received cultural competency training
- Number of applications received from minority/women applicants
- Number of participants in a low-income fare program as a percentage of low-income riders
- Percentage of bus stops that are wheelchair accessible
King County Equity and Social Justice Strategic Plan 2016-2022
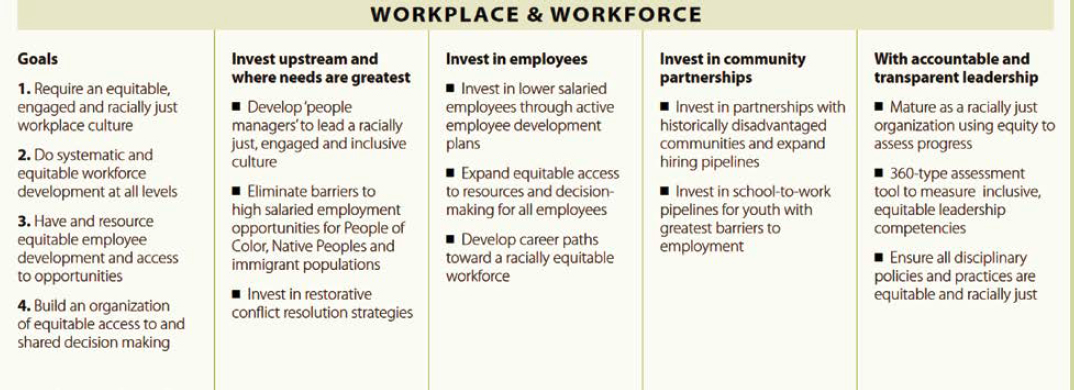
The Equity and Social Justice (ESJ) initiative was launched by King County Executive Ron Sims in 2008 and subsequently formalized through an ordinance in 2010 by Executive Dow Constantine and the Metropolitan King County Council. As part of this initiative, The Equity and Social Justice Strategic Plan was collaboratively developed by King County employees and community partners. The planning process prioritized gathering insights and expertise from individuals across various sectors, geographies, and populations. More than 600 county employees and 100 local organizations, including community organizations, education, philanthropy, labor, business, and local governments, contributed to the plan, sharing progress made, persistent challenges, and potential solutions towards achieving equity.
The Plan includes a Pro-equity Policy Agenda, aiming to expand access to various determinants of equity within the county, such as child and youth development, economic development and jobs, environment and climate, health and human services, housing, information and technology, the justice system, and transportation and mobility. Additionally, ESJ goals and measures are incorporated into department director contracts/agreements, ensuring a commitment to equity and social justice at the leadership level. Budget decisions, resource allocation, and service fees are tied to ESJ outcome measures and actively tracked.
While there is a broad range of equity-focused activities in the region, there is a recognized need for increased coordination and cross-sector solutions that match the scale of the inequities faced—in response to this, the County’s Plan is intended to integrate pro-equity practices into its major functions of government, including leadership, operations, services, plans, policies, budgets, workplace, workforce, community partnerships, communication, education, and facility and system improvements.
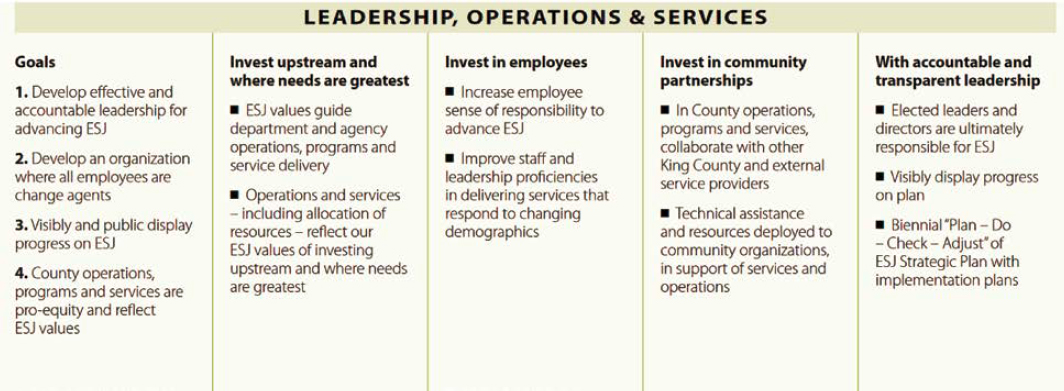
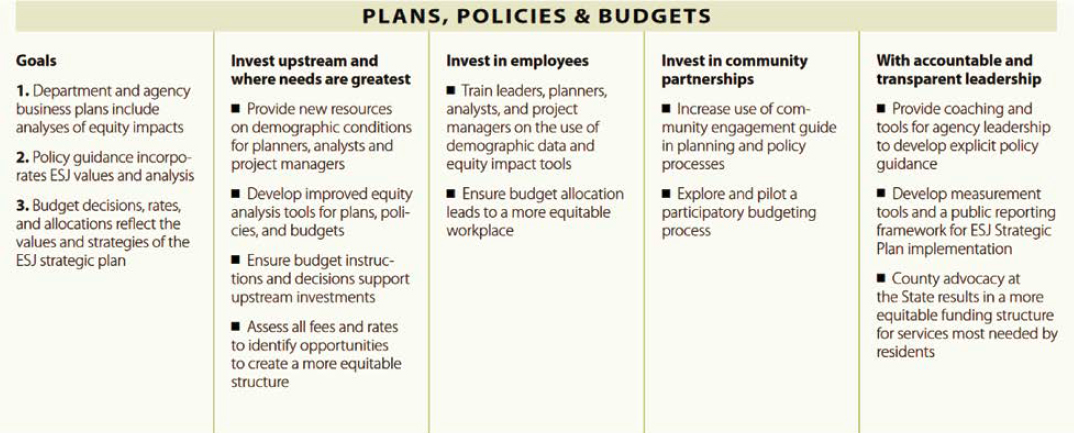
Figure 24 through Figure 29 present the Plan’s various goals by category including descriptions of how each goal relates to the Plan’s four investment areas/strategies (simplified versions of objectives). Each goal is also supported by specific measurable objectives—for example, the Leadership, Operations, and Services Goal #1 (Develop effective and accountable leadership for advancing ESJ) includes the following three objectives:
- By 2018, all supervisors, managers and directors will have ESJ measures in their performance appraisals and/or professional development plans.
- Each year through 2022, there will be a three percent increase in employees answering positively (strongly agree or agree) to the employee Survey question, “Department leadership does what it says it’s going to do.”
- Each year through 2022, there will be a 3 percent increase in employees answering positively (strongly agree or agree) to the employee Survey question, “I have the support to apply equity and social justice to my work.”


King County Equity Impact Review Process and Equity Impact Review Tool
One of the objectives associated with the Plans, Policies, and Budgets goal area of the Equity and Social Justice Strategic Plan (described in the previous section) was to “develop an improved, streamlined equity impact Review Tool that incorporates ESJ Strategic Plan guidance and enables improved planning and budgeting to improve equity analysis and outcomes.” The result of this objective is King County’s Equity Impact Review Process and Tool.
The King County Equity Impact Review (EIR) is designed help staff develop equity considerations that are thorough and comprehensively considered during the County’s planning, decision-making, and implementation processes. This process combines quantitative empirical data with qualitative findings from community engagement to inform these processes.
Performance measures are employed to assess the effectiveness of the EIR process, with the purpose of rigorously and holistically examining equity impacts and advancing them in the design and implementation of proposed actions such as plan development, policy creation, program development, operational modifications, and capital programs/projects.
The County expects all departments to incorporate the EIR process in the development and implementation stages of the proposed action, ensuring that equity considerations are an integral part of the overall process.
To facilitate the completion of the EIR worksheets and understand the extent to which a proposal impacts equity, the EIR process utilizes various tools, including the Equity Impact Review process itself, Community Engagement and Language Access guides, and available data resources (e.g., U.S. Census or on-board survey data). The EIR process consists of five phases (depicted in Figure 30):
- Scope: Identify the individuals or groups who will be affected by the proposed action.
- Assess equity and community context.
- Analysis and decision process.
- Implement: Maintain connections with communities and employees during the implementation stage.
- Ongoing Learning: Continuously listen, adjust, and co-learn with communities and employees.
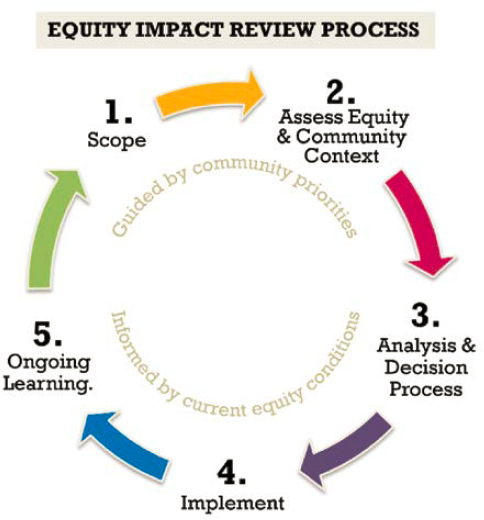
Each phase of the review process includes specific actions, as described in the following list—elements that include performance measures are emphasized in bold text.
Phase 1: Scope. Identify who will be affected.
- Identify how your action will affect/serve people and places using demographic information. Consider in particular low-income populations, communities of color, and limited-English speaking residents.
- Reach: which people and places will be affected by your action?
- Intensity: what effects, impacts and/or outcomes will your action have on people and places?
- Duration: how long will the action have an effect–short-, medium-, and/or long-term?
- Identify the group of stakeholders and affected parties – including those who have historically not been/felt included or engaged – and their roles in decision-making.
Phase 2: Assess equity and community context.
- Learn about affected communities’, employees’, and/or stakeholders’ priorities and concerns.
- Know which determinants of equity will be affected by your intended outcomes – both directly and indirectly.
- Know how your proposed course of action will affect known disparities within relevant determinants.
- Identify potential unintended equity-related outcomes of this action.
Phase 3: Analysis and decision process.
- Project or map out how key alternatives will affect community and employee priorities and concerns.
- Evaluate each alternative for who will be disproportionately burdened or benefit - now and in the future. How will alternative actions differ in improving or worsening current equity conditions?
- Include upstream alternatives (and related costs) that target root causes to eliminate disproportionate impact.
- Prioritize alternatives by equitable outcomes and reconcile with functional and fiscal policy drivers.
Phase 4: Implement. Are you staying connected with communities and employees?
- Based on earlier use of Community Engagement Guide, communicate with communities, stakeholders and employees about how you will implement your action.
- Engage with affected communities and employees to guide successful implementation.
- Advance “pro-equity” opportunities, when possible, i.e., contracting, hiring and promotion, materials sourcing, etc.
- Measure and evaluate your intended outcomes in collaboration with affected communities. Are there sufficient monitoring and accountability systems to identify unintended consequences? How will course corrections be handled if unintended consequences are identified?
Phase 5: Ongoing Learning. Listen, adjust, and co-learn with communities and employees.
- Evaluate whether your action appropriately responds to community priorities and concerns.
- Learn with the community to adjust your action as their priorities and concerns shift.
- Communicate progress to all stakeholders. Plan to include community feedback into future planning.
Sources: (Office of Equity and Social Justice, 2016a, 2016b)
Los Angeles County Metropolitan Transportation Authority
The Los Angeles County Metropolitan Transportation Authority (Metro) adopted Metro’s Equity Platform in 2018 as a guiding framework for addressing inequalities and promoting access to opportunities in four key areas of action (“pillars”): Define and Measure, Listen and Learn, Focus and Deliver, and Train and Grow. The purpose of the platform is to influence and direct all aspects of the agency’s operations, including projects, investments, and new initiatives, with the goal of creating more equitable results. Three of the four pillars allude to performance measurement including both quantitative and qualitative analyses; however, the current documentation on Metro’s Equity Platform does not include specific measures:
- Pillar 1 – Define and Measure: “Metro created a community designation called Equity Focus Communities (EFCs) to help us identify where transportation needs are greatest.
- Pillar 2 – Listen and Learn: “Metro is working to improve its efforts to listen and learn from the communities that we serve. We recognize that to increase access to opportunities for all, we must understand how to increase access for those who face barriers. No matter our intent, we will not be successful unless we work to address their needs first. Metro can only serve those with the greatest needs by understanding their needs through intentional listening.”
- Pillar 4 – Train and Grow: “We recognize our work must be iterative, and continued learning, consistent analysis, and adaptive approaches are key to facilitating more equitable processes and delivering and supporting more equitable outcomes.”
EFCs consider where there are higher concentrations of resident and household demographics associated with mobility barriers (low-income households earning less than $60,000 per year; Black, Indigenous, or People of Color (BIPOC) populations; and households that do not have a car). While the EFC category designation identifies the highest equity need communities at a macro level, Metro will work to measure and understand community conditions and priorities at the service, program and project level throughout our work.”
According to Metro’s Equity Information Hub, Metro assesses its performance related to service equity via multiple tools: a Rapid Equity Assessment, a Budget Equity Assessment, and an Equity Planning and Evaluation Tool. The Rapid Assessment Tool is designed to assess decisions and serves as a snapshot of how a possible project might impact users, without tracking progress or impacts over time. The Budget Equity Assessment tool is intended to support Metro staff when developing their annual budgets and includes a prompt to describe how the user will monitor the impacts of the budget change they are working on over time, however it does not prescribe measures or guide the development of such measures beyond suggesting some ways in which the data could be disaggregated. Lastly, Metro’s Equity and Evaluation Tool guides equity focused assessments of proposed services/projects and includes multiple prompts to assess conditions as they are and as they could be with the proposed service or project including a request for a description of the results of an analysis to assess impacts on the community disaggregated by various demographics. However, the tool does not require ongoing performance measurement to check whether initial expectations are met or adjustments need to be made.
During a recent bus network redesign, known as NextGen, started in 2018 and implemented between 2020 and 2021, Metro focused on creating a grid-like system of frequent bus routes with the goal of improving access to transit for bus riders with low incomes. To inform the redesign, the transit agency used data from cell-phone location-based services and fare cards to understand where and why people used or avoided public transportation. The agency also conducted an online survey and engaged with various organizations and the public through workshops and events—learning the importance of service frequency for shorter trips and gaining valuable insights into travel patterns—but the agency did not publish any documentation about ongoing performance measures related to these findings.
Sources: (Buchanan et al., 2021b; Metro, 2022, 2023)
Massachusetts Bay Transportation Authority (MBTA)
MBTA provides transit service in Boston and throughout the Massachusetts Bay area. MBTA’s ongoing Better Bus Project seeks to redesign the bus network according to regional requirements. To support data analysis and understand local needs and conditions, MBTA worked with the Massachusetts Department of Transportation (MassDOT) to collected and assess location information derived from cell phones, which encompasses various modes of travel, to identify potential unmet transit demand, popular destinations, competitive transit routes. The analysis revealed that respondents generally displayed a higher or lower willingness to use transit, rather than having strong preferences regarding trade-offs between different aspects of transit quality. To validate these findings, the transit agency conducted surveys and open house meetings, including virtual sessions during the COVID-19 pandemic. The transit agency also established an external working group consisting of representatives from municipalities within the MBTA service area, transportation advocates, business organizations, environmental justice and community-based organizations, and elected officials. This collaborative approach allowed the agency to accommodate “edge cases,” including individuals with nonstandard commutes or transit preferences, who would be excluded from policies designed solely for standard riders.
Qualitative data played a significant role in shaping decisions. For example, the MBTA organized focus groups with older adults to gather insights on fare vending. The participants expressed a preference for retail locations over vending machines, citing a greater sense of safety. MBTA also conducts demographic surveys, voluntary rider surveys, panel surveys, and transit etiquette surveys to gain insights into travel patterns and identify areas that require improvement. These surveys serve different purposes, ranging from assessing customer service to gathering origin-destination information. The MBTA also collects origin-destination trip data from users’ smart transit cards, known as Charlie Cards, to understand how people are using transit services and determine focus areas for planners.
In partnership with the Office of Diversity and Civil Rights at MassDOT, MBTA developed an online public engagement tool called Engage. This tool provides planners with on-demand access to demographic and transit data within the service area including information on languages spoken, local community groups, accessible meeting locations, and ongoing transit projects. Engage is used to support planning decisions by providing evidence and assistance to staff members as needed.
To enhance the accuracy of their projections and forecasting, the MBTA collaborates with relevant MPOs and utilizes their land use and demographic data for transit analyses and modeling. Instead of conducting original data collection, the transit agency relies on comprehensive data available from the MPOs. The MBTA also works with MPOs to assess the large-scale and granular impacts of transit investments. However, one challenge they face is identifying the distribution of benefits and burdens associated with these investments. They conducted a study on the environmental effects of transit vehicle fuel type on local communities living near transit routes, which revealed hidden burdens that can affect communities when new routes or stops are introduced.
In conducting their capital improvement program, the MBTA performed a multimodal equity analysis to better understand the effects of data, decisions, and analytical choices on equity
outcomes. This process highlighted the need for flexibility in equity analysis, particularly concerning funding and scope.
In 2017, the MBTA implemented the Bus Cost-Efficiency tool to measure system costs and benefits. This tool provides a comprehensive understanding of bus routes, including ridership characteristics, transit reliant ridership, and the route’s value to the network. It helps identify strengths and weaknesses among routes, both in comparison to each other and within a single route. Analyzing route performance aids in achieving transportation equity by improving underperforming routes and understanding the factors contributing to the success of high-performing routes.
Boston Region MPO
Complementing and supporting MBTA’s equity efforts, the Boston Region MPO’s Destination 2040: Long-Range Transportation Plan identifies geographic areas with significant populations of people of color or people with low incomes. Equity is assessed based on factors such as disparate impact, disproportionate burden, and accessibility to jobs, healthcare, and higher education facilities from these locations. The MPO also established additional performance measures, including travel speed for bus routes; volume-to-capacity ratios for bus and rapid transit lines; affordability of monthly transit passes relative to income; availability of employment, education, and healthcare within specific travel time frames; rates of participation in MPO-hosted transportation equity forums; responses to the MPO’s transportation equity surveys; and the engagement with environmental justice communities. Additionally, the Boston Region MPO Triennial Title VI Report provides guidance for evaluating transportation improvement programs based on equity criteria, considering factors such as service to low-income households, minority populations, limited-English-speaking populations, elderly populations, people with disabilities, zero-vehicle households, and the impact on Title VI/nondiscrimination populations.
The Boston Region MPO aims to achieve an equitable transportation system by prioritizing the needs of marginalized communities and addressing the barriers they face. The MPO’s goal is to eliminate transportation impacts that negatively affect these communities and ensure fair benefits for all individuals, regardless of race, color, national origin, age, income, ability, or sex. To achieve this, the MPO follows an “equity in all policies” (EiAP) approach, integrating equity into every policy, process, and decision. They actively involve vulnerable populations throughout the decision-making process to develop and implement strategies for advancing equity.
The MPO employs baseline equity indicator metrics to measure transportation inequities in the Boston Region, building upon the findings of the 2022 Identifying Transportation Inequities study. This data informs the Transportation Equity Program and guides its expansion.
The MPO has implemented a Disparate Impact/Disproportionate Burden (DI/DB) Policy to prevent unintentional discrimination when making funding decisions for projects in the Long-Range Transportation Plan (LRTP). The DI/DB Policy as it currently stands is the result of a multi-phase development process that included multiple studies and at least three formal publicly accessible drafts.
Furthermore, the MPO conducts health impacts analyses to evaluate the effects of their investments on public health and are actively working on developing health-related metrics for
use in their ongoing work, including the LRTP Needs Assessment and the Baseline Equity Indicator Metrics project.
Sources: (Boston Region Metropolitan Planning Organization, n.d., 2023; Buchanan et al., 2021b; Karner & Levine, 2019)
Metro Transit and the Metropolitan Council
Metro Transit in Minneapolis, MN, is the largest department of the Metropolitan Council (MetCouncil), the MPO for the Twin Cities region. Both the transit agency and the MetCouncil have developed equity initiatives, as described in this section. In December 2021, Metro Transit conducted a review of bus and rail service in to assess changes in service availability and access to transit. The goal was to understand the impact of service changes on different population groups, particularly Black, Native American, and people of color (BIPOC) compared to White non-Hispanic residents. They also examined the differences in service availability between low-income and non-low-income residents.
To measure the impact of service changes, Metro Transit measures the percent change in access to transit service for the average resident. This measurement involved quantifying the proximity of bus or rail service to one’s home and tracking how that proximity has changed over time as well as a calculation to show the average percent change in service for various population groups by weighting the percent change in scheduled trips based on the population residing in each area.
Metro Transit defines their disparate impact and disproportionate burden thresholds using the “80 percent rule.” This rule means that if people of color or lower-income groups do not receive at least 80 percent of the benefits that White or more affluent populations receive, there may be potential for discrimination. Similarly, if White or higher-income groups are found to bear less than 80 percent of the adverse effects that BIPOC or low-income communities experience, the transit agency identifies this as a concern.
Metro Transit has a stated commitment to transparency which includes reporting general transit performance, disaggregated by race. This allows the transit agency to identify areas where residents from different racial backgrounds may experience disparities in service quality with the aim to measure who can benefit from their service and the potential connections to opportunities.
To assess their performance, Metro Transit uses various metrics, including job accessibility, count of scheduled trips, access to frequent service, and service reliability. These metrics are measured annually using consistent data sources and methodologies. The analyses provide insights into the amount of service offered and its potential utility. Additionally, Metro Transit anticipates the need for additional metrics to provide a more complete understanding in unique circumstances. For example, in response to the COVID-19 pandemic, the transit agency introduced a passenger crowding metric in 2020, but it was not repeated in 2021 due to the availability of vaccines and masks.
The equity-focused practices at Metro Transit extend to all aspects of transit service planning, including individual route-level changes and corridor-level projects. The transit agency conducts service monitoring studies and reviews the methodology for service equity analysis as part of their Title VI anti-discrimination work required by the Federal Transit Administration (FTA).
Beyond assessing performance, equity considerations are incorporated into day-to-day decisions and processes at Metro Transit—the transit agency has revised their internal service change
process to explicitly document equity considerations for planned changes. Staff review race and income demographics, as well as data on low-wage jobs and vehicle availability, to understand how vulnerable populations are affected by these changes.
According to the transit agency, feedback from the public is essential, and Metro Transit ensures that feedback is collected from a representative cross-section of the population. Staff analyzes survey responses to ensure fair representation of demographic groups likely to use transit. Efforts are made to reach traditionally under-represented populations, such as communities of color and people with lower incomes, to gather their opinions and consider their needs in decision-making.
Metro Transit’s Speed and Reliability projects prioritize improvements on routes serving areas with high percentages of BIPOC residents, people with low incomes, and renters, as well as those areas with a higher number of low-wage jobs.
In 2010, the Metropolitan Council received a $5 million grant from the U.S. Department of Housing and Urban Development (HUD) to assess residential segregation by race and income, focusing on concentrated poverty and regional opportunity. The resulting report, “Choice, Place, and Opportunity: An Equity Assessment of the Twin Cities Region,” highlighted racial inequities, patterns of segregation, and barriers to housing choice for people of color. The report influenced regional policies, including the Thrive MSP 2040 development guide and the 2040 Housing Policy Plan.
However, concerns were raised about the effectiveness of the prevailing narratives and research tools that focused on concentrated poverty. Local organizers and advocates argued that these discussions often overlooked the root causes of poverty, such as structural racism. In 2019, the Council held listening sessions and engaged with stakeholders to understand the usefulness and limitations of Areas of Concentrated Poverty (ACPs) in considering place and equity.
The Council proposed recommendations based on their findings, aiming to expand their dataset to include indicators of concentrated affluence and historical data on the root causes of poverty. They also suggested sharing census tract information based on Home Owners Loan Corporation (HOLC) “grades” (used in redlining) and providing disaggregated data by race and ethnicity.
As part of their efforts to provide a more comprehensive understanding of community needs, the Council started incorporating housing and transportation indicators in their data, emphasizing that concentrated poverty should not be used as a proxy for understanding community needs and advocating for developing additional fields in their dataset to support place-based considerations beyond race and poverty.
Sources: (Metro Transit, 2022, 2023; Metropolitan Council, 2014)
City of Minneapolis
The City of Minneapolis has established a framework to promote equity and racial equity in transportation. The framework aims to achieve fair and just opportunities and outcomes for all individuals, and specifically focuses on reversing racial disparities, eliminating institutional racism, and ensuring that race no longer predicts outcomes and opportunities. The goals of the framework are as follows:
- Build organizational empathy: This goal involves fostering a shared understanding among staff about the significance of racial equity, developing a common language to discuss race and equity issues, and comprehending the needs of the community.
- Lead with a racial equity approach: This goal emphasizes collaborating with the community and other stakeholders to integrate a racial equity approach into plans, programs, and projects. It involves acknowledging past and current harms caused by governmental actions, addressing disparities, and ensuring racial equity considerations at every step of transportation initiatives.
- Build trust, cultivate partnerships, and share power with communities of color: This goal focuses on establishing trust, forming partnerships, and sharing decision-making power with communities of color. It aims to incorporate community members’ lived experiences and expertise into transportation decision-making processes, rebuild trust, and highlight the valuable contributions of diverse communities.
- Hold ourselves accountable to data-driven reporting and adjustments: This goal aims to create transparent and accountable measures to evaluate the progress of transportation plans, programs, and projects. It involves tracking key metrics that reflect progress towards achieving racial equity goals, sharing results with the public, and making adjustments as necessary.
To support the implementation of the framework, the City has developed 24 strategies supported by 64 actions. It has also introduced Transportation Equity Priority areas, which replace the previous use of Areas of Concentrated Poverty (as outlined above), to define geographic areas where equity efforts will be focused. Additionally, the City has established a publicly available Minneapolis Transportation Equity Dashboard that provides information on transportation policies, projects, and disaggregated data by race.
According to the City, the framework is a living tool that will be regularly updated based on feedback and lessons learned from its application. It builds upon existing equity work and integrates various policy guidance, including the Strategic and Racial Equity Action Plan, Minneapolis 2040, the Blueprint for Equitable Engagement, the 20 Year Street Funding Plan, and the Transportation Action Plan (TAP).
To measure progress, the framework incorporates a set of tracking indicators and key metrics. The tracking indicators assess trends in transportation and other demographic factors that influence how people travel based on location, time, safety, and income. The key metrics focus on specific areas, such as fatal injuries on Minneapolis streets, household income disparities, commute times, access to cars, and commute modes, comparing data between White and BIPOC (Black, Indigenous, and People of Color) residents.
The completion of actions outlined in the framework serves as a basic measure of progress. Other metrics include the number of community engagement contracts, diversity of Public Works staff by race and position grade, miles of street improvements in Transportation Equity Priority Areas, and progress on modal metrics defined in the Transportation Action Plan.
Overall, the framework aims to establish an inclusive transportation system that prioritizes equity, protects vulnerable street users, and monitors important transportation equity data trends. It strives to address historic harms, engage the community, and ensure accountability through data-driven reporting and adjustments.
Sources: (City of Minneapolis, 2023; Techagumthorn, 2021)
Port Authority of Allegheny County (PAAC)
In 2019 PAAC initiated an evaluation of significant service changes to advance its equity goals and go beyond federal requirements. The evaluation updated and expanded a similar effort from 2015 with a focus on five groups of individuals with potentially greater mobility needs—households with low incomes, people of color, households with older adults (over age 65), people with disabilities, and households without access to a personal vehicle.
In the updated PAAC Equity Index, the low-income category was broadened to encompass individuals experiencing poverty, considering both their residential and workplace locations. The factors now included in this category are households with low incomes (original index), cost-burdened renters (newly added), and low-wage jobs (newly added). Additionally, the category that tracks the experience of people with disabilities was expanded to include multiple data sets, encompassing households with people with disabilities (original index) and ACCESS paratransit trips (newly added). Other newly added factors include households with limited English proficiency, individuals under the age of 18, and single female families.
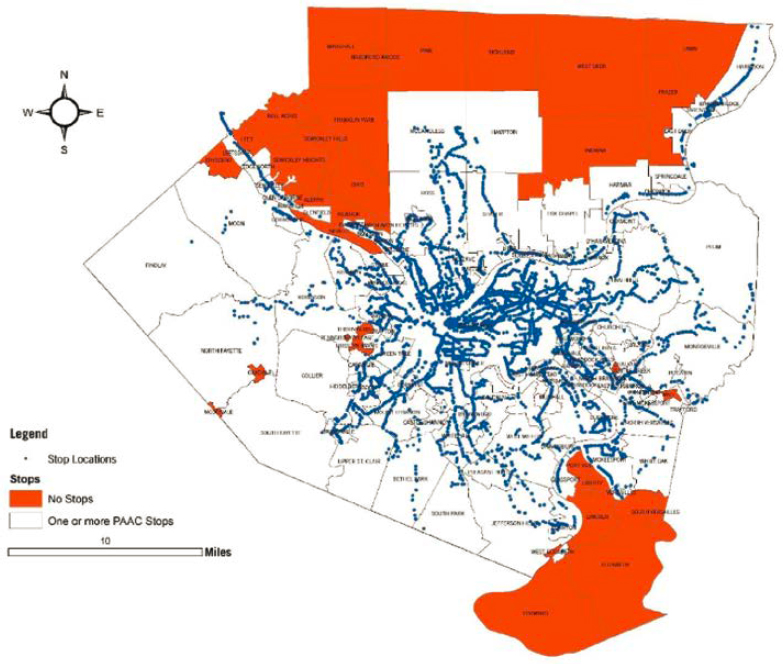
In updating the information used to understand the experiences of the target groups, PAAC reviewed similar efforts in other locations. Figure 31 summarizes the various metric factors PAAC used in 2015, those the agency reviewed from other entities, and the final 2019 metric factors.

According to PAAC, identification of areas with high mobility needs but no access to transit service is crucial for prioritizing future service provision. To accomplish this, the transit agency identified municipalities without transit stops in GIS by performing a spatial join between the municipality equity score layer and the PAAC transit stops layer. PAAC’s frequent transit service layer was overlaid on the municipal and neighborhood equity scores layers in ArcGIS. The overall equity of each transit route can be analyzed using block group data by conducting a “one to many” spatial join between the routes and intersecting block groups. The resulting joined information is then aggregated and averaged by route to obtain an equity score. A higher average equity score indicates that a route serves areas with relatively greater mobility needs compared to other routes. Figure 32 presents an example of the outputs this analysis creates.
In its 2021 Annual Service Report, PAAC outlined specific performance measures, tools, and data useful for assessing the needs of various demographic groups to address their mobility requirements. In this report the transit agency focused on people experiencing poverty, racial or ethnic minorities, people with disabilities, older adults, people under 18, households without vehicles, people with limited English proficiency, and households headed by females.
To identify the areas with higher mobility needs, PAAC analyzes three types of data related to people experiencing poverty: household income, cost burdened renters, and locations of low-income jobs. The household income category includes those earning less than $25,000 per year, while cost burdened renters captures households spending over 30% of their income on rent. Low-income jobs are identified as those paying less than $1,250 per month.
PAACs “racial or ethnic minority persons” category includes individuals who identify as Hispanic or do not identify as Caucasian. The transit agency acknowledges that people of color
face historical disadvantages, making them more reliant on transit, irrespective of their inclusion in other categories.
To learn about people with disabilities, two data sets are used: Census data for households with one or more person with a disability and trip origin/destination data from the ACCESS paratransit program, which primarily serves older adults and people with disabilities.
To evaluate equity, the Port Authority averages the percentages of the population falling into each focus area (e.g., households with low income) within census block groups. All eight indicators are given equal weight, resulting in a final equity value for each location. Areas with higher equity have a larger proportion of the population representing these demographic categories, making that area a higher priority for PAAC service.
Sources: (Port Authority of Allegheny County, 2019, 2021)
San Francisco Municipal Transportation Agency (SFMTA)
In 2014 SFMTA introduced a Muni Service Equity Policy. The policy mandates the development of a biannual Service Equity Strategy, aligned with the SFMTA budget process. This strategy aims to address transit service performance issues in low-income and minority neighborhoods, monitor improvements over time, and link improvement strategies to funding requests. The policy built upon existing initiatives such as the Transit Effectiveness Program (TEP) and the Title VI monitoring program and aligns with the transit agency’s core value of social equity with the intent to address SFMTA’s goals such as improving customer service, transit performance, the environment, and quality of life.
The strategies that result from the Muni Service Equity Policy prioritize enhancing Muni service in neighborhoods with high concentrations of households with low incomes, people of color, residents with disabilities, and households without personal automobiles. Performance measures include on-time performance, service gaps, crowding, capacity utilization, customer satisfaction, and travel times to key destinations. Additionally, the Policy calls for key issues to be identified and improvement strategies to be developed to enhance service quality.
The SFMTA Board reviews and approves the Service Equity Strategy every two years using the Strategy plans, concepts, and priorities to inform agency budget decisions. As part of the Service Equity Strategy, annual service evaluations track the progress of equity strategies and are presented to the SFMTA Board and the San Francisco Transportation Authority Board.
U.S. Census demographic information is used to identify neighborhoods where Muni access is crucial. The critical routes in each neighborhood are determined based on ridership, connections to key destinations, and community feedback. Data analysis covers various time periods and considers overall route performance, comparing baseline conditions and peer examples to identify service issues.
Strategies to address performance issues are developed in collaboration with the communities they serve and may vary across neighborhoods so that custom solutions can be developed to meet specific needs in each area. Solutions may involve increasing route frequency, improving service reliability, and implementing capital improvements. According to the policy, each strategy should include identification of any need for either reallocation of existing resources or additional investment, to be reviewed and approved by the SFMTA Board (though, in challenging financial situations, the policy calls for focus on utilizing available resources effectively).
The Service Equity Strategy is complemented by an annual service monitoring program conducted as part of the Title VI program. Public outreach plays a substantial role, involving neighborhood-based outreach efforts to identify service issues and refine proposed strategies and leveraging multiple styles of engagement including open houses; focus groups; and engagement with community-based organizations. Community based groups are included specifically to help the transit agency focus on engaging customers with limited English proficiency and disabilities. SFMTA also incorporates information collected from their transit operators.
The Service Equity Strategy tracks the following metrics (disaggregated to show total system and neighborhood specific performance):
- On-Time Performance
- Service Gaps
- Peak Period Crowding
- Travel Time to Key Destinations
SFMTA uses this quantitative data combined with qualitative data to produce analyses of each priority neighborhood. Within the transit agency’s Service Strategy updates, quantitative information for each of these metrics is presented in appendices. In the main document, a narrative discussion of the performance as well as feedback collected from the neighborhood (using the methods previously described) presents a holistic assessment, via “Neighborhood Profiles,” of the needs in each priority neighborhood before outlining, specifically, how SFMTA proposes to address the needs that have been identified. Figure 33 presents a visual relationship between SFMTA’s Service Equity Policy, Service Equity Strategy, and its transit planning activities.

Metropolitan Transportation Commission (MTC)
MTC and the Association of Bay Area Governments (ABAG) utilize a performance-based approach for long-range planning and forecasting, incorporating indicators that consider the impact of the plans on disadvantaged communities.
For the development of performance targets in the Plan Bay Area 2040 plan, extensive input was obtained from the Performance Working Group, comprising various stakeholders such as MTC’s Policy Advisory Council members, congestion management agencies, and local jurisdiction staff, transit operators, community groups, business organizations, and environmental protection groups.
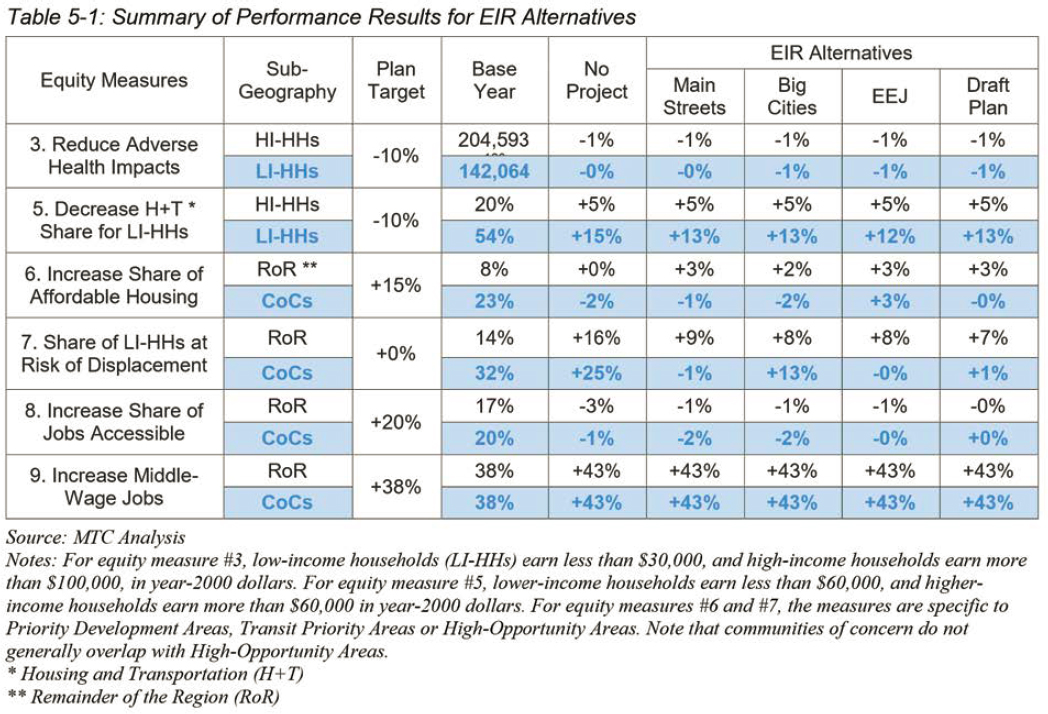
The goals for PBA 2040, along with 13 performance targets, were adopted by MTC and ABAG in September 2015. Two of these targets—reducing per capita greenhouse gas emissions from passenger vehicles by 15 percent and housing future population growth in the region—are statutory requirements. The remaining 11 targets address areas such as healthy and safe communities, open space protection, equity, economic vitality, and transportation system effectiveness and 6 of the targets directly focus on equitable outcomes and serve as the basis for conducting the Plan’s equity analysis. These six targets are referred to as equity measures and are used to assess benefits and burdens on disadvantaged communities.
The equity measures for PBA 2040 include:
- Healthy and Safe Communities: Measuring health benefits and burdens related to air quality, road safety, and physical inactivity for both high-income and low-income households.
- Equitable Access: Comparing the share of income consumed by transportation and housing costs for lower-income households with that of higher-income households.
- Equitable Access: Assessing the share of affordable housing in Priority Development Areas (PDAs), Transit-Priority Areas (TPAs), or High-Opportunity Areas (HOAs) within and outside CoCs (Communities of Concern).
- Equitable Access: Examining the share of low- and moderate-income households in PDAs, TPAs, and HOAs that are at an increased risk of displacement, within and outside CoCs.
- Economic Vitality: Determining the share of jobs accessible by auto and transit in congested conditions, within and outside CoCs.
- Economic Vitality: Measuring the share of middle-wage jobs in the region, within and outside CoCs.
MTC and ABAG conducted an equity analysis using these equity measures at four stages of the final Plan’s preferred alternative: project performance, scenario analysis, draft preferred analysis, and the Environmental Impact Report (EIR).
The methodology for assessing equity impacts involved designating census tracts as either Communities of Concern1 (CoCs) or the remainder of the region and calculating indicator variables for each alternative based on the six equity measures. The analysis compares the results of the analysis of the Plan’s preferred alternative to the “No Project” alternative, evaluating whether the scenario had a beneficial effect on CoCs or populations with low incomes compared to the remainder of the region or populations with high incomes.
Figure 34 presents the modeled results for each of the six equity measures, including the baseline year, “No Project” alternative, and various alternative scenarios.
In the context of transportation investment analysis, PBA outlines two components:
- Population/use-based analysis: This component quantifies the benefits of transportation investments and allocates them to two population groups (people with low incomes and people of color) based on their share of system usage for roadway and transit travel. The share of benefits is then compared to the overall share of the region’s population that consists of people with low incomes or people of color.
- Mapping analysis: This component involves a qualitative assessment of the spatial distribution of major roadway and transit projects in relation to the location of concentrations of people with low incomes and people of color.
The investment analysis of the Draft Plan assesses the relative impact of investments on people with low incomes and people of color compared the rest of the population.
Sources: (Sood et al., 2017)
TriMet
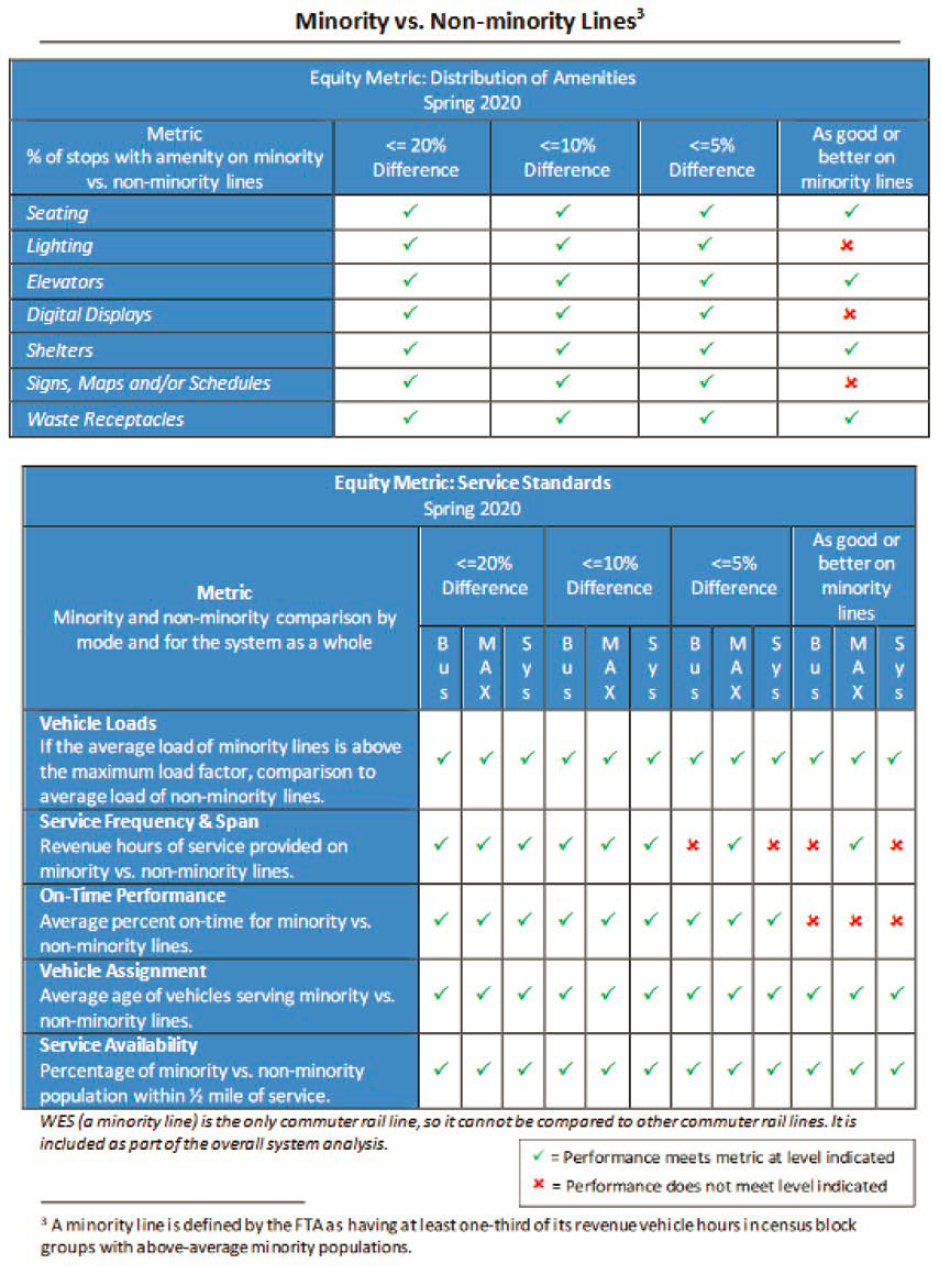
TriMet, the transit agency service the Portland, OR, area, assesses various aspects of its service through performance measures outlined in their Spring 2020 Title VI Service Monitoring Report. The measures include:
- Service frequency and span: TriMet evaluates the total hours of service provided, considering the distribution and duration of revenue hours. This evaluation includes the time from the start to the end of each trip.
- On-time performance: TriMet defines being “on-time” as arriving no more than five minutes late or one minute early at designated time points.
- Vehicle loads: TriMet assesses overcrowding on fixed-route buses and light rail vehicles by comparing the ratio of passengers to available seats (load/seat ratio) with the maximum load factor for each vehicle type: bus (1.3), light rail (2.1), and commuter tail (1.0).
- Service availability: TriMet considers individuals residing within a half-mile radius of bus stops and/or rail stations as having access to service. The transit agency describes service availability as both the number and percentage of the population within the district, determined by the type of vehicle.
- Stop amenities: TriMet examines the distribution of amenities at stops throughout their system, such as shelters, seating, lighting, and waste receptacles. The goal is to identify any potential disparities in amenity provision.
- Vehicle assignment: TriMet evaluates the practices of assigning vehicles to fixed-route buses and light rail lines. They expect that the average age of vehicles on minority and/or low-income lines should not exceed the average age of vehicles on non-minority and/or higher income lines.
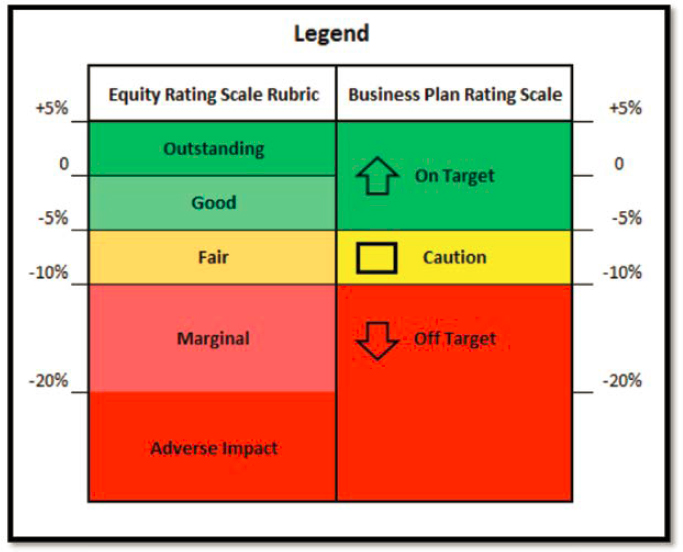
To assess performance, TriMet utilizes a Title VI rating scale rubric with five categories: “outstanding,” “good,” “fair,” “marginal,” and “adverse impact” as shown in Figure 35. To achieve an “outstanding” rating, access or service distribution for minority and low-income populations must be at least as good as, if not better than, those for non-minority and higher income populations. Performance findings within a 5% threshold are considered “good,” aligning with TriMet’s Business Plan objective. Differences between 5% and 10% are categorized as “fair.” Scores above a 10% threshold but below 20% are considered “marginal” and serve as
cautionary indicators for improvement. Any measure exceeding a 20% difference signifies an “adverse impact,” leading to findings of system-wide disparate impact or disproportionate burden as determined by the Federal Transit Administration. TriMet commits to continuously enhancing service and accessibility to achieve equity targets and comply with their Title VI Program, adopted by their board.
TriMet’s 2020 Title VI Service Monitoring Report includes summaries of performance according to the above measures and rubric. Figure 36 presents an example of TriMet’s analyses comparing the distribution of amenities and performance on service standards for “minority” and “non-minority” transit routes. A similar summary is produced to compare the same factors on “low-income” and “higher income” routes. Each of the metrics presented in the example in Figure 36 is also documented in detail with specific quantitative outcomes in the Report, similar to the example shown in Figure 37.

Sources: (Green, 2021)
Transit Stakeholders
City of Oakland
The City of Oakland developed the Racial Equity Impact Assessment & Implementation Guide to help city staff implement the 2030 Equitable Climate Action Plan (ECAP) with a particular focus on communities in Oakland that face high climate risks and have significant socioeconomic burdens. The Guide suggests using Key Performance Indicators (KPIs) to monitor and evaluate equity outcomes, track progress, and ensure the achievement of climate equity goals. In presenting an example list of KPIs, the Guide also acknowledges that the list provided is not exhaustive and encourages staff to select indicators relevant to each action. The Guide recommends involving impacted communities in shaping objectives, indicators, and metrics to monitor implementation. It also suggests utilizing community participatory research and partnerships to gather relevant data while highlighting the importance of equitable governance, community partnerships, and increasing community safety. It recommends specific objectives and provides KPIs related to equitable governance, equitable investments, and community resilience while emphasizing the importance of developing equitable climate policies based on data, science, and community participation. The KPIs include attendance and participation in community-based engagement activities, partnership agreements with community-based organizations, reductions in air pollution and traffic density, improvements in public transit infrastructure, housing affordability, job creation, and strengthening local assets. The Guide also discussed the importance of biennial evaluation and reporting to track progress and make necessary adjustments throughout the implementation of the plan.
The City of Oakland Municipal code emphasizes the principle of “fair and just” in all its activities to achieve equitable opportunities for everyone, with a focus on developing systemic approaches to address racial disparities in life outcomes for Oakland residents. The 2018 Oakland Equity Indicators Report revealed that Black residents were most severely affected by racial disparities, with other communities of color also experiencing significant impacts. To improve these conditions, departments are instructed to analyze policies, procedures, and practices that contribute to or can improve these disparities. In an effort to facilitate this process, the city developed a worksheet to guide project planning and implementation by explicitly addressing equity outcomes, engaging affected communities, and designing community-
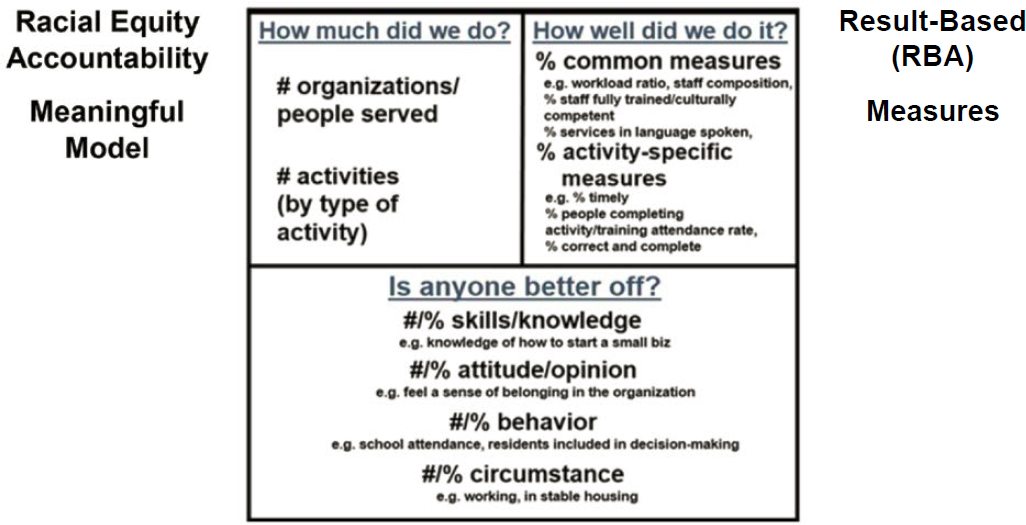
informed equity solutions. The steps outlined in the guide include defining racial equity outcomes, engaging stakeholders, gathering qualitative data, identifying equity gaps, addressing those gaps, implementing action plans, and establishing evaluation and accountability measures. These measures include tracking outcomes, collecting disaggregated data by race, and keeping stakeholders informed of progress and best practices. Additionally, the city guides staff to use a results-based accountability concept (outlined in Figure 38, below) to develop additional evaluation and accountability measures that reflect specific circumstances where appropriate.
The Racial Equity Impact Analysis tool, developed by the City of Oakland, is designed to promote reflection among staff, educate them about the root causes of racial inequities, and guide them in using data and community engagement to make decisions and policies that lead to equitable change. It does not provide definitive answers but encourages a comprehensive analysis. The tool can be applied to various systems, such as transportation, education, and community development, with the goal of addressing inequities in communities of color and communities with low incomes. It acknowledges the historical inequities in Oakland and utilizes racial equity outcomes and baseline indicators2 to inform decision-making. The tool is intended to be used alongside the OakDOT Geographic Equity Map, which identifies priority neighborhoods based on demographic factors, safety concerns, urban displacement, and vulnerable populations.
The City of Oakland’s Department of Race and Equity was established in 2015 to formalize a commitment to embedding racial equity into the city’s decisions and policies and disrupting outcomes that perpetuate disparities. According to the city, this tool is a step toward assessing and designing for racial equity and is influenced by community advocacy efforts. Oakland’s Racial Equity Impact Analysis Tool emphasizes collaboration with impacted communities to
ensure access to essential opportunities and well-being. The tool exists to provide a data-driven approach that educates users about racial disparities and their causes, aiming to inform actionable solutions. Building “intentional and meaningful relationships with communities of color and low-income communities” is seen as a crucial element of the city’s commitment to racial equity, and the tool is designed for various stakeholders to contribute to “closing the racial disparities gap” in Oakland.
Sources: (City of Oakland, 2019; Dean et al., 2021; Tobias et al., n.d.)
City of Salt Lake City
The City of Salt Lake City (SLC) developed a framework to address equity needs in the city’s Westside neighborhood and focused on: Equitable Engagement, Equitable Access, Equitable Options, and Equitable Community. The goal of the framework is to establish baseline performance measures and create opportunities to achieve equity in each of these areas. To identify the characteristics that require attention, SLC considered social factors that “often [are] marginalized in mainstream society, such as low income, membership in minoritized cultures or racial groups, a disability, or young or old age.”
To assess equity needs, SLC developed the Equity Index—a screening tool that identifies areas with higher concentrations of historically marginalized populations. The index considers characteristics such as poverty, minority status, disability, lack of vehicle ownership, age groups, and limited English proficiency. Calculated percentages for each characteristic at the block-group level indicate the relative concentrations of a specific group in the study area. These percentages are organized into 20th percentiles and assigned scores ranging from 1 to 5. The total score, with a maximum of 35, indicates the concentration of equity-related characteristics in an area. At the time the information about the index was published, the authors noted that it was in its initial stages and the factors in includes were unweighted. The framework SLC developed is presented as a starting point for assessing progress on transportation equity in Westside neighborhoods and the authors also indicate that further refinement and weighting are necessary due to the overlap between many of the characteristics. Additionally, the staff struggled to obtain data on participation from demographics such as people with disabilities and limited English proficiency.
In terms of engagement, SLC’s goal is to increase the meaningful participation of historically marginalized communities in transportation planning and decision-making processes by providing accessible and inclusive opportunities tailored to equity populations and creating partnerships with the community, government, and businesses. However, challenges in attracting participation from low-income individuals and prominent minority groups persist.
To improve communication, SLC aims to clearly convey transportation network information and options to those with “historically marginalized characteristics.” The city develops materials, signs, and other communication tools and implements informational and educational efforts targeted at equity populations but acknowledges that there is an ongoing need for improved communication, especially in translating materials and using plain language.
In terms of equitable access, SLC seeks to increase access to jobs, education, and neighborhood amenities. The city’s goal is to provide affordable and direct transit options for work commutes, meet the transportation needs of youth, and reinforce access to basic goods and services. The city also aims to reduce transportation barriers in the city and region with a focus on improving crossings and shortening barriers to enhance connectivity. Two areas where transit access is particularly challenging include the Westside industrial area and high schools, and city/regional connectivity is challenged by large arterial roadways and the Jordan River.
According to SLC, assessing progress has helped identify areas for improvement such as increased participation from people with low incomes and Latinx residents. The city also lacks data on the participation of people with disabilities and limited English proficiency. However, efforts have been made to disseminate information and resources to those with equity-related characteristics.
In terms of transportation access, there are challenges in providing direct transit options to employment areas and high schools. The existing bicycle and transit networks generally connect to community destinations, but there are gaps that need to be addressed. The city also faces challenges with significant transportation barriers in the Westside, such as large arterial roadways and the Jordan River.
Overall, the city’s goal is to create a reciprocal accountability relationship between residents, government, and businesses, where mutual respect is seen as essential for healthy communities.
Top of Form
Sources: (City of Salt Lake City, n.d.)
Metropolitan Washington Council of Governments (MWCOG)
MCWOG conducted an equity analysis of bus transit in their jurisdiction with the goal of addressing the following questions:
- “How does bus transit access for traditionally underserved groups compare to the overall population’s transit access in the region?”
- “How does bus transit access for COG’s Equity Emphasis Areas (EEAs) compare to the overall population’s transit access in the region?”3
- “How does bus transit access to peak, high-frequency service (15 minutes or better) compare for traditionally underserved groups?”
- “How does bus transit access to jobs for low-wage work and essential jobs compare to the overall population’s transit access to jobs?”
To conduct the analysis, various demographic and employment groups were considered, such as total population density, all workers’ home location density, total household density, low-wage workers’ home location, persons of color population density, total job density, persons with disabilities density, density of essential service jobs, density of households with low incomes, density of low-wage jobs, zero/one-car household density, language other than English (LOTE) density, and veteran population density.
The analysis utilized a dynamic web map presented using ArcGIS Online to visualize the results—as shown in a screenshot in Figure 39 available at: https://fitp.maps.arcgis.com/apps/webappviewer/index.html?id=9947fb0f78084a06aae2e747e093964b.
The analysis focused on disparities in access to bus transit. To compare transit access between different groups, population and jobs were counted within a one-quarter mile buffer around stops with specific service frequencies during peak and midday periods. Tabulations were made for various factors, including total population, racial demographics, low-income households, people with disabilities, language diversity, household types, and job types. Detailed results for the analysis can be found in Table 3 and Table 4 of the report—for reference, a snippet of these tables is presented in Figure 40.
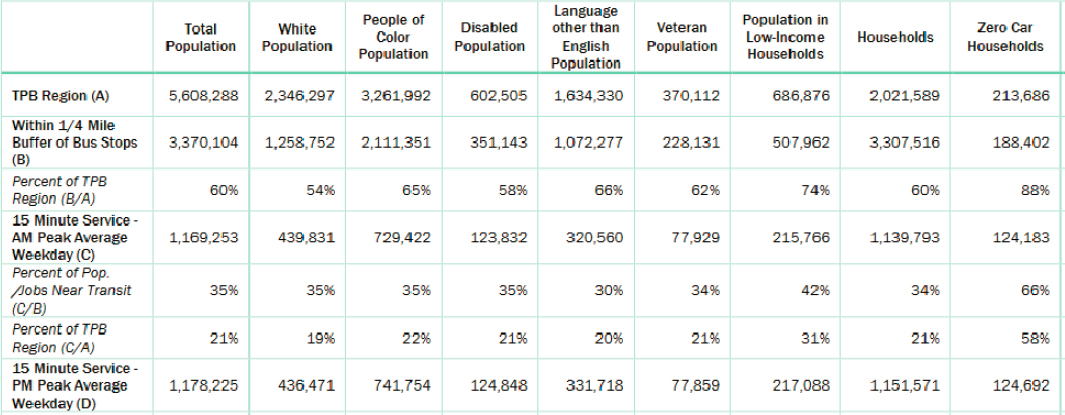
Additionally, a network job accessibility analysis was conducted, examining access to jobs based on different dimensions. This analysis considered jobs accessible for all workers compared to low-wage workers, jobs accessible for people living within EEAs compared to those outside of EEAs, access to essential jobs compared to all jobs, and comparisons between different service periods. The Conveyal accessibility analysis platform was used to conduct this analysis—this software calculates network-based travel patterns from multiple origins to multiple destinations, allowing for regional aggregation of accessibility measures. The platform considers “demographic data (such as job counts), geographic aggregations (such as Equity Emphasis Areas), and GTFS feeds that describe transit systems.” Various parameters can be adjusted, such as the date and time ranges used for calculations.
Sources: (Randall, 2022)
North Jersey Transportation Planning Authority (NJTPA)
NJTPA utilizes performance measures, data on transportation system outcomes, and various tools to evaluate disparities and ensure equitable access. The analysis focuses on indicators such as bicycle/pedestrian crashes, access to frequent transit, travel time to work, number of jobs accessible by transit, and commute needs. Socio-demographic groups, including minority populations, low-income households, transit-dependent populations, foreign-born populations, limited English proficiency populations, persons with disabilities, and persons over the age of 65 are considered. In its documentation of this analysis, NJTPA emphasizes the importance of qualitative data and stakeholder inputs to supplement the analysis of quantitative measures. The agency outlines the following goals and objectives, performance measures, tools and data, and challenges in its June 2021 equity assessment:
Goals and Objectives:
- Identify accessibility and mobility needs for disadvantaged and vulnerable population groups.
- Evaluate differences in travel patterns and highlight potential requirements across various sociodemographic groups.
- Assess equity needs by examining areas with high numbers of vulnerable populations and poor service levels or performance outcomes.
- Prioritize areas and census tracts with high vulnerability and identify potential gaps in accessibility.
- Understand commute needs by analyzing home and workplace locations of equity groups and their connectivity via transit services.
- Determine the impact of social vulnerability, zero-vehicle households, and other demographic factors on mobility outcomes.
- Promote equitable access to transportation and address disparities.
Performance Measures:
- Bicycle/pedestrian crashes with fatalities or serious injuries.
- Access to frequent transit.
- Travel time to work.
- Number of jobs accessible by transit.
- Congested roadways.
- Commute needs based on transit services in relation to job and housing locations.
Tools and Data:
- CMP performance measures and transportation system performance data.
- Social Vulnerability Index (SVI) developed by the Centers for Disease Control and Prevention.
- Qualitative inputs from stakeholder questionnaires.
- Geographic data analysis.
- Longitudinal Employer-Household Dynamics (LEHD) Origin-Destination Employment Statistics (LODES) 2017.
Challenges:
- Quantitative data analysis alone is insufficient to identify all issues facing vulnerable population groups and support equitable access.
- The analysis primarily focuses on relative comparisons across sociodemographic groups rather than absolute levels.
- The demographics of census tracts are considered, but not the demographics of individuals involved in crashes or traffic congestion.
- Reverse commute trips and employment destinations lacking transit services may present additional needs.
- The geographic units used for job accessibility and place types differ, affecting the calculation of summary statistics.
- The analysis represents potential commute needs rather than individual commute flows.
Sources: (North Jersey Transportation Planning Authority, 2021)
Wasatch Front Regional Council (WFRC)
The WFRC uses an Equity Focus Areas framework for its transportation planning efforts. WFRC used 2016 American Community Survey data to identify communities of concern along the Wasatch Front, and an update to this dataset was planned for mid-2022 (though, at the time of this writing, it was not publicly available). Equity Focus Areas are census block groups that meet specific criteria: having a low-income population greater than 25 percent, a racial-ethnic minority population greater than 40 percent, or zero-car households greater than 10 percent. These criteria are based on the understanding that lack of access to transportation can hinder economic mobility and that past transportation investments have disproportionately affected communities of color. The WFRC incorporates equity considerations into its scenario analyses, project prioritization processes, and reviews and scores applications for transportation projects.
They aim to prioritize projects that promote equity and analyze how external factors impact the identified equity focus areas.
According to the WFRC, the concept of Access to Opportunities (ATO) can be evaluated using various frameworks and scales. At a regional level, ATO can be measured and predicted using the regional Travel Demand Model, and the results can be presented visually through geographic information systems (GIS) maps. To simplify the calculation of ATO gains for small and medium-sized transportation and land use projects, the WFRC has developed the GIS-based ATO Impact Tool. This tool utilizes ArcGIS Pro’s network analyst, open-sourced python notebooks, and a multimodal transportation network to make assessments based on household and job intensity within Transportation Analysis Zones (TAZ). Assumptions about how new projects affect workplace accessibility measures are also considered.
The ATO measures combine transportation system performance during rush hour with the distribution of households and workplaces across the region. ATO focuses on the efficiency of travel between home, work, and other desired destinations within metro areas. It provides insights into key labor market components, such as the average number of jobs reachable within a specific travel time or the potential number of employees or households that a business might attract in a particular location (however, these factors are not limited to transit considerations). The patterns and intensity of development, as well as the transportation system, significantly influence these measures.
Higher accessibility scores are achieved through shorter travel times and an increased presence of employment and other opportunities. Strategies for reducing travel times include improving destination proximity to homes, enhancing transit services, and reducing road congestion. WFRC’s land use and travel models enable the forecast and exploration of the accessibility impacts of land use decisions and transportation enhancements for a decade or more into the future.
At a local scale, ATO can be measured with more detail compared to the regional Travel Demand Model, considering additional travel modes such as biking and walking. Local accessibility metrics encompass a broader range of destinations, including essential goods, services, and activities. This pertains to the ease with which residents can reach existing amenities that contribute to livability, such as grocery stores, healthcare facilities, parks, public spaces, or transit stops linking to employment opportunities and services. The WFRC has found that the quality of accessibility is enhanced in neighborhoods characterized by a mix of land uses, good street connectivity, and safe walking environments.
For the WFRC, ATO measurements help identify disparities between residents and access to employment opportunities and other basic needs at the neighborhood level. This is particularly important for underserved populations that can benefit from alternative transportation methods to fulfill their essential requirements. The WFRC considers the application of ATO in understanding the needs of equity focus areas a valuable approach.
Since 2017, WFRC has dedicated multiple efforts to implement ATO measures that enhance the connection between transportation, land use, and economic development. These efforts include the incorporation of ATO metrics into scenario evaluations and project prioritization scoring for roadway, transit, and active transportation projects within the performance-based planning system of the 2019-2050 Regional Transportation Plan. ATO has also been approved by the WFRC Transportation Coordinating Committee (Trans Com) as a component of project
technical scores for Surface Transportation Program project funding. The Wasatch Front Economic Development District (WFEDD) has adopted ATO as a key strategy for economic development, with a plan to monitor ATO metrics over time to assess progress in the region. The ATO framework and supporting data resources are a consistent focus for workshops and outreach initiatives conducted by WFRC with cities and counties in the region.
The Equity Focus Area (EFA) framework developed by WFRC plays a crucial role in the Council’s transportation planning process. It aims to provide enhanced transportation options and job accessibility to EFA communities, which have significant mobility and accessibility needs. EFA communities are identified by WFRC as Census tracts with over 25 percent people with low incomes and/or over 40 percent people of color. By comparing the performance of the transportation system for the entire region with that of EFAs, WFRC seeks to ensure fair and equal access to affordable and dependable transportation choices. EFA performance measures include:
- Number of jobs and households within a typical commute – auto
- Number of jobs and households within a typical commute – transit
- Auto:Transit access to opportunities ratio
- Total time per day the average person spends in a vehicle (automobile only)
- Percent of people nearby frequent bus or rail
- Percent of people nearby frequent dedicated bike facility
- Walk and bike mode split
- Transit mode split
- VMT per day per household
Sources: (Wasatch Front Regional Council, n.d., 2022, 2023)
West Side Community Organization (WSCO)
WSCO in St. Paul, MN, established its Equitable Development Scorecard to help ensure equitable development, environmental justice, and affordability for all residents. It is intended to be a flexible document that can be adapted by communities to meet their specific needs. The scorecard serves as a tool to guide communities in implementing the associated principles and practices.
According to WSCO, the creation of the Equitable Development Scorecard is a crucial foundation for WSCO’s work helping to launch the rest of their initiatives and efforts. The organization also works to increase civic participation, provide leadership development opportunities, and educate residents on St. Paul’s West Side. They work towards systemic change in areas of racial, economic, social, and environmental justice and facilitate community economic development planning, organization of resources to address urban blight, and advocating for equitable development.
In an effort a to overcome “the legacy of complicated and disenfranchising public processes that left the community feeling frustrated and powerless,” WSCO initiated the Action to Equity series in partnership with the University of Minnesota’s Center for Urban and Regional Affairs
(CURA). This series aimed to provide a shared analysis and equity lens for community members to move forward together. The series delved into the history of racial inequity, emphasized community power and organizing as tools for change, and facilitated meaningful conversations.
The West Side Action to Equity series engaged over 100 participants through deep-dive discussions and workshops. The aim was to create shared understanding and real buy-in from the community, before working to review and improve the Scorecard as a tool to define the desired type of development.
WSCO leaders were intentional about emphasizing that the West Side Scorecard would go beyond a checklist or assessment measure. They recognized the importance of robust leadership from community members and the need for time and intention to ensure the Scorecard’s impact and longevity.
The process of developing and implementing the Scorecard involved following a set of specific steps outlined by CURA, such as starting from a shared analysis, reframing the conversation, dedicating staff, creating working groups, and extending the timeline. Community engagement was also crucial, and WSCO used strategies such as listening to learn, committing to key voices, being creative in connecting with the community, and embracing the unexpected. WSCO worked to develop solidarity with workers by incorporating their interests into the Scorecard. They included provisions for local hiring and equitable wages and established partnerships with organizations like Centro de Trabajadores Unidos en la Lucha (CTUL) to address the issues faced by laborers. This collaboration facilitated WSCO’s ability to hold developers accountable for abuses of subcontractors.
The Scorecard’s influence on city planning decisions has been significant. It became part of the West Side Community Plan, guiding changes, policies, and investments initiated by developers and the city. Developers approaching the city for projects on the West Side are directed to the Scorecard. WSCO reviews Scorecard responses from developers to determine their support or rejection of projects and documents that decisions for the City Planning and Zoning Committee, whose recommendations are then considered by the City Council.
Sources: (West Side Community Organization, n.d.; West Side Community Organization & The Alliance, 2020)
___________________
1“MTC identifies CoCs based on the relative concentration of disadvantage at a census tract level. The demographic makeup of CoCs is therefore distinct from the region as a whole... While 23 percent of the region’s total population resides in CoCs (1.71 million out of 7.34 million residents), this percentage captures a meaningful cross-section of disadvantaged communities in the Bay Area. For example, 83 percent of the population in CoCs is minority and 47 percent is low-income, compared to 59 percent and 25 percent respectively for the region. But for seniors and people with disabilities, the difference is indistinguishable, suggesting that these populations tend to be more dispersed around the region.”
2Described in the City of Oakland’s “Oakland Equity Indicators: Measuring Change Toward Greater Equity in Oakland” report, available here: https://cao-94612.s3.amazonaws.com/documents/2018FullReport-12021edit.pdf
3“[Census] Tract are identified as Equity Emphasis Areas if one of two criterions are met: Tracts must have a concentration of individuals identified as low-income more than one-and-a-half times the regional average (see Table 1 below) or high concentrations of two or more minority population groups and/or high concentrations of one or more minority population groups together with low income concentrations at or above the regional average.” https://www.mwcog.org/assets/1/6/methodology.pdf


