Transit Agency Goals and Non-Traditional Performance Indicators Focused on Equity (2024)
Chapter: 4 Regional Case Examples

CHAPTER 4
Regional Case Examples
Case example sites were selected from a list generated via the literature review and project panel inputs. Ultimately, twenty agencies were identified, with nine of them prioritized as top choices due to their unique practices. After reaching out to the top choice agencies, five expressed interest and a willingness to participate in the case example process. As a result, a meeting with each agency was scheduled so that the synthesis team could collect information not already available via public resources (e.g., agency websites and previous research). These discussions followed a detailed discussion guide as presented in Appendix C, which is similar to, but more detailed than, the Survey/Research Chat Questions presented in Appendix B.
Three of the case examples (the DRT, MBTA, and Metro Transit) presented agency-wide goals and measures, and two others (Cecil Transit and Envida) presented service/mode-specific goals and measures. Following a brief introduction to the transit agency are the findings from each case study organized in the following sections:
- Agency Definition of Equity
- Institutional Structure and Governance
- Current and Potential Indicators
- Target Setting and Recent Performance
- Engagement and Responsiveness
- Planning, Programming, and Operations
- Funding and Financing
- Data Collection and Management
- Lesson Learned and Challenges
- Summary, Including Key Challenges, Notable Practices, and Lessons Learned
DRT

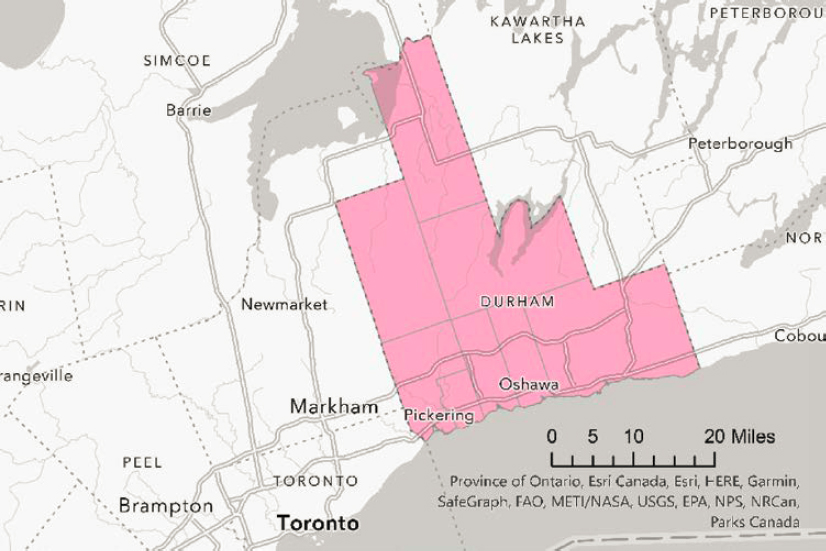
Since 2006, DRT has been the transit provider for the Regional Municipality of Durham (hereafter the “Region”), located east of Toronto, Canada, in the province of Ontario. Prior to the creation of DRT, each city or town in the Region was responsible for its own transit services. DRT operates scheduled bus service and On Demand (i.e., a shared ride service that uses smaller vehicles and dynamic routing where and when scheduled bus routes are not operating). Door-to-door On Demand service (paratransit) is also available for customers whose disabilities prevent them from using scheduled bus service. DRT service is available 24 hours a day every day of the week in urban areas and from 6 a.m. to midnight on weekdays and 7 a.m. to 9 p.m. on weekends in rural areas. Much of the funding for DRT services comes from property taxes, with the rest consisting of funding from fares, gas tax revenue, and reserve funds. Table 8 presents a summary of DRT’s 2021 performance, and Figure 1 is a snapshot of the transit agency’s service area.
Table 8. DRT service summary.
| Operating Statistic | Total |
|---|---|
| Service Area Size (Sq Mi) | 980 |
| Service Area Population | 696,692 |
| Modes Operated | Bus Demand Response On-Demand |
| Annual Unlinked Trips | 5,507,017 |
| Annual Vehicle Revenue Miles | 6,257,108 |
| Annual Vehicles Revenue Hours | 349,619 |
| Operating Costs by Revenue Source | |
| Fares | $16,914,391 |
| Municipal Funds | $54,717,067 |
| Provincial Funds | $8,630,915 |
| Federal Funds | $0 |
| TOTAL | $80,262,373 |
| Operating Cost per Trip | $14.57 |
Data Source: DRT
Image Source: Texas A&M Transportation Institute (TTI)
DRT was chosen as a case example because of the transit agency’s Social Equity Guidelines, guiding principles that put riders and their needs first, equity vision and buy-in at the decision-maker/leadership level, a regional commitment to provide transit to everyone, and a unique operating environment (consisting of everything from dense urban areas to vast rural areas). DRT’s Social Equity Guidelines combined with its service guidelines allow the transit agency to address transit equity comprehensively (instead of tokenized projects or groups) and in a manner that has garnered enough community support to earn additional property tax funding for the next 10-year funding cycle.
Agency Definition of Equity
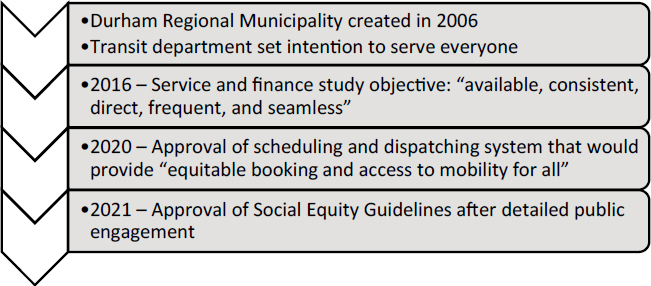
According to DRT staff, the project’s definition aligns with how their transit agency approaches transit equity. However, instead of a definition, DRT has developed a public equity
statement—DRT’s Social Equity Guidelines—that outlines how the agency approaches equity in all aspects of transit (this statement was informed by a thorough internal process and approved by the governing council). The introduction to DRT’s Social Equity Guidelines is presented in Figure 2, and the complete set of guidelines are available at: https://www.durhamregiontransit.com/en/travelling-with-us/social-equity-guidelines.aspx.
Adoption of Equity Effort
When discussing these guidelines, DRT staff emphasized two of the agency’s guiding principles:
“Every customer trip counts.”
To ensure that people have basic mobility throughout the region, DRT uses different service models to meet different needs and to be as efficient as possible in its various operating environments. For example,

service is available 24 hours per day every day, but the type of service varies depending on where and when it is operating—fixed route service in dense areas and at times of high-demand and on-demand or demand response service in less dense areas and/or at times of low demand.
“We provide customer-centric integrated services that enable independent, spontaneous, and worry-free travel.”
DRT’s customer-centric approach helps ensure people have access to transit service the way they need it when they need it. For example, DRT knows and accounts for riders who do not use smartphones (or have mobile data); therefore, call centers are critical to ensuring everyone has access to real-time transit information and the ability to make trip requests. Additionally, the agency is committed to being proactive in their efforts to facilitate access to service. The Ambassador Team works to reduce barriers to service with one-on-one and group travel training to help riders become more comfortable using transit, and this service is available to anyone.
Institutional Structure and Governance
DRT was established under the DRT Commission in 2006 to provide transit service throughout the Region in the Province of Ontario in Canada. As such, the transit agency is governed by the DRT Executive Commission (the commission consists of the members of the Durham Regional Council and is led by the Regional Chair, who also holds the position of chair of the DRT Executive Commission). Prior to 2006, each city in the Region was responsible for its own transit services. According to DRT staff, strong commission- and council-level support exists for transit equity and efforts that ensure everyone in the Region has access to transit when they need it. DRT’s approach to providing comprehensive transit service throughout the Region stems from previous council commitments to provide paratransit service that exceeds the required minimums (similar to the United States, Canada requires accessible paratransit services in areas with scheduled fixed route service) and allows people with disabilities to freely travel throughout the Region.
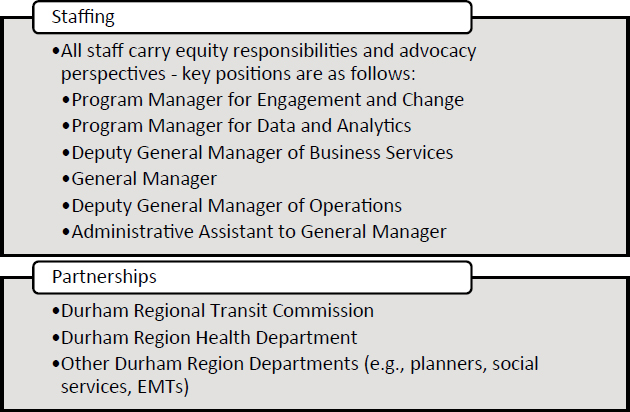
The council has empowered DRT staff to work within available budgets to ensure DRT meets its commitments to provide service throughout the Region that meets the various needs of the community. As such, everyone at the agency is expected to contribute to efforts to improve transit equity within their respective roles, so much so that DRT staff describe their approach as coming from an “advocacy perspective” when dealing with decisions that affect transit equity. This perspective means that vulnerable road users, sidewalk accessibility, pedestrian crossings, and other similar “complete trip” considerations related to accessing transit service are at the forefront of the agency’s thought processes and often influence their interactions with other agencies (e.g., working with the entity responsible for sidewalk infrastructure to improve conditions or providing comments via planning processes about how projects could better serve people). The advocacy perspective also guides DRT’s efforts to change the way people approach transportation conversations so that the focus is on people and not vehicles (e.g., pedestrian safety instead of vehicle throughput). Furthermore, DRT staff noted that equity is “part of the fabric of government now,” which helps the transit agency work with other departments within the regional municipality, such as social workers and the housing agency, and with social service organizations. One way DRT works with other departments of the regional municipality is providing service that mirrors or supports the objectives of other groups. For example, Vision Zero traffic safety work is a regional priority, and DRT works to include Vision Zero principles in its service planning and operations (e.g., siting of stops or driver training). Internally, the human resources department is well versed
in social justice hiring practices, helping DRT ensure its staff and decision-makers reflect the communities they serve.
Current and Potential Indicators
DRT considers work on social equity to be a foundational part of its responsibility and something that is incorporated into all aspects of the agency. Therefore, DRT regularly reflects on the Social Equity Guidelines, and the transit agency’s service standards, to check whether the service that is available (or being planned) aligns with the expectations set forth in those documents. With that in mind, DRT puts forward its best efforts to prioritize based on other environmental pressures (i.e., service can only be rebalanced within the confines of the resources available to do so and without adverse impacts to other segments of the customer base). Additionally, DRT has established several social equity initiatives designed to help the agency provide the service people need and where they need it.
The Social Equity Guidelines exist to help the agency “ensure . . . decision making is evidence informed and considers a social equity focused approach to transit.” For example, the Social Equity Guidelines include the following commitments (DRT 2023c):
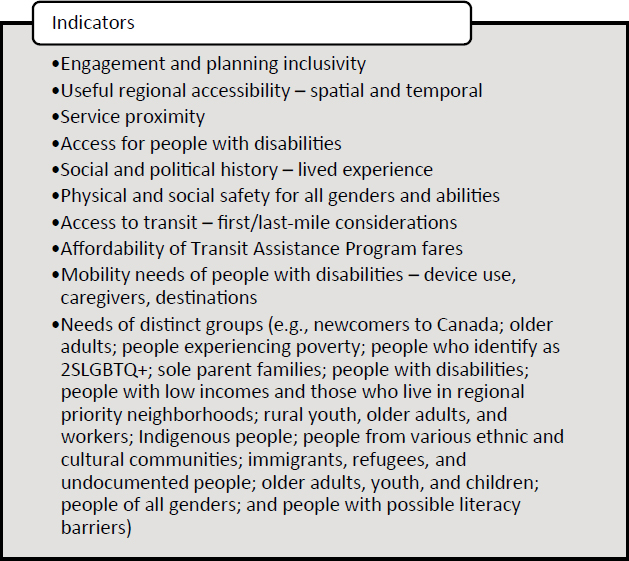
- Transit planners are expected to account for “transit realities and barriers” faced by equity priority groups, including newcomers to Canada; older adults; people experiencing poverty; people who identify as 2SLGBTQ+; sole-parent families; people with disabilities; people with low incomes and those who live in regional priority neighborhoods; and youth, older adults, and workers in rural areas. “It is imperative that DRT staff factor in these and other transit realities when planning transit services and incorporate a multiplicity of perspectives. This awareness can help develop and deliver services that are responsive and relevant to clients and communities and, ultimately, address unintended barriers within our transit system.”
- “We should . . . treat people the way they would like to be treated and avoid providing services based on our own preferences.” DRT states that the following groups require additional consideration during service planning: Indigenous people; people from various ethnic and cultural communities; immigrants, refugees, and undocumented people; lone-parent families; people with disabilities; people with low incomes; older adults, youth, and children; people of all genders; and people with possible literacy barriers. “In naming these equity priority groups; DRT acknowledges that these communities are not mutually exclusive. Individuals may self-identify as belonging to more than one group.”
- DRT will devote additional focus on the seven priority neighborhoods identified by Durham Public Health as ranking “poorly in terms or overall income, education levels, and employment.”
- DRT will review an equity checklist (see Table 9) during decision-making processes to “prompt important front-end considerations” and “think through and articulate how we’re integrating equitable and inclusive approaches into transit planning.”
DRT plans, monitors, and adjusts all services to adhere to simple service standards (DRT 2023b) as shown in Table 10 (emphasis added to highlight core equity concepts).
DRT’s social equity initiatives help the transit agency provide service that accounts for specific needs within the communities they serve. The initiatives include commitments to do certain
Table 9. DRT’s equity checklist.
| Category | Questions |
|---|---|
| People and Participation |
|
| Destinations, Routes, Vehicles, and Stations |
|
things (e.g., install transit shelters) as well as methods for adjusting service standards to account for the specific needs of specific groups. Table 11 presents all DRT’s social equity initiatives (DRT 2023c). Additionally, DRT tracks some specific measures related to transit equity outlined in Table 12.
Target Setting and Recent Performance
Because of the way DRT approaches transit equity—as a factor that is foundational to the service they plan and provide—the transit agency does not set targets for certain levels of performance
Table 10. DRT’s transit service standards.
| Standard Name | Description |
|---|---|
| Service Deployment | Residents of the Region can access transit services throughout the entire area from early mornings to late night seven days a week. How the service is delivered to an area varies by time of day and day of the week to ensure services are sustainable and implemented in an efficient and fair manner. |
| Ridership Productivity | As a base service, Demand Response service is provided when scheduled routes are unable to meet minimum ridership productivity targets. Ridership productivity targets are not applicable to the overnight network because the service provides mobility to groups of customers who may have no other travel option available. Each service type (e.g., PULSE, Base, GO Transit Connector, and rural) contributes differently to the DRT transit network, and each has unique minimum productivity targets. Route productivity varies based on the varying built environments in which each route operates. *Ridership standards are adjusted per DRT’s social equity initiatives to account for higher transit need in some areas—see Table 11. |
| Standard Name | Description |
|---|---|
| Service Frequency and Span of Service | DRT provides 24-hour transit service seven days a week in urban areas and service from 6 a.m. to 12 a.m. on weekdays and 7 a.m. to 9 p.m. on weekends in rural areas. The span and levels of service vary for each of the Demand Response zones and scheduled routes, which is based on customer demand. In the scheduled service network, the minimum service frequency is 30 minutes on urban routes and 90 minutes on rural routes. This scheduled service results in a customer waiting up to 15 minutes for a bus in the urban area and 45 minutes in the rural area. To ensure equity in scheduled service wait times, DRT deploys vehicles to ensure the time between a customer requesting a Demand Response trip and pick up achieves the following objectives: Urban areas: Customers will not wait more than 30 minutes for a pick up, with an average overall wait time of less than 15 minutes. Rural areas: Customers will not wait more than 60 minutes for a pick up, with an average overall wait time of less than 45 minutes. By 2025, all Demand Response customers, including current Specialized Services customers, will experience similar average trip wait times, including prebooked trips or trips scheduled in real time. The accommodated rate for trip requests made by eligible persons with disabilities will exceed 99.6 percent. |
| Service Proximity |
Service proximity means the walking distance between dwellings and the nearest bus stop. In the urban area, DRT aims to have:
|
Table 11. DRT’s social equity initiatives.
| Initiative Name | Description |
|---|---|
| Ridership Minimums in Priority Neighborhoods | The ridership productivity minimums influence the span and levels of service. The type of service and frequency planned for an area and shelter installations is based on ridership and boardings. For example, a bus shelter is considered at a bus stop recording 20 or more daily passenger boardings. In priority neighborhoods, recorded boardings and ridership will be increased by 50 percent to accelerate the deployment of bus shelters, moving from Demand Response to a scheduled service, and increase in service frequency during busier times of the day. For example, in a priority neighborhood, a bus shelter will be considered at a bus stop recording 15 or more daily passenger boardings. The ridership productivity guidelines for rural service already reflect a lower minimum average for boardings due to the lower density and greater distances traveled. |
| Service Design Guidelines | DRT leverages a monitoring framework to establish the type of service delivered (Demand Response or scheduled routes) and that the service is sustainable and efficient. |
| Transit Shelters | DRT will install shelters near locations such as retirement residences, hospitals, community centers, medical centers, and transfer stops. |
| Stations, Terminals, and Hubs | DRT’s Social Equity Guidelines will influence amenities and design at terminals by ensuring equity priority groups’ needs are met. Washroom designs will include gender-neutral facilities and spaces for infant changing and nursing. New initiatives will be implemented to improve access to electronic trip planning, information, and real-time information by considering Wi-Fi access through mobile devices, electronic customer kiosks, real-time information displays, and customer information lines. Wayfinding information will be improved and expanded, including the use of accessible formats. |
| Initiative Name | Description |
|---|---|
| Service Proximity |
A customer’s journey starts from their home, school, work, or other location and getting to the transit stop, hub, terminal, or station. Travel experiences will be improved by removing barriers and reducing distances to bus stops and hubs. DRT will work with regional and municipal partners to identify, address, and remove barriers to accessing transit services in their neighborhoods by:
|
Table 12. DRT’s transit equity measures.
| Measure | Description |
|---|---|
| Transit Assistance Program Average Fare per Participant | Tracks the average total fares paid by participants on a monthly basis compared to the total “value” of the trips taken to gauge affordability and/or usefulness for transit users with low incomes. The Transit Assistance Program (TAP) offers an unlimited monthly transit pass for eligible riders for $46.90 CAD per month. |
| Mobility Needs on Specialized Transit | Tracks the needs of each Specialized Transit (paratransit) customer, including use of mobility devices, support needed from drivers, and the presence of rider-provided attendants and trip purposes, to help DRT understand and account for riders’ needs over time. |
| Regional Connectivity | Checks the ability to travel from any location in the Region to a public transit mobility option in urban (900 square kilometers) and rural areas (2,200 square kilometers) of the DRT service area. |
| 24-Hour Urban Access | Checks that service gives access to transit within the service standards in urban areas any time of day on any day of the year. |
| On-Time Performance | Tracks whether the service provided adheres to the agency’s stated on-time performance standards. |
related to specific aspects of equity (e.g., availability of service in specific neighborhoods). Instead, the agency relies on its Social Equity Guidelines and Checklist to establish service that is inherently equitable throughout the Region.
Engagement and Responsiveness
DRT is kept abreast of community needs via multiple groups and engagement activities. The Transit Advisory Committee includes members from local cities within the Region, people with disabilities, and a dedicated equity advocate. This group meets three times per year to provide feedback to DRT about their plans for service. Via DRT’s UPass program, university decision-makers and student union representatives provide feedback on student needs. High school students with disabilities also have opportunities to gain work skills through the Project Search pilot program offered at the Region. DRT’s involvement in this program comprises providing travel training to participants, enhancing their independence, and making them more comfortable and confident in using public transit. DRT also hosts regular meetings with community partners and stakeholders, including dialysis patients, health professionals, children with developmental disabilities, groups that provide training and jobs for people with cognitive or developmental disabilities (DRT also supports these populations with travel training on a bus at their location), and targeted engagement sessions with specialized transit (paratransit) customers conducted in person and online. DRT’s customer service group works closely with community and social service organizations to facilitate access to fare products for people who either cannot afford transit or do not use smart phones by providing bulk passes via magnetic stripe paper passes. Similarly, DRT’s Transit Assistant Program offers reduced fares to people with certain income levels. This program is conducted in collaboration with the Regional Municipality social services department’s client teams (these groups conduct process applications and verify income).
Feedback from all groups is provided to the transit agency’s service design group so that they can integrate it into service planning. One example of the impact public feedback has had on DRT’s service is the recent change to the Transit Assistance Program. This program was initially envisioned as a fare capping program in which riders would pay per trip until a certain threshold was reached, at which point all further trips within the month would be “free” because the rider had spent enough money to obtain a pass product valid for unlimited travel. However, DRT learned multiple things about this program after conducting a program evaluation: Passes cannot be used on connecting services; therefore, people expressed that they were not getting as much value from the investment as they could, and users found the concept of fare capping confusing. Therefore, the transit agency shifted to providing a discounted monthly pass that users can choose to purchase at any time and receive unlimited trips on DRT and participating connecting agencies. Additionally, user and stakeholder feedback helped the agency develop both the Social Equity Guidelines and Service Guidelines, which resulted in more frequent service in priority neighborhoods and the introduction of 24-hour service throughout the Region every day of the year.
Planning, Programming, and Operations
As mentioned in previous sections, DRT’s Social Equity Guidelines and Service Guidelines mandate a minimum level of service throughout the Region, which dictates how service is planned and implemented. Additionally, the service must meet the following minimum equity-related requirements as presented in the Service Guidelines (these guidelines are also used to conduct ongoing service monitoring to ensure service reliability and availability):
- Scheduled routes will not operate at headways longer than 30 minutes nor for periods of the day shorter than three hours.
- Route performance will be regularly evaluated for modification, expansion into new service areas or service periods, or service reduction or transition to or from Demand Response.
- The span and level of service will be adjusted based on the customer demand for each route.
- Customers will not wait more than 30 minutes for a pickup in urban areas, with an average overall wait time of less than 15 minutes.
- Customers will not wait more than 60 minutes for a pickup in rural areas, with an average overall wait time of less than 45 minutes.
- By 2025, all Demand Response customers, including current Specialized Transit customers, will experience similar average trip wait times, including prebooked trips or trips scheduled in real time. The accommodated rate for trip requests made by eligible persons with disabilities will exceed 99.6 percent.
- At peak travel times, vehicle loads will not exceed 150 percent of the vehicle’s seated capacity.
- In the urban area, DRT aims to have:
- Dwellings within a 500-meter walk of a bus stop: 80 percent, and
- Dwellings within an 800-meter walk of a bus stop: 95 percent.
- In the rural area, 100 percent of dwellings will be served by Demand Response at the curb (such as the entrance to a property).
- Customers who are eligible for Specialized Transit are provided an accessible door-to-accessible-door trip based on their eligibility. Customers with unconditional eligibility will receive trips using only Demand Response service. Customers with conditional eligibility may receive trips that include travel on a combination of Demand Response and scheduled service.
Despite DRT’s well-rounded transit equity approach, its staff identified two areas of opportunity for them to accomplish more. First, the staff hopes to increase the agency’s engagement with priority communities and equity groups and their participation. DRT is launching an ambassador program to work on such engagement. Second, the staff hopes to deploy service enhancements in priority neighborhoods more quickly; however, this requires additional revenue service hours (above and beyond those already planned for growth areas), delay management strategies, and reduction in pressures on other parts of the agency’s service.
Funding and Financing
As a department within the Regional Municipality of Durham, much of the funding for DRT services comes from property taxes, with the rest consisting of funding from fares, gas tax revenue, and reserve funds. In 2022, transit service accounted for 9 percent ($264 million) of the Region’s total budget. In March 2023, the Regional Council approved a 10-year Transit Service and Finance Strategy that includes growth in revenue service of 5–10 percent each year. Service growth is emphasized within regional spending priorities, which specifically helps to address DRT’s transit equity commitments, but transit equity is not identified as a specific line item within approved budgets (DRT 2023a).
Data Collection and Management
DRT staff provided detailed information about the equity-related data the agency collects, including the frequency of data collection and the level of granularity of each data set, as shown in Table 13. DRT staff also outlined the data the transit agency does not currently collect but that are available, as shown in Table 14. DRT employs a dedicated data scientist in the role of Program Manager for Data and Analytics.
When discussing the opportunity to use existing data or performance measures in a new way that could tell a story about their riders, DRT staff suggested a few ideas. Trip data with origins and/or destinations could help data users understand complete customer journeys as well as service
Table 13. DRT data, collection frequency, and granularity by data set.
| Data Type | Collection Frequency | Granularity |
|---|---|---|
| Ridership | Daily |
|
| On-Time Performance | Daily |
|
| Customer Service | Daily |
|
| Service Availability | Daily |
|
| Bus Video Footage | As required |
|
use patterns. Customer complaints or requests can be helpful to understand which needs existing service is not currently meeting or highlight equity or accessibility pain points, such as stops with poor wheelchair access or neighborhoods that feel their service is insufficient for their needs or comparable with adjacent neighborhoods. Demographic data could help identify needs, challenges, and perspectives according to rider subsets (e.g., women of color or people with disabilities who have low incomes).
Lessons Learned and Challenges
DRT staff suggested that accessibility improvements (both in terms of supporting people with disabilities and providing service throughout the Region) help everyone and do not cater only to specific groups. This lesson helps with buy-in for transit investments. Additionally, DRT is structured so that the Change Management Group (responsible for leading much of the equity efforts) and Eligibility Office (responsible for reviewing Specialized Transit applications) report directly to the General Manager, which helps establish equity as a part of the culture instead of simply a box to check or a performance measure to watch. This structure also helps DRT make equity part of everything the agency does, from hiring to the design of bus wraps.
Table 14. DRT data not collected.
| Data Not Collected | Reason Not Collected, per Agency |
|---|---|
| Service Demand |
|
| Customer Demographics (for segmentation) |
|
| Customer Satisfaction (detailed quantitative & qualitative) |
|
One of the challenges DRT has faced recently is the need to continue growing the amount of service the agency operates to meet the needs of the growing region; due to expansion of residential development into new areas, the agency cannot grow fast enough. Because of the transit agency’s specific commitment to provide 24-hour transit service in urban areas and nearly 24-hour service in rural areas, new residential developments require additional routes and/or Demand Response transit services.
Summary
Key Challenges
- Regional Growth. As the Region grows and new residential areas are developed, DRT is challenged by the need to provide additional transit services in new areas to adhere to service standards.
- Large Rural Service Area. A large portion of DRT’s jurisdiction consists of low-density rural areas. Providing effective transit services in these areas is difficult for any transit agency, and DRT is especially challenged by its commitments to lengthy spans of service seven days a week and to ensure riders in rural areas “will not wait more than 60 minutes for a pick up, with an average overall wait time less than 45 minutes” (DRT 2023b).
Notable Practices
- Comprehensive Approach to Transit Equity. Instead of targeting certain aspects of transit service (e.g., on-time performance or affordability) or service in certain areas (e.g., additional service in an area of high need), DRT works to ensure that everyone, throughout the service area, has useful access to transit (e.g., within an easy walk via safe infrastructure, short headways, and late-night service). To best serve priority areas, DRT applies weighting factors to further improve service in these neighborhoods.
- Regionally Identified Priority Neighborhoods. The Region’s public health department led the process to identify priority neighborhoods (defined as areas of the region that require “focus to build on health and well-being”), which have the lowest income levels in the Region, as well as lower adult education levels and higher unemployment rates. Instead of conducting its own analysis on which areas of the Region to focus its equity initiative on, DRT used the existing priority neighborhoods to inform transit equity efforts. This decision leverages work from other departments in the Region while also contributing to a cross-sector solution.
Lessons Learned
- Accessibility Helps Everyone. DRT has learned that transit accessibility—accessibility for people with disabilities and accessibility throughout a region—helps everyone in the community by improving service for all while also reducing public costs associated with unemployment, limited access to healthcare, and social isolation.
MBTA
Since 2009, MBTA has been a division of MassDOT. The transit agency provides service to around 200 cities and towns in the Greater Boston metropolitan area, Eastern Massachusetts, and parts of Rhode Island (MBTA 2023a). The MBTA Board of Directors includes the Secretary of Transportation for MBTA, a member with municipal government experience, and five other members appointed by the Governor of Massachusetts. MBTA is overseen by the MassDOT Board, which has 11 members, all appointed by the Governor, and serves as the governing authority for the agency (MBTA 2023b).
MBTA directly operates service for three heavy rail lines, two light rail lines, the Silver Line bus rapid transit and trolleybus service, and some of its MBTA bus local and express fixed route service.
Table 15. MBTA service summary.
| Operating Statistic | Total |
|---|---|
| Service Area Size (Sq Mi) | 3,244 |
| Service Area Population | 3,109,308 |
| Modes Operated | Bus, BRT, Commuter Rail, Demand Response, Ferry, Heavy Rail, Light Rail, Trolley |
| Annual Unlinked Trips | 120,951,784 |
| Annual Vehicle Revenue Miles | 79,972,611 |
| Annual Vehicles Revenue Hours | 5,887,367 |
| Operating Expenses by Revenue Source | |
| Fares and Directly Generated | $ 220,114,223 |
| Local Funds | $ 177,860,534 |
| State Funds | $ 533,925,193 |
| Federal Funds | $ 933,023,661 |
| TOTAL | $1,864,923,611 |
| Operating Expense per Trip | $12.96 |
Data Source: National Transit Database 2021.
Image Source: TTI.
The transit agency’s remaining MBTA bus service and all services for the MBTA boat (five ferry routes), MBTA Commuter Rail (13 lines), and the RIDE ADA complementary paratransit service are purchased from other providers.
MBTA offers an alternative service available to ADA paratransit customers called the RIDE Flex, in which customers can choose to take a trip through local for-hire ride services in the program in lieu of scheduling a paratransit trip on the RIDE; MBTA subsidizes up to $40 for each trip after the customer pays the first $3 to the trip provider. MBTA also operates around 100 parking lots and garages across its service area (MBTA 2023c).
Table 15 presents a summary of MBTA’s 2021 performance, and Figure 3 is a snapshot of the transit agency’s service area.

MBTA and MassDOT were chosen as a case example because of their collaborative equity analysis work between different departments within a state agency and emphasis on going beyond federal requirements to collect meaningful information related to service equity. The agency developed a rolling rider census update process and uses those data to inform several aspects of service planning across its work. The agency also employs special data collection efforts to better understand the rider experience, targeting hard-to-reach populations as an important emphasis area in data collection and analysis.
Agency Definition of Equity
MBTA and MassDOT do not currently have an adopted definition of equity, even as the larger agency considers equity in many of its efforts. MBTA has a pending equity definition currently under review for inclusion in the transit agency’s strategic planning process. MassDOT recently offered an equity definition for approval as part of its draft long-range plan (which is in the process of being vetted along with the equity definition). This definition aims to be consistent with the environmental justice definition used by the Massachusetts Executive Office of Energy and Environmental Affairs (EEA). MassDOT’s approach considers how equity is dynamic and not the same thing for all groups of people or from year to year. The agency instead focuses on how its efforts can be seen through an equity lens. MBTA and MassDOT also look to the Boston MPO and their discussion on how the evolution of their equity definition should include both current and historical disparities in equity (i.e., remedying historical inequities through a level of proactiveness).
Adoption of Equity Effort
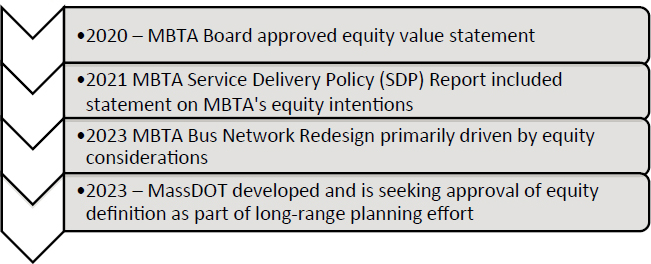
MBTA staff provided a value statement approved by the MBTA Board of Directors in 2020 on equity:
We commit to prioritizing the needs of our transit-dependent riders, our employees, and the economic regions we serve in decision-making processes to eliminate unjust and unintentional disparities.
MBTA’s 2021 Service Delivery Policy (SDP) Report (MBTA Fiscal and Management Control Board 2021) states that with respect to equity:
The MBTA strives to improve access to opportunities and service quality for transit critical populations, including low-income people, people of color, seniors, people with disabilities, and those in low- or no-vehicle households.
MBTA’s Bus Network Redesign (BNRD) Final Report (Better Bus Project 2023), which discusses equity considerations as the primary driver for the project, includes the following definition of equity:
Equity is defined as improving access and quality of service for transit-critical populations: low-income populations, people of color, seniors, people with disabilities, or people who live in households with few or no vehicles.
Institutional Structure and Governance
The creation of MassDOT in 2009 combined several agencies in the Commonwealth of Massachusetts under one umbrella in an effort to combine several aspects of more administrative work. Services shared between MBTA and MassDOT include the Office of Performance Management and Innovation (OPMI), Office of Transportation Planning (OTP), Office of Diversity and
Civil Rights (ODCR), and legal and clinical services. As a result, MBTA and MassDOT have a number of individuals who are engaged in research and performance measurement, working together and sharing resources as needed between the division (MBTA) and the parent agency (MassDOT). Relevant groups for MBTA include its strategic research team and the policy and transit planning team. OPMI and OTP work together on several performance measurement efforts. Different teams within MassDOT divide up their work between MassDOT and MBTA in different ways, but no one employee is fully employed within a single agency.

OPMI (reporting to the MassDOT Chief Administrative Officer) is focused on performance measurement, data, and research; the office has the ability to leverage work across the Commonwealth of Massachusetts (e.g., surveying work on tolling programs, vehicle census information). OTP (reporting to the MassDOT Undersecretary) works with different modal divisions within MassDOT at their request while triangulating with OPMI on data and metrics works; OTP often provides planning resources to other divisions that do not have their own. MassDOT also has a Rail and Transit Division, which collaborates with smaller rail agencies in the Commonwealth of Massachusetts. Sometimes offices within MassDOT will negotiate who is leading and collaborating on which projects. MassDOT’s State Planning and Research (SPR) funding is allocated through an internal solicitation between all their offices to figure out how the funding will be used.
MassDOT offices are also able to collaborate on requests from places outside of Boston through relationships developed over time between different groups and overlapping focus areas. For small transit operators outside of Boston looking for access to services and tools at MassDOT, most requests are routed through the Rail and Transit Division (which manages and liaises with the regional transit authorities outside of MBTA). An example of a current project is a statewide transit accessibility and service coverage tool to examine travel behavior and access to critical destinations for key demographics.
Current and Potential Indicators
MBTA and MassDOT do not have set targets attached to their equity goals. One of the agency’s concerns in target setting is that issues can still be present even if targets are met, making the previously set targets less meaningful in achieving equity. MBTA prefers to perform checks on service equity performance rather than setting targets to track changes over time and obtain an ongoing understanding of the differences in people’s lived experiences.
MBTA staff noted that fare equity can be challenging to calculate because FTA does not allow transit agencies to project out how the service change might change the demographics of ridership, as the analysis must assume that the demographics will remain static. However, in cases when a service change transforms the ridership of the service, the actual equity impacts could be significantly different than the analysis would capture.
MBTA’s latest rider survey information showed that the number of transit riders who self-identify as a minority increased from 34 percent in 2016 to 58 percent in 2022, while the number
of riders from low-income households likewise increased from 29 to 48 percent over the same period (OPMI 2023b).
Target Setting and Recent Performance
MBTA’s SDP, which is prepared by OPMI, is an example of how the transit agency uses some rudimentary measures of targets for service delivery across its system; these measures include measurement of impacts for the number of riders of color or low-income riders. The SDP sets how MBTA evaluates service quality and allocates service to meet riders’ needs, including objectives that define key performance characteristics (including equity), quantifiable standards for meeting those objectives, an outline of the service planning process (along with minimum levels and targets), and process for public involvement (MBTA 2023d). The SDP Report includes equity principles woven into some measures; for example, the description of frequent coverage measurement states that frequent service is prioritized (in addition to other factors) in areas with high proportions of people most likely to rely on transit.
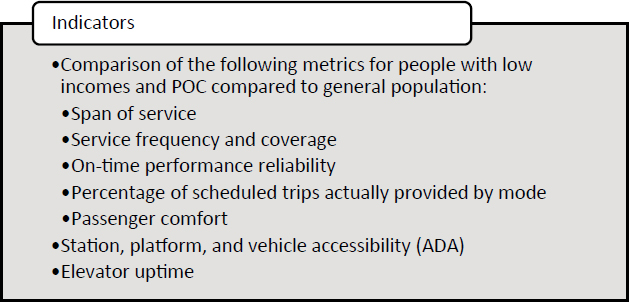
In the SDP analyses, MBTA calculates a scorecard of equity data from the rider census for each metric. Results on the scorecard are intended to represent a snapshot in time for that metric. Figure 4 shows an example from the Fall 2022 SDP of the performance measured for the frequency of service according to effective wait times relative to established standards; the table compares the performances for overall riders, low-income riders, and riders of color (OPMI 2023d). The report tables depict whether the performance for a given measure has improved or worsened compared to the previous report period. The measures included in the report are defined as follows:
- Span of Service – the percentage of riders on routes who were scheduled to meet or surpass their expected hours of operation.
- Frequency of Service – the percentage of riders on routes who were scheduled to meet or surpass their expected frequencies throughout the day.
- Base Coverage – the percentage of the population who lives within a half-mile of any MBTA service in the MBTA service area.
- Frequent Service Coverage – the percentage of the population who lives within a half-mile of frequent MBTA service in areas that either have a high combined population and employment densities or have a moderately high combined population and employment densities along with above-average proportions of low-income and low-vehicle households.
- Station Accessibility – the percentage of ADA-accessible MBTA stations.
- Elevator Uptime – the percentage of total elevator-hours in which elevators are operational.
- Platform Accessibility – the percentage of total platform-hours that are ADA-accessible via elevators.
- Vehicle Accessibility – the percentage of trips the MBTA provides with at least one ADA-compliant vehicle (applicable to the Green Line only).

- Reliability – the percentage of passengers on routes who pass on-time performance tests.
- Service Operated – the percentage of scheduled trips actually provided for each mode of service.
- Passenger Comfort – the percentage of passenger travel time experienced in comfortable conditions.
Engagement and Responsiveness
MBTA uses its rider census information (along with ridership data) to help inform the agency’s outreach programs. For the Massachusetts Household Travel Survey (MHTS) and People & Transportation Project, MBTA has partnered with local organizations to collect information reflecting the lived experiences of using transit through community-based participation research.
The MHTS effort follows recent best practices identified from other states as they launch MPO or statewide surveys. MassDOT looks at how they can provide incentives for non-traditional participants to take part in the survey and ensure that the survey is available in all languages and formats needed by potential participants. For the rider census updates, the survey is made available in 12 languages (OPMI 2023a).
MassDOT hired a polling firm to conduct door-to-door and intercept surveys along with focus groups for the People & Transportation Project, which will include collaborating with community members to perform the moderation and data collection work. Staff stated that no goals are in place for what kind of information results from these efforts as long as it is reflective of people’s experiences. The agency wants to leave the decision-making to its community partners regarding what they feel are important things to capture so that the agency in turn can interpret those findings as important as well.
The BNRD project began with an analysis of location-based services (LBS) data to generate an initial draft high-frequency route network (as well as non–high-frequency routes), which was then refined through a series of design workshops and public feedback (Better Bus Project 2023). LBS data were appended with information showing which trips were taken by individuals belonging to ethnic minority groups or low-income households. Demographic data from the agency’s Title VI policy definitions were also added. Figure 5 shows the process from the project’s final report.
Planning, Programming, and Operations
MBTA has adapted its rider census information to transcend the required update every 5 years and instead evolve into a rolling annual rider census. This change was implemented to have better, more updated information on their riders; this change also helps the transit agency avoid relying

on outdated information when rolling out new services. Work from the rider census shows that some data characteristics (such as demographics of census blocks) are not necessarily reflective of people in the region and their usage of public transportation. The survey results help inform the transit agency’s Title VI equity analyses, capital planning, service planning, fare policy, and public outreach planning (OPMI 2023b).
As the transit agency pursues other survey efforts as well, the rider census helps in ground truthing for drawn conclusions in other analyses. Underlying demographic information helps the agency weight information collected elsewhere; an example is customer satisfaction information weighted based on demographics (OPMI 2023a). MBTA has found weighting to be a better practice to avoid information from more affluent communities or with higher rates of participation drowning out information from communities with a higher transit need. OPMI has worked with capital planning teams in MBTA through rider census data to help provide information on prioritizing needs in capital projects.
The MHTS’s scope for consultants includes a required sampling plan that describes households’ and individuals’ requirements to provide survey responses, emphasizing a focus on hard-to-reach populations and correcting any nonresponse bias. Examples of these biases include limited English proficiency populations, environmental justice, and other equity-focus communities (OTP 2023a).
The People & Transportation project scope discusses OTP’s interest in information about recurring challenges, burdens, and opportunities for people who travel in the Commonwealth of Massachusetts. The goal of the project is to gather primary source data on people’s interactions with the transportation network to inform topic areas such as trip purpose, cost, mode preferences, barriers to accesses, and burdens from infrastructure and service quality. Consultants are expected to partner with a non-profit community-based organization that advocates “on behalf of the population group” (OTP 2023b).
MBTA is now close to implementing its BNRD project; much of the equity work for the project was done during the initial planning process. MBTA used data to help back up anecdotal evidence about key areas and destinations in need of transit service. The transit agency noted that public response on proposed changes could sometimes conflict with the best possible solution for achieving better service equity; for instance, some of the proposed route changes were ultimately reverted to status quo in the final redesign plan (as opposed to being a clean slate redesign).
The executive summary of equity and Title VI findings from the BNRD states that the project focuses on prioritizing new bus services and resources for low-income riders, riders of color, people without easy access to a vehicle, older adults, and riders with a disability; this includes 50 percent of new bus services going to minority populations and 39 percent going to low-income populations (Antos and Povish 2022). The BNRD analysis used the travel-demand data of these key ridership groups to prioritize additional service investments by weighting the populations more heavily in the analysis inputs.
Funding and Financing
Staff noted that if federal funding is involved in the project, then the agency is bound to the requirements on measuring equity performance. However, if federal funding is not involved, then MassDOT has some flexibility on procurement within the allowance of the Commonwealth rules. For example, the Commonwealth added LGBTQIA+ and disability categories to its standard diversity, equity, and inclusion (DEI) requirements. While the agency’s focus on equity is on rider experience, improved equity with respect to personnel and procurement is also helpful toward these efforts. MassDOT’s SPR funding is allocated through an internal solicitation between all its divisions to figure out how the funding will be used.
Data Collection and Management
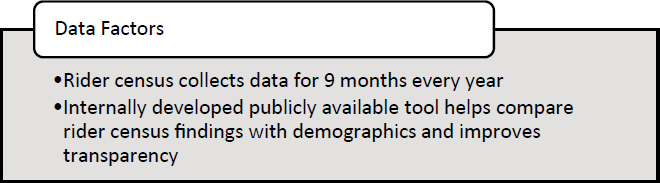
MBTA uses the rider census effort to capture ridership as it stands for most of the year during periods of regular service. For the rolling rider census updates, MBTA collects data in the field for approximately 9 months (typically March through November) to avoid the winter weather season when riders are less willing to participate (OPMI 2023b). The break-in data collection also helps the transit agency have built-in time to release the new data set and start back up the next year.
OPMI developed an online tool (named the MBTA System-Wide Passenger Survey Interactive Web Tool) that displays information from the rider census according to given categories. The tool includes passenger survey information for different fixed-route service modes and information from several measures (including race, ability to understand English, fare product, gender, ethnicity, household income, Title VI categories, and usable cars) (OPMI 2023c). The tool is available to the public, and data can be downloaded as desired; OPMI determined that the online tool would help increase transparency and reduce the time it takes to respond to public data requests.
Lessons Learned and Challenges
While minimum federal requirements can be very prescriptive and limiting, MBTA staff noted that it is beneficial to have federal requirements in place to force agencies to do something that otherwise would not happen. MBTA has found that some requirements help engage staff across the agency in equity conversations.
MBTA staff noted that equity work in projects like the SDP uses federal types of categories even if the analysis is not federally required. The agency has discussed terms used in these categories and whether the given terms are nuanced enough in the framing of language.
Summary
MBTA and MassDOT monitor performance indicators related to equity over time as an approach rather than using a target-setting approach to determine whether equity goals have been achieved. The agency’s data collection efforts and projects emphasize equity as the primary driver of its effort to learn more about barriers to transportation service and the lived experiences of riders. Agency staff collaborate together on several data analyses and planning efforts as a result of MassDOT’s structure in sharing staffing roles between the larger agency and divisions within the agency.
Key Challenges
- Implementing Findings. The results from the data analyses and planning projects that indicate the best potential solution to improve the equity of service can sometimes run into barriers to implementation due to public response to concern about service changes.
- Equity Definitions. MassDOT and MBTA do not have a single driving definition of equity that is used across agency efforts because the number of groups within the larger agency. Another similar challenge can be moving beyond federal definitions of equity categories that may not service local purposes most effectively.
Notable Practices
- Data Recency. MBTA increased its rider census efforts from the required 5-year period, transforming the data collection to a rolling annual effort that provides more recent and relevant
- Tool Development. The Service Delivery Policy reports, and the interactive web-tool produced by MBTA, provide transparent information and resources to the public on regularly updated equity-related data.
information on riders; this process helps ensure the data are useful for various planning efforts and applications from MBTA and MassDOT.
Lessons Learned
- Internal Collaboration. Staff within MassDOT work collaboratively on various projects affecting MBTA or other transit providers in the state based on expertise and capacity; the agency developed this approach over time to navigate the complexity of resources and overlapping efforts across divisions.
- Monitoring Indicators. Due to past experiences at the agency, staff are hesitant to set targets to avoid a perception of “achieving” equity; conversely, the agency monitors performance indicators (through a scorecard approach) to understand the extent to which MBTA is achieving service goals.
Metro Transit
![]()
Metro Transit has been a division of the Metropolitan Council in the Minneapolis-Saint Paul region of Minnesota since 1994 (Metropolitan Council is the MPO for the region). In addition to fare revenues and federal grant funding, this transit division receives state motor vehicle sales tax and state general fund revenues. Metro Transit provides local fixed-route bus (47 routes), express route bus (71 routes), bus rapid transit (five lines), light rail (two lines), and commuter rail (one line) service to the region (Metro Transit 2022b); the division also recently started a microtransit pilot program in September 2022 called “micro” for a zoned area in Hennepin County (Metro Transit 2023d). Metropolitan Council provides ADA paratransit service (Metro Mobility, n.d.).
Table 16 presents a summary of Metro Transit’s 2021 performance, and Figure 6 is a snapshot of the transit agency’s service area.
Metro Transit was chosen as a case example because of the transit agency’s multiple years of experience with equity measures and dedicated team of data scientists who were available to work
Table 16. Metro Transit service summary.
| Operating Statistic | Total |
|---|---|
| Service Area Size (Sq Mi) | 492 |
| Service Area Population | 1,731,667 |
| Modes Operated | Bus Commuter Rail Light Rail |
| Annual Unlinked Trips | 32,861,129 |
| Annual Vehicle Revenue Miles | 24,598,887 |
| Annual Vehicles Revenue Hours | 2,100,770 |
| Operating Expenses by Revenue Source | |
| Fares and Directly Generated | $34,879,635 |
| Local Funds | $31,315,867 |
| State Funds | $ 311,787,935 |
| Federal Funds | $34,841,540 |
| TOTAL | $412,824,977 |
| Operating Expense per Trip | $12.49 |
Data Source: National Transit Database 2021.
Image Source: TTI.

on the development of the associated methodology. The transit agency’s equity performance measure process and methods were heavily influenced by responses to specific feedback from the public regarding the quality of bus stops and other amenities and formal data requests from the American Civil Liberties Union to disaggregate fare enforcement data by race, offering an example of an approach that external stakeholders have scrutinized since its inception.
Agency Definition of Equity
Metro Transit’s approach to equity was also significantly influenced by public input that highlighted inequity in service provision. Similarly pushed by external pressure, Metro Transit pioneered service equity analysis techniques in the context of the Title VI program. The agency was also early among transit agencies to recognize that avoiding disparate impacts was not enough to drive equity in service design and delivery. As such, the transit agency’s way of explaining its approach to equity highlights specific communities and explains how it will address their needs. Instead of a definition of transit equity, Metro Transit adopted a Transit Equity Statement in 2022 (https://www.metrotransit.org/TransitEquity) (the following statement is specific to Metro Transit and does not apply to the Metropolitan Council (of which Metro Transit is a division, as described in the following section):
Metro Transit acknowledges that providing safe, affordable, and reliable transportation increases opportunity. Transit services and programs should be built to equitably benefit all, especially under-served communities, including BIPOC, low-wealth, women, people with disabilities, LGBTQ+, youth, and older adults. Transit equity requires identifying and addressing injustices and building actionable pathways to create a fair and more just future.
Metro Transit understands that transit decisions can impact the ability of under-served communities to find and keep jobs, reach medical care, access educational opportunities and affordable housing, and develop and maintain social
connections, among other impacts. Transit services and investments can reduce spatial inequalities that contribute to racial, environmental, and economic disparities.
Metro Transit has an essential role and responsibility to examine all decisions impacting our region’s access to quality transit, reduce existing disparities, and prevent further inequities by:
- Reviewing and revising policies,
- Seeking partnerships with other responsible institutions, and
- Improving planning and operational practices.
To support this statement, Metro Transit also provides “Key Definitions” on its website so that people reading the statement understand what it refers to [these definitions are specific to Metro Transit and do not apply to the Metropolitan Council (of which Metro Transit is a division, as described in the following section)]. These definitions are as follows:
Under-served communities: Local communities that have been historically excluded from transit decision-making and benefits while carrying disproportionate burdens.*
BIPOC: Black, Indigenous, and other People of Color.
Disability: Includes people with physical, sensory, emotional, and cognitive disabilities, and those with chronic/severe illness. We understand the experience of disability to occur within any and all walks of life, with deeply felt connections to all communities impacted (adapted from Sins Invalid Organization’s mission).
Inequities: When a group or an area is serviced, represented, and/or invested greater than another group or area based on access, power, and/or privilege.
Spatial inequalities: The unequal amount of resources and services that can be accessed depending on the area or geographical location.
*MnDOT: Advancing Transportation Equity Initiative focuses on communities: (1) Underrepresented in transportation processes; (2) Experiencing known inequities in access or outcomes; (3) With unique transportation needs not well served by a business-as-usual approach.
Institutional Structure and Governance
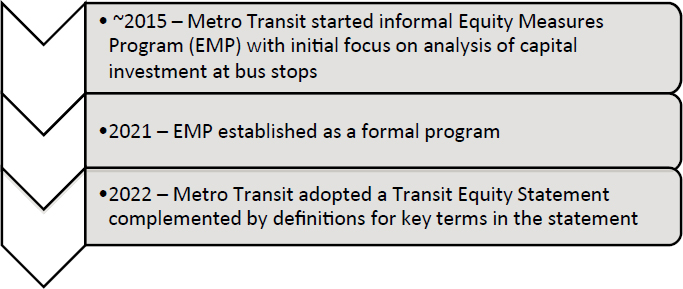
Metro Transit is the largest division of the Metropolitan Council, with multiple programs or groups touching on performance measurement and service equity. Metro Transit started the Equity Metrics Program (EMP) informally about 8 years ago. An early project focused on an analysis of capital investments at bus stops. The product of that analysis, the Better Bus Stops program, resulted in changes in public engagement practices, priorities in how the division assigns available resources, and new commitments to performance measurement that measure metrics across specific groups (e.g., race, income, or neighborhood). The EMP was established as a formal program in fall 2021 to continue the division’s commitment to transit equity (Metro Transit 2021).
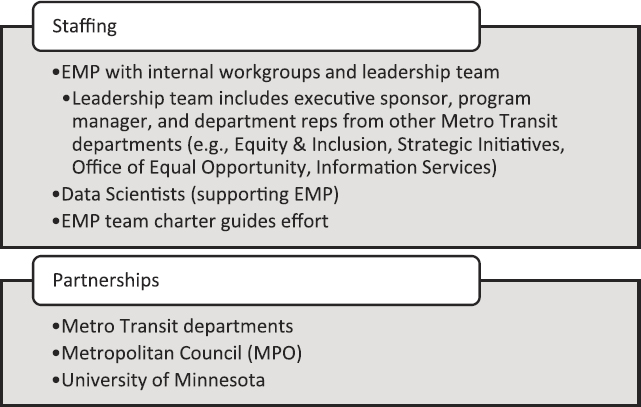
The EMP consists of a leadership team and a set of internal workgroups involved in equity metrics work. The leadership team includes an executive sponsor, program manager, and key departmental representatives from other departments in Metro Transit (e.g., Equity & Inclusion, Strategic Initiatives, Office of Equal Opportunity, Information Services) as well as room for external partner representatives. The leadership team reviews and guides equity metrics and their targets and guides conversations with other stakeholders about the metrics (Metropolitan Council 2021b). The EMP’s data scientists work on developing a methodology around equity metrics; this methodology includes measurements with disaggregation by race using American Community Survey (ACS) data.
The Better Bus Stops program was an outgrowth of the Engineering and Facilities group, and Strategic Initiatives also continues to work in service equity analysis. Metro Transit’s Equity and Inclusion Team and EMP look at metrics from various programs (e.g., Better Bus Stops) and program evaluations on an ongoing basis to identify metrics that help the division understand the equity impacts of service and investment planning. The team has a charter that outlines their purview and has been developing goals and associated metrics in assessing equity in Metro Transit employment.
Current and Potential Indicators
As previously noted, an early application of Metro Transit’s equity methodology was developed with regard to measuring the infrastructure at bus stops, aiming to measure the quality of the bus stop experience for riders. The division found that the demographic data from onboard surveys were not sufficient on their own as a tool to measure service equity across the network. Therefore, the methodology incorporates ACS data and is designed to be applied to any performance indicator that can be measured at the transit stop level. Examples include on-time performance, headway reliability, frequency, and span of service.
The Better Bus Stops capital project initially began in 2014 with the goal to add shelters at 150 bus stops and improve 75 additional bus stops with better shelters and pedestrian access (Metro Transit 2017). As of 2021, data from the program show that people of color (Metro Transit uses the term BIPOC) have access to shelters, light, and heat (temperatures in the service area can be below zero) at bus stops at rates similar or higher than the Metro Transit system average (see Figures 7 and 8) (Martina, Dungca, and Farrington 2023) (Farrington, Fisher, and Broughton 2022).
Metro Transit’s methodology looks at walkshed distances around bus stops to measure and then aggregate demographics of potential riders across multiple stops of the bus route. The first step is generating walksheds around the stops at 5-, 8-, 10-, and 12-minute intervals (walk time). Then, staff determine the proportion of the census block group in the walkshed to determine the demographics of potential riders according to ACS data. The population of each race in the block group is scaled by the area of the block group within the walkshed; this gives the team an estimated population of who has access to the service at the given bus stop (Metro Transit 2022a).


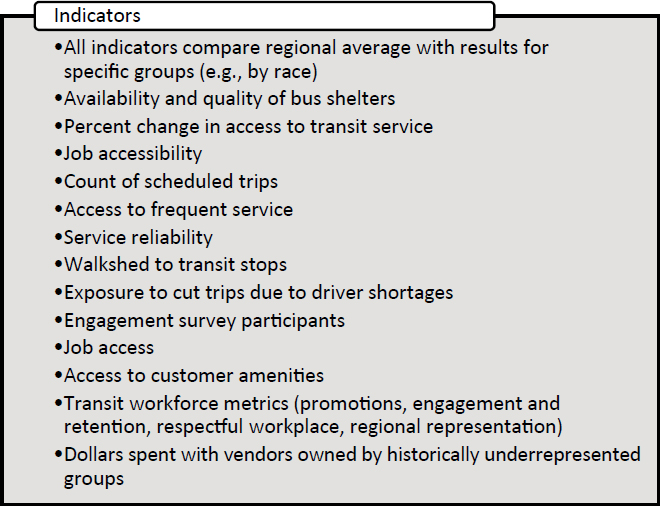
Figure 9 presents an example of the methodology’s proportional estimation of population groups with a transit stop walkshed based on area-weighted interpolation. Figure 9 also shows three Census block groups (noted by the numbers 1, 2, and 3). The Metro Transit logo in the middle notes the location of the bus stop, and the blue polygon area around the logo is a measurement of the walkshed. In Block Group 1, 50 percent of the area is covered by the walkshed, while the other 50 percent is not. This 50 percent coverage is multiplied by the 100 residents of color estimated within Block Group 1, resulting in a weighted estimate of 50 such residents within the walkshed (Martina and Dungca 2022). Metro Transit also averages access for stops with overlapping walksheds and then aggregates them at the route level so that resident access levels are not counted multiple times in the process (Reid 2020).

Metro Transit looks at key performance indicators (KPIs) for equity metrics on an annual or quarterly basis; these metrics include measures in the areas of service, customer amenities, workforce, purchases, and engagement (Martina, Dungca, and Farrington 2023). The same KPIs are published as part of the division’s Annual Service Equity Evaluation Report. The July 2023 presentation on these KPIs showed that more Metro Transit trips are being provided to residents who identify as Black or Native American (compared to the regional average); a larger percent of residents who identify as Black, Native American, or Hispanic have access to high-frequency service; and more jobs are accessible by transit to residents who identify as Black, Native American, Asian, or Hispanic. Conversely, during fall 2021, Black and Native American residents were more likely to live near stops with cut trips due to transit workforce shortages (Martina, Dungca, and Farrington 2023).
Metro Transit produces annual Equity Metric Reports to track the progress of system accessibility (to destinations such as jobs), access to frequent service, passenger time spent in buses with standees, service availability, and on-time performance. The annual reports vary over time due to the areas of interest for that particular year.
- The Accessibility Equity Report found that according to the 2020 schedule (using GTFS data), job accessibility was higher for residents of color compared to White residents because of the concentrations of jobs and populations near downtown. The report also found that similar accessibility patterns across service types and days of the week (Reid and Dungca 2021).
- The Access to Frequent Service Equity Report found that according to 2018 ACS data, 27 percent of residents of color could walk to high-frequency transit compared to 16 percent of White residents due partially to the concentration of frequent service lines in downtown areas. The report notes that the metric only measures access rather than actual ridership (McKnight, Reid, and Dungca 2021).
- The Passenger Time Spent in Buses with Standees Equity Report found that by comparing the differences between fall 2019 and 2020, routes serving a higher proportion of riders of color had more time during service when people were required to stand due to high ridership compared to routes serving predominately White riders; this analysis used automatic passenger counter (APC) data to determine bus loads and standee times (Ditmer and Dungca 2021b). Showing the flexibility of this type of metric, the transit industry applied similar analyses to assess which vehicles exceeded COVID-19-related capacity levels and showed that people of color experienced a disproportionate risk of their vehicles being over the “safe” limit for riders.
- The Service Availability (Trip Count) Equity Report found that Black and Native American residents have higher average access to weekday trips (both above 60 trips) compared to White residents (51 trips) (Whited and Dungca 2021).
- The On Time Performance Equity Report found no evidence of disparities according to race in OTP based on walksheds to transit stops and timepoints data (Ditmer and Dungca 2021a).
The EMP team has also completed one-off studies for other projects at Metro Transit as needed. One example is an analysis for the Orange Line bus rapid transit service; the team worked with service planners to run service scenarios and an access to opportunity analysis on how well riders could reach key destinations (e.g., education, jobs) in 30 minutes by transit. The results were disaggregated by race and led to changes in the service plans. The team has found that service planners in the division want to continue to use these kinds of perspectives for other planning projects. This kind of work does require some customization in the analysis and multiple months of lead time to accomplish.
Target Setting and Recent Performance
Metro Transit finds target setting important in measuring performance because targets help the division define success so stakeholders can see both the performance and the agency’s definition of equitable service in practice. The EMP aims to apply a consistent and transparent methodology for
performance measurement efforts across the agency by disaggregating metrics by race and setting targets and goals for performance to improve agency accountability (Metro Transit 2021). Although the division has struggled to develop meaningful targets across all services, it is committed to equity in infrastructure at bus stops (including implementing bus shelters, heat, and lighting at all stops). Metro Transit uses the same analysis methodology for bus stop improvements to ensure the division is not contributing to any greater service disparities with service planning efforts.
The EMP has also created an Equity Metric Template, which is used to set up standards for equity performance measurement; the template can also be used by different groups in Metro Transit to help determine how to measure equity for their specific functional area using a consistent methodology. The EMP team has found that centralizing the methodology within their group as they work with others in the division has been important in developing metrics in a timely and repeatable manner. The template includes the following sections (Dungca 2023):
- Reason for Review, Goal, and Metric
- Evidence of metric importance and relevance to advance racial equity
- Goal(s)
- Alternative goal(s)
- Proposed metric linking to the goal(s)
- Proposed Accountability Process
- Internal accountability
- External accountability
- Data Sources
- Proposed Approach for Disaggregation by Race
- Metrics and Results
- Conclusions
- Next Steps to Determine Whether Goal or Metric Is Included in Racial Equity Lens
Metro Transit also conducts required Title VI analyses on service changes and potential impacts to low-income communities. The division also has an internal policy on the tolerance level allowable in terms of service impacts and compliance targets that staff seek to achieve. Metro Transit usually uses external consultants to conduct Title VI service equity analyses but will sometimes add the findings to other metrics the EMP is working on.
Metro Transit’s 2021 Annual Service Equity Evaluation Report discusses the division’s framework for evaluating impacts of service changes. The division looks to quantify how much fixed route service is within a reasonable walk distance from a person’s home and how service availability has changed over time (through the number of trips at the stop). The framework uses the percent change in service for different population groups and then weights the percent change in weekly scheduled trips taken by those groups; this helps the division look at stops with greater impact of service based on the number and types of population living within the stop walkshed (Metro Transit 2022a).
The 2021 report focuses on service changes that occurred during the COVID-19 pandemic; Figure 10 shows that the measurement of service decreased for different population groups compared to before the pandemic. Although Metro Transit does not have benchmarks, the tolerance levels in the service equity analyses are sometimes used in this fashion. Last year, the division changed the allowable tolerance level from 20 percent (used in the 2021 report) to 15 percent as a result of public feedback. The report states that Metro Transit’s improvement projects for better speed and reliability of transit service are prioritized (along with other evaluation factors) to target areas with high percentages of people of color, people with low incomes, and residents who rent their homes and areas with larger numbers of low-wage jobs (Metro Transit 2022a).
The 2021 report also includes the several service metrics disaggregated by race to help identify areas where some residents may experience a higher quality of service compared to others

(particularly White residents compared to other racial or ethnic groups) (Metro Transit 2022a). The measurements for each population group are compared to each other and to the regional average. Figure 11 shows the results for access to frequent service during 2021 (i.e., routes that serve stops at least four times per hour). The division added metrics to its 2021 analysis, which looked at the impacts of cut service as a result of workforce shortages during the pandemic (indicated by asterisks in the bulleted list at the end of this section); EMP staff found these measures led to productive conversations with others in Metro Transit working on the scheduling and management of resources. These measures also helped the agency address changes in service delivery during the emergency, including highlighting routes that serve a high number of people of color that were

not receiving enough capacity in terms of vehicle numbers to help maintain social distancing during 2020 (Ditmer 2021). The following service metrics are included in the report:
- Accessibility to jobs (i.e., service utility)
- Count of scheduled trips (i.e., service availability)
- Access to frequent service (i.e., service utility)
- On-time performance (i.e., service reliability)
- Cut trips and percent of service delivered* (i.e., service reliability)
- Passenger crowded*
The Metropolitan Council published a report on equity considerations, which included measurement of Areas of Concentrated Poverty (ACP) where the majority of residents are people of color (i.e., ACP50s) (Metropolitan Council 2021c). The community has not responded positively to these measurements, as some felt that these areas showed unclear connections between income and race. As a result, the division has tried to make more distinctions between race and household income in performance measurement. Metro Transit does consider areas of concentrated wealth as a measure in the EMP’s methodology but is somewhat challenged in measuring this characteristic due to limitations from ACS data.
Engagement and Responsiveness
The equity-oriented performance measures Metro Transit tracks are presented to the Metropolitan Council in public meetings where transit riders and other citizens can learn about how the transit agency performs and voice their opinions, often following Title VI-specific discussions or reports. While public engagement regarding the measures is limited, the team that works on the measures actively promotes the use of the measures and/or the skills among the staff by working with other departments to assist with analyses and help their colleagues apply an “equity lens” to the concepts they are developing (e.g., the development of service scenarios with planners to check the resulting impact on transit users’ access to opportunities).
Planning, Programming, and Operations
Some of the measures have influenced specific changes that benefit transit riders. For example, after determining that the quality and/or availability of customer amenities correlated with socioeconomic indicators (e.g., areas with lower incomes and/or higher percentages of people of color had lower quality/reduced presence of customer amenities), the process for determining placement and the type of customer amenities changed. However, the measures do not typically influence decision making because they are not built into the transit agency’s standard operating procedures. Therefore, while the measures can help assess ideas and scenarios (as well as monitor the service performance already available), that type of assessment is not required, nor is it currently conducted during all planning and programming activities.
Funding and Financing
As a division of the Metropolitan Council, about a third of Metro Transit’s operating budget is supported by fare and advertising revenues; the remainder is supported by a combination of regional, state, federal, county, and other revenue sources (Metro Transit 2023b). Metropolitan Council’s annual budgets do include line items for bus stop facility and equity enhancements (Metropolitan Council 2021a); there are no specified line items for the EMP team (or other groups) within Metro Transit because budgeting for those groups is presumably handled separately within the division.
Budget for data scientist-level positions (a role that made the EMP technically feasible for the agency) was first pursued by Metro Transit’s Director of Strategic Initiatives when that director-level
position was formed (around 2014); the director wanted to create a more data-driven group to work on analyses for the transit division. Metro Transit also reclassified the position level from researcher to analyst, which was novel at a time when data analysts were uncommon within public transit agencies; now titles are classified consistently within the data science field.
Data Collection and Management
The EMP methodology includes data collected from travel behavior and inventory surveys (which tell Metro Transit who is on board at the route level) and data from the division on current ridership. EMP staff also utilize/s ACS data on block group-level demographic information from the available 5-year average periods. The methodology uses GIS software to determine the proportions of ACS data populations within walksheds, then applies those to survey and ridership data for results. Metro Transit has made the code for this analysis available to the public through a GitHub repository (Metro Transit 2023c). Metropolitan Council has also made data from its 2016 Travel Behavior Inventory (TBI) on-board survey available online through the Minnesota Geospatial Commons; this data set includes a survey of riders, including their demographics, trip purpose, origins, and destinations (Metropolitan Council 2023).
Presently, Metro Transit lacks good data on cleaning and snow removal, which could provide a better perspective on equity in service restoration after storms or in customer comfort at stops and stations. Similarly, available data do not capture some aspects of capital investment, such as project implementation and maintenance costs, which would provide further equity insights. Equity metric KPIs at Metro Transit do include measures on promotion, employee engagement (retention), and respectful workplace based on workforce dashboards from human resources and employee engagement surveys; these metrics are disaggregated by race as well (Martina, Dungca, and Farrington 2023). However, staff noted that data on the internal agency, such as information on racial and gender disparities in different positions and divisions, can often be the hardest to come by in terms of availability for analysis.
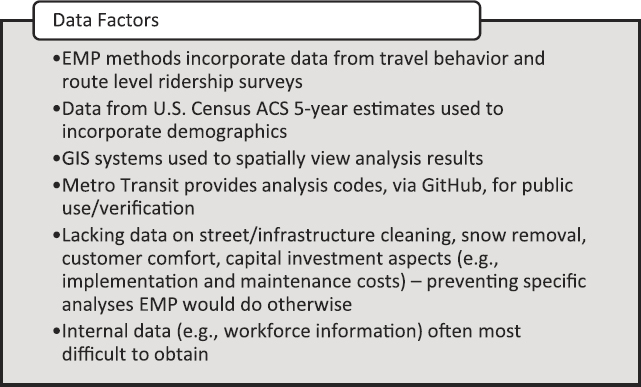
Lessons Learned and Challenges
Metro Transit’s EMP staff noted that it can be challenging to work on equity measures (as well as equity) because the work often requires difficult conversations that challenge existing practices and perspectives within the transit agency and among the community and stakeholders more broadly. Equity leaders often turn over every one to two years, which results in a frequent need to guide new leaders. Therefore, Metro Transit staff have learned the importance of documenting processes and practices for equity measurement so that new leaders can be quickly onboarded and any momentum that was previously gathered can be maintained (as much as possible). Staff also noted that it is difficult to move from equity measurement to equity-driven planning and decision-making. Changing how a transit agency does or decides on something is much more difficult and requires consensus across a much broader group of staff than producing new measures. Additionally, staff have learned that external pressure is often the key to driving equity measurements because those kinds of requests hold more power with decision-makers than staff do.
Summary
Metro Transit benefits from a well-rounded and highly qualified team of analysts who run the transit agency’s equity measurement effort. The transit agency’s robust and well-established methodology for assessing the equity of its services represents a model that could be duplicated or referenced by other transit agencies (as well as other transportation stakeholders, such as cities, DOTs, or MPOs).
Key Challenges
- Influencing decisions. Equity measures are most impactful when used to influence decisions within a transit agency via a standardized process; however, achieving this level of adoption and use is difficult because it requires comprehensive change throughout an agency.
- Changing culture. As with decision-making, cultural change is necessary for equity measures to take hold and have a lasting impact; however, long-standing methods and perspectives are difficult to change without sustained attention and a consistent vision (equity leaders may also experience burnout, causing the process to take even longer).
Notable Practices
- Transparent methodology. Metro Transit produced a thoroughly documented methodology for all the equity performance measures the agency uses and readily shares its methods as well as the data used in the assessments with the public and other stakeholders. Transparency helps with accountability and allows others to conduct their own assessments to either verify outcomes or test another hypothesis.
- Equity metrics program charter. The charter that governs Metro Transit’s equity measures is unique in the industry. Such a document—outlining the responsibilities of the staff and “ensuring the consistent and meaningful development, communication, and use of metrics related to Metro Transit’s equity goals and the disaggregation of our performance”—has the potential to catalyze agency-wide change related to equity (Equity Metrics Program 2021).
- Staff capacity and capability. As previously outlined, the staff who work on Metro Transit’s equity measures are highly skilled and dedicated to this function.
Lessons Learned
- Anticipate turnover. Metro Transit staff has learned that equity work, especially for those communicating unwelcome news or disparities, can be challenging and may result in turnover or disinterest that inhibits progress. It is important to anticipate this fact (as well as strive to promote and praise the work even when it produces challenging results) so that momentum toward change can be maintained.
- External pressure is a valuable change agent. Public feedback and stakeholder inquiries activate different, and often more powerful, responses with transit agencies because of the need to ensure a positive public image. This fact can be useful for equity work because it helps motivate decision-makers to approve and invest in such efforts.
Cecil Transit

Cecil Transit is a division of the Cecil County Department of Community Services. The Department of Community Services is a department within Cecil County, Maryland. The transit agency operates fixed-route bus service in towns within the county (Cross-County Connection routes) as well as service connecting to Glasgow and Newark in nearby Delaware (the Glasgow and Newark Connection routes). Cecil Transit also jointly funds the Teal Line route operated by Harford LINK in neighboring Harford County. ADA-complementary paratransit service is handled through fixed-route deviation (up to ¾-mile of fixed-routes) for any requests from any
Table 17. Cecil Transit service summary.
| Operating Statistic | Total |
|---|---|
| Service Area Size (Sq Mi) | 346 |
| Service Area Population | 102,383 |
| Modes Operated | Bus Demand Response |
| Annual Unlinked Trips | 41,878 |
| Annual Vehicle Revenue Miles | 374,193 |
| Annual Vehicles Revenue Hours | 19,748 |
| Operating Expenses by Revenue Source | |
| Fares | $60,709 |
| Local Funds | $724,659 |
| State Funds | $311,148 |
| Federal Funds | $696,685 |
| TOTAL | $1,793,201 |
| Operating Expense per Trip | $42.82 |
Data Source: National Transit Database 2021.
Image Source: TTI.
passengers with curb-to-curb assistance only. The agency also operates two demand-responsive services: general public demand response called “Demand Response” (throughout the county) and a microtransit service called COMPASS. Table 17 presents a summary of Cecil Transit’s 2021 performance, and Figure 12 is a snapshot of the transit agency’s service area.
Reservations for general public demand response services must be made in advance (at least the day before). Separately, a transportation reimbursement program for trips on for-hire ride services and a volunteer driver program are both administered by Cecil Transit and available for residents who need to reach appointments within or outside the county.
In April 2021, Cecil Transit started the COMPASS microtransit service to respond to high volumes of opioid and other substance addictions in its county and a community need for better transportation during addiction recovery. The program was paid for in the initial 12 months
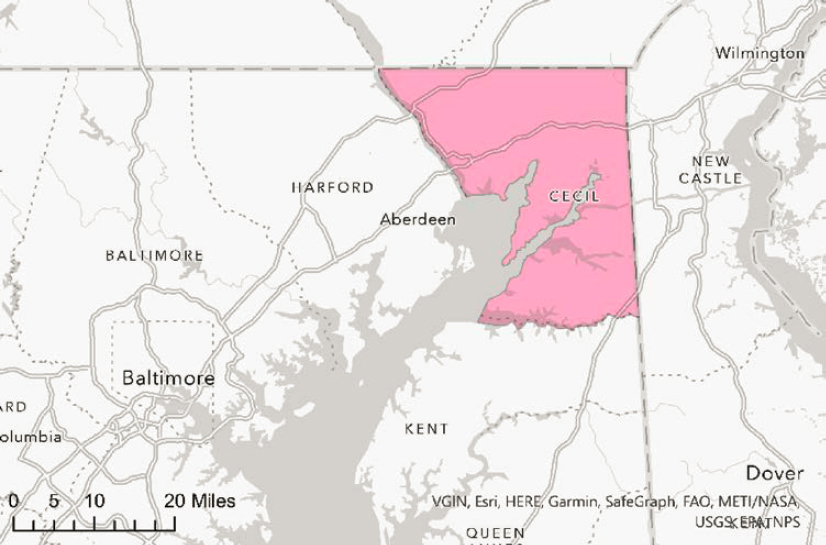
through a $563,000 Integrated Mobility Innovation pilot research grant from FTA, operating in a 71 square-mile zone using six minivan part-time drivers (Hooke 2021). The service is available on weekdays from 4 a.m. to 10 p.m. and is designed to provide transportation for individuals currently living in substance abuse recovery houses; the service hours operate at early morning or later evening times to enable better access to area employers for eligible riders (Hooke 2021). COMPASS service is not available to other general public residents or ADA paratransit-eligible customers. Residents of recovery houses are selected to participate in the COMPASS program by their case managers based on their ability to travel independently (Hooke 2021).
Cecil Transit was chosen as a case example for its experience in responding to community needs for transportation service and its focus on improving health and quality of life outcomes for riders. Cecil Transit’s tracking of riders’ qualitative information through survey efforts helps assess whether the service is helping the agency to meet the goals of providing the service and provides an example of an additional layer of performance measurement beyond traditional data tracking.
Agency Definition of Equity
Cecil Transit does not have a formal definition of equity but considers aspects of equitable service in how they maintain existing programs and develop new ones. Agency staff stated that they aim to think about equity as an opportunity to service people where they are in a fair and equitable manner rather than as a barrier. The agency aims to ask questions about how people will access the service while developing the program and applying for grant opportunities. Cecil Transit does not currently have an adopted definition of equity. The agency’s Title VI program falls under the template of the State of Maryland’s Title VI plan.
Adoption of Equity Effort
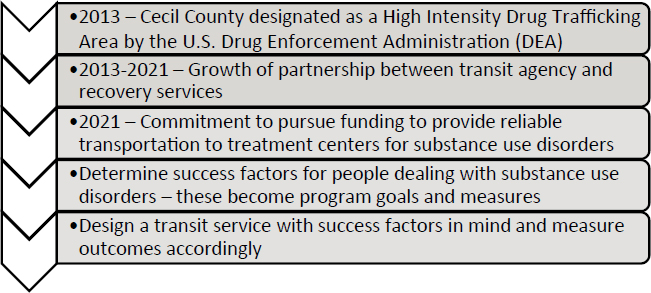
The COMPASS program was specifically developed to help people in the community recovering from drug addiction to have more reliable transit options to travel to treatment, legal appointments, and places of employment, thereby reducing a major barrier to recovery (Shared-Use Mobility Center 2022). Project goals during the demonstration were to (1) provide consistent and reliable transportation options, (2) accelerate participants’ job searches, (3) increase participant’s perceived level of independence, (4) increase financial independence, (5) reduce the rate of recidivism, and (6) create a replicable micro-transit service model.
Institutional Structure and Governance
Cecil Transit is a division under its organization’s Department of Community Services, which is under the Cecil County government, functioning as the de facto transportation department. Designated staff within the Department of Community Services focus on transit service in the county. Cecil County has a charter government with county council members; previously the county had a commissioner form of government, with a county executive functioning as the executive branch, while the county council approved the government’s budget. Currently, the county executive’s role is to govern day-to-day activities.
Cecil Transit staff tend to handle responsibilities for transit service themselves while following FTA and Maryland Transit Administration (MTA) requirements stemming from pass-through funds to the county for transit. In the county, transit tends to be much different than other departments and responsible for more aspects of service delivery (such as human resources and procurement issues tied to federal requirements).
Cecil County does have a Transportation Coordination Council, which serves as an advisory council to Cecil Transit and helps staff members figure out the services needed by individuals. The members of the council include individuals from many human service organizations in the county and other local regional transportation agencies (such as Delaware Transit Corporation). Cecil Transit is able to shares ideas with the council to get constructive feedback and have them participate in a discussion on equity of service when it is feasible; a recent project example is the council providing feedback on an equity analysis for building a new transit center.
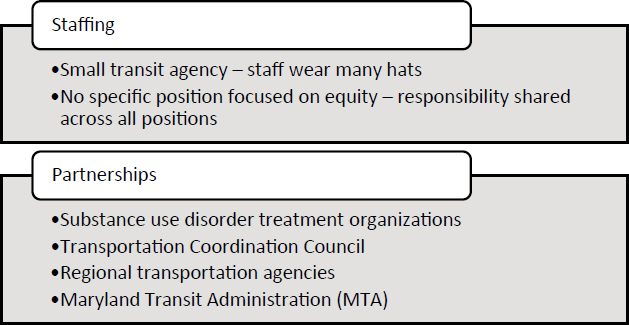
Current and Potential Indicators
Beyond Title VI equity analyses and goals within the COMPASS program, Cecil Transit does not have any formal equity goals for its services at the time of this writing. Agency staff look at equity considerations with respect to service expansion and other changes to ensure that proposed changes will not adversely affect a given population, particularly those in low-income households. During the COVID-19 pandemic, Cecil Transit was concerned about service rollbacks affecting one predominately low-income community; to mitigate these impacts, the agency converted one of its fixed routes serving the metropolitan area into a call-ahead demand response service for that area. Figure 13 shows a bus used by Cecil Transit for Demand Response service.
For COMPASS, Cecil Transit monitors the rate at which people are using the service and whether the service increases their access to employment and a perceived level of independence. Goals for the service associated with performance indicators include improving rates of employment, reducing the number of days to get employed, increasing satisfaction rates with the service, and increasing participants’ ability to remain current on their rent/housing expenses. Cecil Transit does not have specific targets in mind for these indicators but rather wants to show how the transportation option can have a significant impact on quality of life for participants. Cecil Transit looks at these indicators over time through survey information, comparing the current levels of the indicators against their respective baselines.
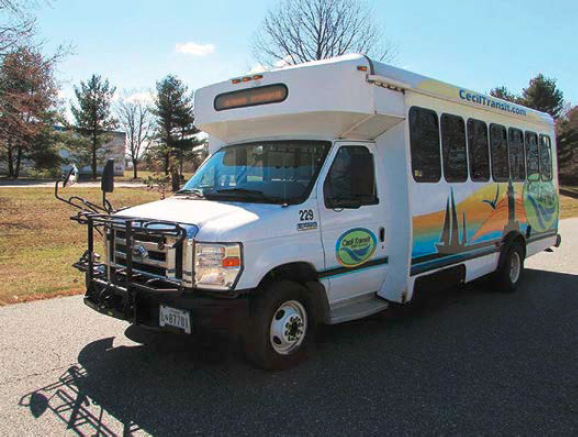
Figure 13. Cecil Transit Demand Response bus.
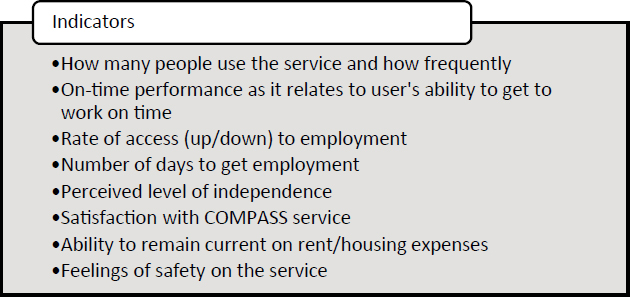
Cecil Transit has also done some work to reframe other traditional performance measures for examining equity of service, mainly through looking at census information compared to rider survey data. Cecil Transit will pose a set of questions to riders to learn about their employment status, use of transit, household income, reliance on transit service, and frequency of trip-taking. Cecil Transit will also look at the on-time performance of service compared to whether riders are able to get to their job on time, examining the importance of timely service in individuals’ lives. Questions in these surveys have evolved over time to gather additional qualitative information about riders beyond general service satisfaction; an example is asking respondents “Do you feel safe while riding the service?”.
This information helps Cecil Transit with grant writing and opportunities to paint a story to political leaders and other community stakeholders about riders who are using the service and experiencing positive impacts from the service. An example of Cecil Transit gathering this survey information is during its “Dump The Pump” week; the agency will give riders using transit a free tote bag or another similar item in exchange for participating in the survey while riding transit.
Some examples of performance indicators used by Cecil Transit include on-time performance, fare categories of riders, use of mobility devices, categories of certain trips, and levels of service in areas with sociodemographic indicators. Tracked fare categories include half-fares paid by persons with disabilities and seniors and bus passes for veterans (the agency offers quarterly passes with up to 12 rides at a discounted rate). Cecil Transit can categorize certain demand response destinations by the type of establishment (such as retail, medical, or dialysis). Sometimes, trip destination information is provided inherently from the parameters of a given program; for example, the agency also has a partnership with a local department of social services for providing temporary case assistance for participants traveling to job placement activities.
Target Setting and Recent Performance
Cecil Transit has some targets in place for traditional productivity and cost efficiency metrics, some of which are set by staff and others who stem from MTA. Prior to the COVID-19 pandemic, Cecil Transit looked more at the number of trips they provided, the assumption being the more rides provided translated to the better the needs of the community were met. The agency uses that indicator less as a measure of success, particularly as fixed route ridership has not returned to pre-COVID levels (about 60 percent returned); that return in ridership is a current service goal. Cecil Transit has observed that the trip demand for the COMPASS program has continued to grow since the pilot started.
Cecil Transit is looking to balance anticipated growth in the community with service for riders’ needs. The county has observed a boom in employment in warehouse-centric jobs in the area and the anticipated opening of a resort nearby. Cecil Transit is trying to determine how to best provide service connections to new employers while reducing the number of times they receive feedback from community members that transportation is a barrier to employment. The agency has found that assessing responsiveness to community feedback can be more meaningful than looking at some of the traditional transit performance standards.
Service performance of the COMPASS program has been steady as the agency has balanced wanting to meet the service demand while starting slow with its modest capacity available in the COMPASS fleet. Currently, COMPASS provides 2.1 trips per hour, a slightly lower figure than three trips per hour for general public demand response service. Figure 14 shows an image of
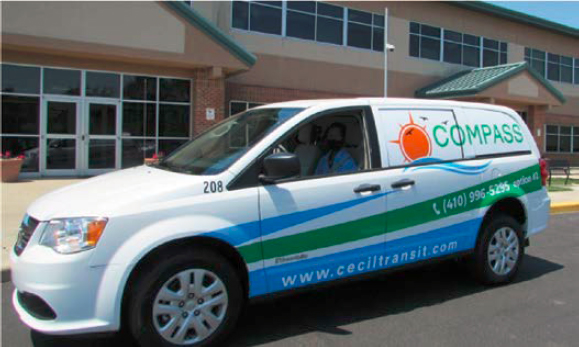
Figure 14. A COMPASS van.
the type of van used for COMPASS service. Cecil Transit is aiming to slowly grow the service with additional capacity.
For COMPASS, Cecil Transit set performance targets of average wait times at 15 minutes (or no longer than 23 minutes), average trip durations under 20 minutes or less, and trip denial ratings averaging 10 percent or less; these targets were set with the consultation of the microtransit technology provider. As of May 2023, the COMPASS program has provided over 15,000 rides. The average wait time for the service is 11 minutes from the time of trip request, with an average trip denial rate of 1 percent per week of all requests made. The average time duration and length (in distance) for COMPASS trips are 11 minutes and 4.4 miles, respectively (Kalmbacher 2023).
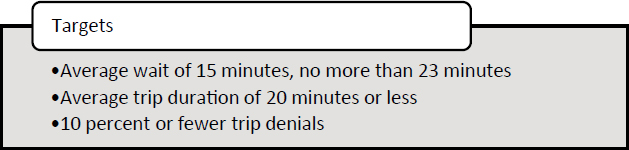
The COMPASS program also measured how individuals who used COMPASS perceived their independence prior to and after using COMPASS (through surveys in comparison to a control group of Cecil Transit riders) (Hooke 2021). The agency found that COMPASS service reduced the number of unmet trip needs from 75 percent to 17 percent, increased independent management of travel from 40 percent to 75 percent, increased overall satisfaction with travel options by users from 21 percent to 88 percent, and reduced average number of days to get a job from 31 days to 11 days (Kalmbacher 2023). Of the total COMPASS trips taken in the first seven months, 51 percent of the trips were to retail establishments, 28 percent to employers, and 21 percent to medical providers; most individuals (81 percent) using COMPASS had also not missed a medical appointment in the previous 2 months (Shared-Use Mobility Center 2022). Results from the surveys sent to the recovery houses themselves reported that the service had increased the rate of successful recovery from addiction, decreased unemployment, and increased the independence of residents (Shared-Use Mobility Center 2022).
Engagement and Responsiveness
Cecil Transit’s annual surveys to riders help gather feedback directly from them, while the agency’s work with local stakeholder partners and the Transportation Coordination Council provide additional engagement opportunities for community needs. The agency will also conduct pop-up outreach events periodically, which are intended to be more conversational in nature rather than formal feedback mechanisms; these events involve going to locations that are major
trip generators and talking to people who come by about what they need from transit service. The events are announced through social media and incentivized through modest giveaways (one example is a “transit toolkit” bag with schedule information and other useful items). Cecil Transit sees the pop-up events as an opportunity to both educate riders about the service and respond to their concerns. Customer feedback from these events led to the agency switching from looped routes to bidirectional service for the first time.
Agency staff expressed the importance of looking beyond the rules and regulations of service issues to see the needs of people by responding to their feedback, as performance figures sometimes do a poor job of measuring the effectiveness of service. The COMPASS program was an example of responding to a community’s need even as stakeholders were unsure about what they wanted in transit service before the program launched. The agency has found that responding to opinions on service needs shows that the community members’ rides are meaningful; conversely, if people do not feel their opinions are valued, they will not provide feedback or ride the service.
Planning, Programming, and Operations
Cecil Transit has looked at incorporating equity into hiring, procurement, and stakeholder membership as much as feasible. The agency has Disadvantaged Business Enterprise (DBE) goals for contracting; however, not a lot of those businesses are in their region. However, this fact makes it even more important to find those voices from other groups for inclusion in the process. Cecil Transit will look for representatives who represent historically underrepresented groups involved in other organizations who can be a part of their own processes. Cecil Transit staff have observed that the Council membership is more diverse now than in the past; however, limits on representation still exist. While attendance from general public transit rider members can be challenging, social service agency staff who represent riders can be a useful substitute.
The Transportation Coordination Council helped to plan the COMPASS program from the very beginning, and the agency formed a steering committee for the program once the agency received notification that the grant was awarded. Committee membership includes rehabilitation house managers and riders (who can be challenged to attend meetings regularly) along with representatives from addiction services, the drug court program, software programs, and county staff. This committee met monthly and provided input on how Cecil Transit designed and measured the program.
For the time being, membership on the steering committee is not compensated or incentivized beyond having a voice in the process. Cecil Transit also explored designing the COMPASS program with incentivizing trip-making, but house managers on the committee advised against further incentives to mitigate the potential misuse of money by participants. Instead of monetary incentives, participants have at times been provided gift cards for a Transportation Network Company (TNC) service or local grocers to encourage taking initial rides or evaluation surveys; however, there is still some concern that the gift cards themselves can be sold and misused, which could limit future willingness to incentivize participation due to budget concerns or political ramifications.
Funding and Financing
Cecil Transit uses a combination of federal, state, and local funds for the agency’s fixed route and general public demand response services. The COMPASS program was initially funded through an Integrated Mobility Innovation (IMI) grant awarded by the FTA. The agency is currently looking for additional funding to continue and expand the program (Shared-Use Mobility Center 2022).
Data Collection and Management
Cecil Transit regularly collects ridership and trip data for all of their services as well as information from annual surveys sent to riders. An independent evaluator’s report is in progress for the COMPASS program that will provide an assessment of the program to date; most of the information that will be in the report has been collected separately by the evaluator.
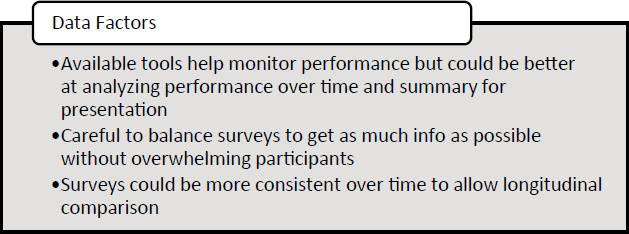
Cecil Transit staff find that while they do have the general tools available to monitor the performance of the service, they do not have the best tools to analyze the information and pull it together into good reports; currently, staff members have to compile this information manually. In addition, the agency has to balance how many questions they can pack into the survey to get the information they need without the survey becoming overwhelming. In its experience, Cecil Transit has found that an excessively lengthy survey causes some people not to take it. The agency also needs consistency in the survey questions year over year so that staff can measure changes that have taken place. Cecil Transit will still vary some of the questions in the survey based on current needs and focuses for the agency’s priority.
Lessons Learned and Challenges
Cecil Transit staff noted a challenge with getting stakeholders and partners to follow through on commitments made during the initial planning and agreement phases of a given project. For example, the agency wanted to track relapse rates of participants in the COMPASS program through information gathered by the houses. Cecil Transit put together agreements with the houses before the grant was awarded, which included this aspect in performance tracking, but after the grant was awarded, the houses decided they would not be able to share this information. Lacking the availability of specific data like these can make it difficult for the transit organization to measure how much progress in equity goals has been made.
The COVID-19 pandemic also presented several challenges for general public service and the COMPASS program. It was initially difficult for Cecil Transit to get the number of riders needed to participate in the pilot. Some houses shut down during the pandemic after their funding was exhausted or an outbreak of the virus would happen among residents. Cecil Transit believes the potential of the program has not yet been reached because it launched during the pandemic; however, there is still opportunity for it to grow.
Summary
Cecil Transit uses an equity focus to tackle the transit service needs of the community for its general and targeted services. The agency’s development of a microtransit program specifically designed for riders of high need to improve quality-of-life outcomes is a unique service example, and the set of indicators used to track the program’s performance transcends traditional transit service measures. The agency continues to look for further opportunities for equity-focused performance measurement and growth of services that meet specific community needs.
Key Challenges
- Representing Diversity Perspectives. In communities with a larger majority population, it can be more difficult to identify individuals from other socioeconomic backgrounds willing to provide feedback or participate in stakeholder committees. Additional barriers can include time availability, meetings during working hours, or lack of compensation available.
- Barriers in Performance Measurement. Cecil Transit found that some of the goals for targeted microtransit service were difficult to measure because of either the unavailability of the data or lack of willingness to share the data due to privacy concerns from the partner organizations.
Notable Practices
- Multiple Engagement Avenues. Cecil Transit has developed and worked with different types of partners and organizational bodies to provide input in service planning and program adjustments. This roadmap includes partnering with rehabilitation houses and drug courts in their region, forming a steering committee for their microtransit program, and ongoing participation with the Transportation Coordination Council.
- Unique Indicators. COMPASS uses some unique indicators in measuring how the service improves quality-of-life outcomes for riders, looking beyond the number of trips provided. Cecil Transit’s survey efforts similarly aim to gather insights on employment and access opportunities that transit service can help provide.
Lessons Learned
- Community Participation. Additional steps and incentives are needed for further participation from diverse voices in the community who are representative of riders. These may even include compensation for attending engagement meetings or participating in committees and councils concerned with transportation service.
- Reasonable Service Commitments. Cecil Transit started its COMPASS program at a modest size to ensure the service worked effectively with its participating rehabilitation houses; this practice helped ensure that the number of vehicles and drivers available could meet trip demands from participants and be seen as a reliable service.
Envida

Envida is a nonprofit organization providing transportation services to people with disabilities, older adults, and people with low incomes or other financial challenges throughout El Paso, Teller, and Park Counties in Colorado. Envida is based in Colorado Springs and has been in operation since 1971. The organization’s hours of transit operation are 5 a.m. to 6 p.m. on weekdays (Monday through Friday) and 7 a.m. to 4 p.m. on Saturday; the organization accepts a ride donation of $3.50 in the city and a ride donation of $5 for longer rural routes. Connections between Colorado Springs to Calhan and Northern El Paso County are available.
In recent years, Envida has introduced new services specifically to meet the needs of vulnerable transportation users, including people with behavioral health needs, older adults, and people with disabilities.
Envida recently launched a Mobility as a Service (MaaS) style service using an FTA Innovative Coordinated Access and Mobility grant. This program includes a technology platform that facilitates ride requests made by riders and healthcare providers and offers “mobility navigation” support via customer service representatives. To support the unique population this service is designed to serve, the vehicle drivers received additional training in behavioral disorders and trauma-informed care. Envida partnered with a number of different agencies and organizations prior to submitting the application for this grant, which helped the organization identify the need for behavioral health-focused transportation service. These partners included behavioral health providers, RouteMatch, and local transit agencies in Teller County (Envida 2019).
In January 2023, Envida began an On-Demand Pilot Program in Colorado Springs that allows participants to schedule same-day rides. The program is supported by the National Aging and Disability Transportation Center (NADTC) and the Pikes Peak Area Council of Governments (PPACG). On-demand service for older adults and people with disabilities is available from 8 a.m.
Table 18. Envida transit service summary.
| Operating Statistic | Total |
|---|---|
| Service Area Size (Sq Mi) | 2,683 |
| Service Area Population | 765,424 |
| Modes Operated | Bus Demand Response On-Demand |
| Annual Unlinked Trips | 23,660 |
| Annual Vehicle Revenue Miles | 228,311 |
| Annual Vehicles Revenue Hours | 14,341 |
| Operating Expenses by Revenue Source | |
| Fares | $0 |
| Local Funds | $506,756 |
| State Funds | $779,637 |
| Federal Funds | $239,768 |
| TOTAL | $1,526,161 |
| Operating Expense per Trip | $62.87 |
Data Source: Envida.
Image Source: TTI.
to 8 p.m. seven days a week. The service typically provides transportation to and from host homes and assisted living centers, and trips are currently available to the users at no cost.
Table 18 presents a summary of Envida’s 2021 performance, and Figure 15 shows the transit agency’s service area.
Envida was chosen as a case example because of the organization’s unique services, dedication to facilitating transportation access that is responsive to specific needs within its community, and experience with non-traditional performance measures. The organization is expanding and has moved into rural El Paso County with the MaaS program in 2018. It is also responding to the community’s need for on-demand transit services similar to the service available through TNCs with its On-Demand Pilot Program in the Colorado Springs Area. Envida’s tracking of both quantitative

and qualitative indicators of program success (some of which also internalize concepts of equity) helps it to evaluate the extent to which its services have made a difference to the overall well-being of the community, the individual lives of older adults, people with behavioral and physical health disabilities, and people with low incomes.
Agency Definition of Equity
Envida does not have a formal definition of equity but considers accessibility (both in terms of providing services that meet the needs of people with disabilities and that give people access to the places they need or want to be) an integral aspect of its services. Many of the staff members who work at the organization have direct or indirect experience working with underserved populations and are sensitive to the needs and problems faced by different communities, even going beyond transit services. According to the organization’s staff, “Envida as an organization that serves unserved and underserved populations understands the importance of setting goals that are diversity, equity, and inclusion (DEI) focused.”
Adoption of Equity Effort
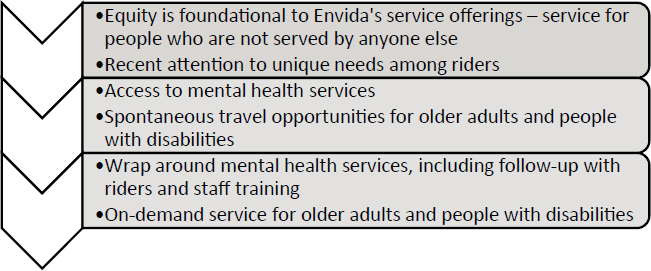
Both the MaaS and the On-Demand Pilot programs have been serving vulnerable population groups in the region. In an attempt to support the circumstances of those facing behavioral health challenges, Envida has successfully overcome infrastructural barriers to obtain behavioral health services among historically underserved populations in rural Colorado (Envida 2019). Likewise, the On-Demand Pilot Program—by providing spontaneous rides to older adults and individuals with disabilities—offers flexibility for scheduling rides to medical appointments, grocery stores, social or religious events, or other personal needs (PPACG 2023).
Envida has an ongoing practice of listening to the community it serves and receives feedback on different fronts. Recently, the organization partnered with Assisted Living Experience in Colorado Springs to support recreational activities for that organization’s residents. Envida is also exploring strategies to assist formerly incarcerated people with transit needs, such as rides to court hearings and probation-related appointments/facilities.
Institutional Structure and Governance
Envida is a nonprofit organization governed by a board of directors that oversees the services of the organization’s Executive Director and other staff. The organization participates in numerous events to engage with the community and recruit members who represent diverse communities, such as people with disabilities and people of color. Recently, Envida hired people who identify as non-binary and empowered these people (within their comfort) to help the organization better understand some of the issues facing the LGBTQ+ community. The organization does not have a specific division or set of staff members who focus on ensuring equity in transit services. Instead, Envida relies on personnel with lived or professional experience combined with active community engagement to enhance inclusivity and address disparities
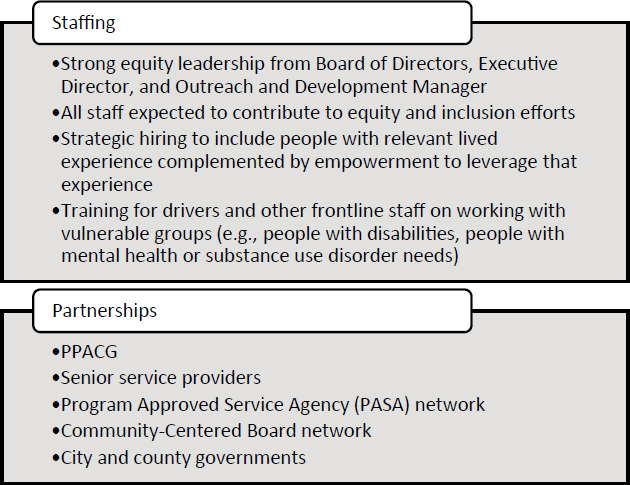

Source: Envida
Figure 16. Envida transporting a client to healthcare service.
both in its service provision and organizational culture. Furthermore, Envida positions itself to supply services that would otherwise remain undersupplied if left to for-profit firms—therefore directly focusing on marginalized and vulnerable groups. Figure 16 shows an image of an Envida vehicle transporting a client to healthcare service.
For specific programs, the structure may vary depending on program needs and/or grant requirements. For example, Envida hired a healthcare mobility manager for the MaaS program to track usage, ensure service availability when needed, and coordinate care with treatment providers, which helps the agency support collaborations with service partners/recipients, such as hospitals (Envida 2019). The On-Demand Pilot program has a steering committee that consists of staff at Envida, the mobility coordinator at the PPACG, and service riders. The riders provide direct feedback on the program, which helps improve and enhance inclusivity. The organization also has a strong informal network with partner organizations that help by exchanging information and sharing ideas. Figure 17 shows an image of an example of Envida’s On-Demand Pilot program in operation.
Overall, Envida partners with different organizations to efficiently deliver transit services and help community members have a fulfilling and independent life. One focal area of its partnerships is collaborating on grant applications. For example, the organization partnered with Fountain Valley Senior Center and Silver Key Senior Services to learn from their experience with serving older

Figure 17. Envida’s On-Demand Pilot Program in action.
adults via transit and meal services. Additionally, Envida partners with Community-Centered Boards in Colorado, such as The Resource Exchange, in many of their programs.
Finally, Envida is recognized as a Program Approved Service Agency (PASA) in Colorado and is, therefore, approved to provide community-based services to individuals with intellectual or developmental disabilities who are approved for Medicaid waiver services. As a result, they are included with case managers and agencies that operate day programs during monthly update meetings where they can learn how well Envida is meeting the needs of the community and discuss changes in policies as the demand continues to increase.
Current and Potential Indicators
Broadly, Envida’s equity goals include the following: (1) provide reliable transportation to enhance riders’ quality of life and independence, (2) provide affordable transportation to low-income clients, and (3) provide accessible transportation to serve individuals of varying disabilities.
The organization prioritizes qualitative data as a nontraditional performance indicator of tracking progress toward equity-focused goals described previously. Envida conducts various surveys and focus group interviews, which inform them about riders’ needs and feedback on current services. By hearing about the experiences of the riders and identifying any pattern in the feedback, the organization identifies areas (e.g., accessibility or quality of service) that need to be addressed. Additionally, Envida uses traditional quantitative data (including ridership, cancellations, and no-shows) creatively to help evaluate the impact of missed appointments on behavioral health outcomes in the MaaS program. Furthermore, Envida sought data on outpatient care rides to estimate cost savings to the healthcare system from using Envida’s service in lieu of ambulance transit (Envida 2019).
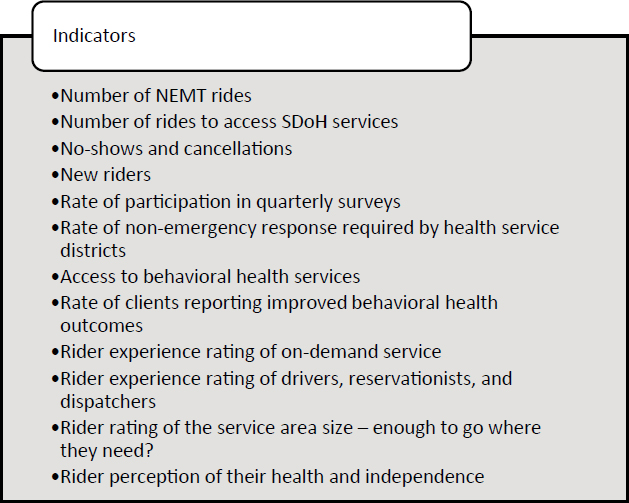
In the case of Envida’s MaaS program, the initially identified performance indicators included both quantitative and qualitative inputs. The success of the program was measured on the basis of the following indicators:
- Number of non-emergency medical transportation (NEMT) health services rides provided between Teller and El Paso counties
- Number of NEMT health services rides provided within Teller County
- Number of additional social determinants of health (SDoH) rides to, from, or within the Teller County service area
- Number of no-shows from Teller County clients
- Number of cancellations from Teller County clients
- Number of newly enrolled clients
- Participation in quarterly new-client qualitative surveys
- Reduced nonemergency responses by the Ute Pass Regional Health Service District
- Increased access to the care of behavioral health clients
- Increased rate of clients reporting improved outcomes
Prior to rolling out the On-Demand Pilot program, the NADTC conducted a pre-program survey to assess the needs of on-demand transit service in the community. The pre-program survey
questions focused on service frequency, a willingness to pay, and the expected timeline of the ride service. Following the implementation of the pre-program survey in January 2023, Envida has been monitoring the utility of the program and experience of the riders through a check-in survey via phone call, which consists of the following questions (Agency Internal Document):
- Have you used the On-Demand Pilot Program? If not, why?
- How has your experience been with the program? Do you have any recommendations?
- How was your experience with the Driver and Reservationist/Dispatcher?
- Has the 7-mile radius from your pick-up location prevented you from accessing certain services/activities in the community? If we were to revise this radius, what would you recommend?
Annually, Envida also conducts the “Envida Transit Survey” aimed at gathering feedback to improve transit services. The questions broadly focus on overall satisfaction with the program, service efficiency (accessibility, frequency, and time to get a ride), and the service’s impacts on health and independence. The survey responses help Envida understand what works and what needs to be improved for each population group they serve. Informally, the organization keeps track of potential riders who are being turned down each week and using this information to inform discussions with elected officials regarding policy decisions, including availability of funds to maintain and increase services.
Target Setting and Recent Performance
Envida relies on quantitative markers of a program’s utilization as well as user feedback/staff knowledge to assess the effectiveness of their programs.
In the case of the MaaS program, Envida exceeded targets for all indicators except the total number of new enrolled clients. Table 19 presents the number of rides delivered by Envida through the program compared to the targets set for service in Teller County.
The organization also documents cases or outcomes in which a client experiences a significant difference in the quality of their life due to the transit services offered by the organization through the MaaS program. In September 2021, Envida was awarded the Colorado Association of Transit Agencies (CASTA) for Human Services Agency of the Year award for its services.
In the case of the On-Demand Pilot Program currently underway, riders are successfully using the spontaneous rides to go out for recreation, medical appointments, or attend to other personal
Table 19. Envida performance measures and outcomes.
| Teller County Performance Measures (completed rides) | Target (Sep20 to Sep21) | Actual Current Month (Sep21) | Actual to Date (Sep20 to Sep21) | Precent Target to Date | |
|---|---|---|---|---|---|
| 1 | Number of NEMT rides for health services delivered by Envida statewide to from Teller County. | 95 | 29 | 132 | 138.9% |
| 2 | Number of NEMT rides for health services delivered by Envida within Teller County. | 60 | 32 | 126 | 210.0% |
| 3 | Number of additional social determinants of health rides provided to, from or within the Teller County service area. | 180 | 20 | 323 | 179.4% |
| Total rides | 335 | 81 | 581 | 173.4% |
Source: Envida 2019.
needs. Substantiating the utility of the program is the PPACG’s interest in its extension by at least another 6 months.
Engagement and Responsiveness
Envida’s annual transit surveys, phone check-ins, and focus groups help gather and share feedback with the program’s steering committee and board of directors. Envida noted that building trust with the customers and partners is critical to the success of a service in a rural community. In rural communities, individuals typically work with people they already know; hence, familiarity with drivers and other key staff members is important (Envida 2019). Envida utilizes local informal networks and events, such as the Farmers’ Market, to spread information about any new or upcoming services.
Organization staff also noted the importance of “doing while listening.” The staff stated that it is not always possible to suitably design a solution to a problem without a starting point. Hence, it is important to begin to respond to community needs and remain flexible in that response’s approach and outcomes based on customer feedback, with the goal of ultimately arriving at a well-designed service plan.
Planning, Programming, and Operations
Envida was created in response to the service needs of underserved residents; therefore, equity is inherent in the different phases of transit provision, including planning, programming, and implementation. During the discussion with the organization, Envida staff used specific examples to explain their processes.
In the planning process of the On-Demand Pilot Program, Envida sought to recruit a diverse pool of participants and strategically selected individuals of varying ages, backgrounds, and abilities to achieve inclusivity and representation. When enrolling in the On-Demand Pilot program, Envida started with 30 older adults and 20 individuals with disabilities in accordance with its mission and have since been able to maintain the enrollment. The program steering committee was involved in setting the initial enrollment target.
In the programming phase, Envida looks beyond a “one-size-fits-all” type of transit provision to ensure its services suit the needs of different population groups. For example, in the case of MaaS program, Envida acquired two all-wheel-drive passenger vehicles for mountainous rural routes. This acquisition helps drivers access riders, reduces stigmas associated with mental health and substance use care by facilitating access, and improves service response times. To support inclusive and respectful operations, all drivers received training in behavioral health and trauma-informed care to provide empathetic service (Envida 2019). Envida’s dispatchers/reservationists are also aware of differing abilities and support individual needs during the process of scheduling rides or working with riders individually to provide accommodation.
Funding and Financing
Envida uses a combination of federal, state, and local grants to fund its services. It rolled out the MaaS program using funds from the FTA’s Innovative Coordinated Access and Mobility grant (Envida 2019). The On-Demand Pilot Program was supported by a $70,000 grant awarded by the NADTC to the PPACG and Envida.
In some cases, the granters want to know the expected impact of different programs. For the MaaS program, Envida surveyed individuals to understand the utility of transit for behavioral health services in the region prior to service programming and implementation. Additionally, Envida seeks to collect baseline and post-implementation data to evaluate the outcome of a
program, wherever possible. Regarding the MaaS program, the data were able to substantiate that the participants were in an improved state of mental health after the program rollout. For select indicators, however, Health Insurance Portability and Accountability Act of 1996 (HIPPA) restrictions can be an impediment to comparing pre- and post-implementation health outcomes (Envida 2019). Medicaid funding does not require impact evaluation; however, outcome assessment is the most meaningful way to understand the impact of an intervention on the community for Envida.
Data Collection and Management
While Envida uses both quantitative and qualitative measures to evaluate program performance, it prioritizes qualitative data to evaluate the impacts of a program. Envida conducts regular surveys and focus groups to keep itself informed about customer satisfaction and collect feedback. These data are recorded for later reference, and the unique experiences of the different population groups Envida serves help the organization include as many customers who require transit service as possible.
Envida finds that while it has the tools to assess rider satisfaction, its staff does not have the best tools to compare them against the sociodemographic characteristics of riders. These metrics will provide key insights into the backgrounds (e.g., age, ethnicity, household size, income) of different riders and their relationship with travel characteristics, such as use frequency and trip purpose. Ultimately, Envida sees the combination of qualitative responses and sociodemographic data as a tool to systematically evaluate program success for different sociodemographic groups and modify services to better suit the needs of the community.
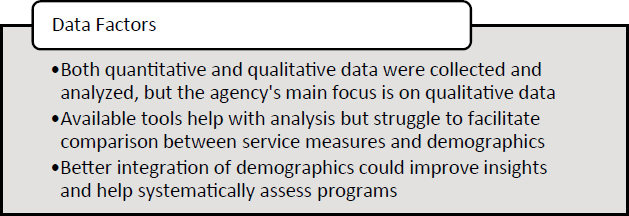
Lessons Learned and Challenges
Envida staff noted the increasing gap between the demand for transit services and financial support available to increase and maintain service standards. Envida sees collaborations and partnerships with other agencies as indispensable aids to enhancing the well-being of disadvantaged communities. In the future, Envida would like to expand services to serve more historically unserved and underserved populations in the community. Envida also noted that periodically reflecting on its services from several different perspectives (such as participating in the case example interview for this project) is helpful in reconnecting with its initial goals and motivates it as an organization to continue adding value to the lives of people they serve.
Summary
Equity is at the core of the planning, programming, and operation of services provided by Envida. Through the transit and homecare programs of the organization, the aim is to provide services to the most vulnerable populations in the community (i.e., older adults, people with disabilities, people with low incomes, people with behavioral health or substance use disorders, and people living in rural communities). With each new initiative, such as the On-Demand Pilot Program, Envida continues to promote health and independence among the communities it serves. The organization focuses deeply on continuous community engagement and developing programs to address the needs of diverse demographic groups.
Key Challenges
- Representing Diverse Perspectives. In communities with a less racially/ethnically diverse population, such as Colorado Springs, it can be more difficult to identify individuals from different backgrounds who are willing to participate in stakeholder committees.
- Negative response to surveys. In the case of the MaaS program, Envida needed to modify performance measures during the grant reporting period, in part due to negative client reaction to detailed quantitative surveys. Additional barriers to performance measurement include HIPPA restrictions that keep Envida from comparing select health outcomes pre- and post-intervention. Similarly, Envida faced challenges from a lack of survey responses and inactive phone numbers during mid-program check-ins via a phone call for the On-Demand Pilot Program.
- Keeping up with increasing demand. Envida has noted the rise in demand for services offered by the organization. In the absence of adequate funding, however, it must deny service plans or turn down individuals. Going forward, the organization is working toward having conversations with county commissioners to bring to their attention the importance of expanding services for the community.
Notable Practices
- Use of qualitative performance metrics. Envida relies on a number of qualitative performance metrics collected through surveys and focus group interviews collected annually (and in some cases pre-program, mid-program, and post-program) to assess the success of a program and make modifications, if necessary.
- Hiring staff with experience working with underserved communities. Envida relies heavily on its staff in delivering services that align with its mission to better the lives of the most vulnerable people in the community (i.e., older adults, people with disabilities, people of low income, people with behavioral health or substance use disorders, and people living in rural communities). Therefore, its most successful hires are those with prior experience working with or living as a member of the populations they serve.
Lessons Learned
- Hear who you serve. Envida believes in strong community engagement. The services it offers continue to stem from the conversations the staff have with different riders and other community stakeholders. The organization also holds mid-program surveys and focus group interviews to enhance the delivery and address equity-related issues, if any. Additionally, ongoing conversations with Community-Centered Boards and other stakeholders allow for discussions on necessary local/regional/state policy changes in response to rising demand for rides.
- Embed equity targets into program enrollment. Envida is currently running its On-Demand Pilot Program in conjunction with the NADTC and the PPACG. The program has a steering committee that enrolled program participants in the pilot with a vision to enhance equity and assess the impact of the program for different groups. The committee enrolled 30 older adults and 20 individuals with disabilities so that all stakeholders could be assured that the initial group of participants had lived experience tied to the equity-related objectives of the program (as opposed to a self-selection process where people request rides on a new service that is open to the general public that might result in a group of pilot riders who do not represent the service’s target populations).


