Transit Agency Goals and Non-Traditional Performance Indicators Focused on Equity (2024)
Chapter: Appendix B: Data Collection and Recruitment Methods

APPENDIX B
Data Collection and Recruitment Methods
Data Portal
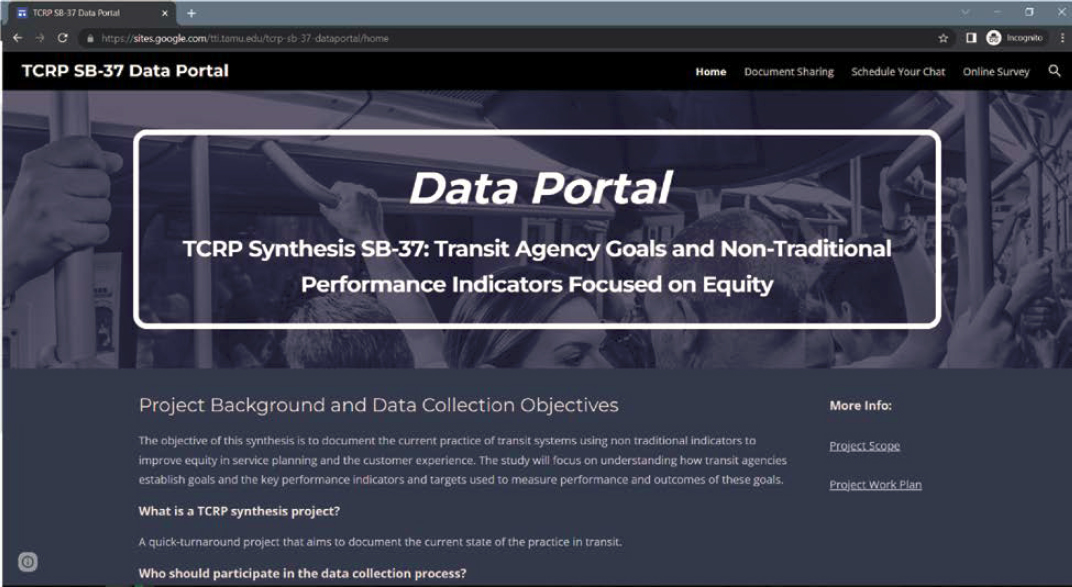
The research team developed a central location to host each of the project’s data collection tools with the goal of engaging potential research participants more fully (compared to relying on a short email request, for example). This portal included a project description and outlined the requested information as well as the methods available for contributing to the research (sharing documents, meeting with researchers, or/and responding to the online survey) and directly linked visitors to each of the ways they could contribute. Figure 41 presents a screenshot of the data portal home page, available at: https://sites.google.com/tti.tamu.edu/tcrp-sb-37-dataportal/home.
Document Sharing
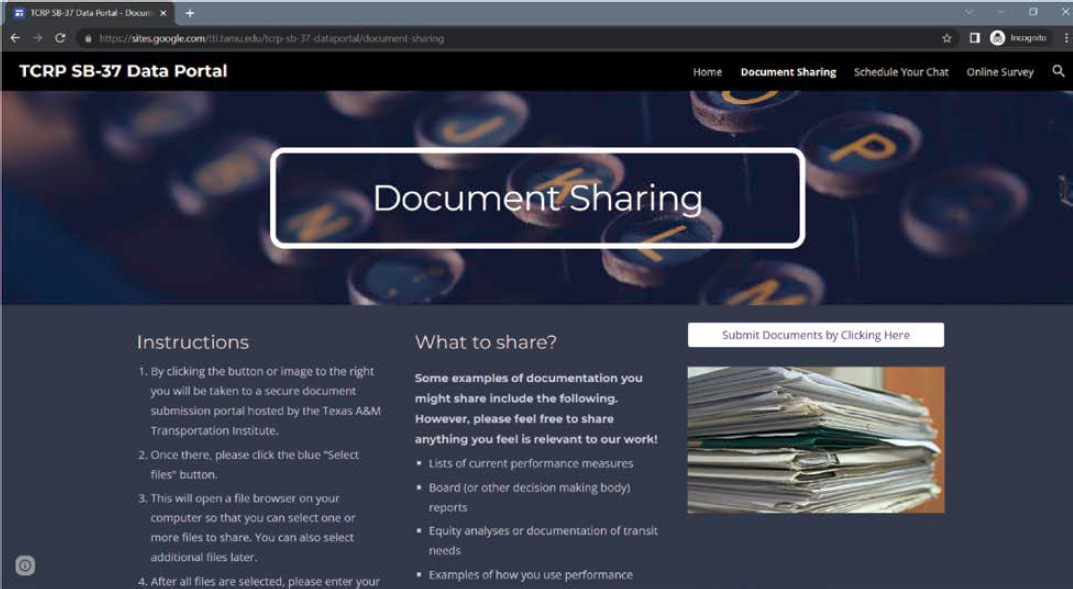
Performance measures of all kinds are typically well-documented; however, much of this documentation is limited to internal agency documentation, such as the methodologies behind the metrics or processes for developing performance measures, that are not available via
traditional literature reviews. Because of this, there is a lot to learn from requesting and reviewing documents directly from transit agencies. Additionally, sharing documents with the research team can be done quickly—a function that was intended to encourage more transit practitioners to participate in the data collection process if they might otherwise not have time to participate in an informal interview or focus group. The Document Sharing section of the Data Portal described the types of documents a respondent might supply and provided instructions for how the document sharing system used (OneDrive) functions—as shown in Figure 42.
Research Chats
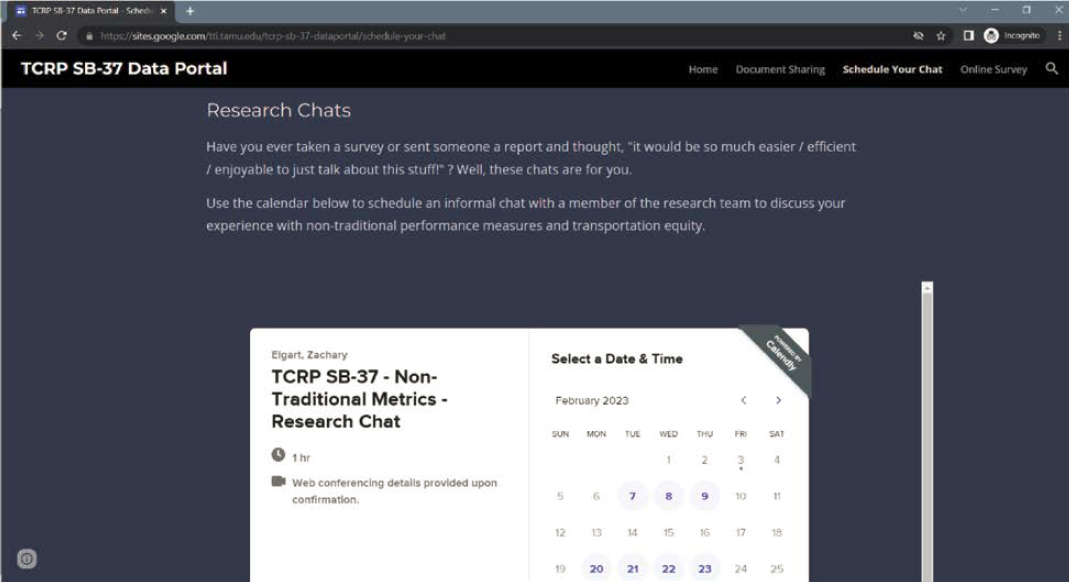
The research team received feedback during other projects that some people prefer to respond to survey type questions in an informal conversational setting. It is also the research team’s experience that this format offers opportunities to delve into topics that might otherwise be overlooked by traditional surveys. Therefore, to accommodate participants’ diverse response preferences and gain the opportunity to ask follow-up questions specific to an agency’s unique circumstances, the research team offered the opportunity for participants to self-schedule informal chats with a member of the research team. These discussions were hosted online via Microsoft Teams and lasted approximately 60 minutes. During the chats, the researcher and participant discussed the same questions included in the online survey (see Appendix B). From the Data Portal, participants were able to directly schedule a time to chat with the research team member via an embedded Calendly scheduler, as shown in Figure 43.
Online Survey
Upon panel approval of the survey questions and methodology, the research team programmed the survey using Qualtrics and embedded it within the Data Portal website for easy access. As is the default with all Qualtrics surveys, survey interaction was confirmed to be Section 508 compliant to accommodate people with disabilities. The survey was anticipated to require about 30-40 minutes to complete. Survey questions are presented at the end of this appendix.
Data Collection Recruitment
Recruitment of respondents occurred in two phases, as described in the following sections.
Recruitment Phase One
Leveraging the research team’s existing set of industry contacts (including members of the project panel), a round of targeted outreach was conducted to invite known innovators to contribute to the data collection effort. The research team used a version of the following email script to initiate this outreach:
Subject:
Info Request - Transit Agency Goals and Non-Traditional Performance Indicators Focused on Equity
Email Body:
Dear ______,
I hope you’ve been well! I’m working on a project, sponsored by the Transit Cooperative Research Program, to learn more about how transit agencies and other transportation-providing organizations use non-traditional performance indicators to improve equity in service planning and customer
experience. As part of this project, we’re requesting information about your organization’s experience with this type of service.
Using the link below, you can support the research in either/all of the following ways:
- Share/upload any relevant documents (if available) to give the research team additional context on your agency efforts.
- Schedule a research chat with a member of the research team to discuss your agency’s experience via online meeting.
- Respond to an online survey.
https://sites.google.com/tti.tamu.edu/tcrp-sb-37-dataportal/home
Thanks for your time and any assistance you can provide!
____signed_____
Recruitment Phase Two
The transit industry in the U.S. is diverse and widespread. Therefore, assistance with conducting outreach is critical to ensuring a sample that is representative of the industry. The research team coordinated with outreach partners as listed below (with assistance from the project panel where appropriate) to disseminate short notices about the research project requesting that interested participants visit the Data Portal to contribute information.
- American Association of State Highway and Transportation Officials (AASHTO)
- American Planning Association (APA)
- American Public Transit Association (APTA)
- Association for Commuter Transportation (ACT)
- California Transit Association (CTA)
- Center for Neighborhood Technology (CNT)
- Community Transportation Association of America (CTAA)
- Conference of Minority Transportation Officials (COMTO)
- Eno Center for Transportation
- Interjurisdiction Transit Equity Research Collaborative (ITERC)
- Mpact (previously Railvolution)
- Shared Use Mobility Center (SUMC)
- South West Transit Association (SWTA)
- Transit Center
- TRB Committees AME10 and APO10
- TRB Minority Fellows Program alumni
- WTS
To support Phase 2 of the outreach effort, the research team developed a simple project description that organization’s that chose to support the outreach effort could include in email newsletters or similar, presented below.
The research team for a new Transit Cooperative Research Program project (TCRP SB-37) documenting equity-focused goals and non-traditional performance indicators is currently collecting data on the state of the practice. Your agency can support this important research by sharing relevant documents, responding to a survey, or scheduling a short chat with the research team. Additional information about participating in the research is available at the SB-37 Data Portal and any questions can be directed to the project’s principal investigator, Zachary Elgart, at z-elgart@tti.tamu.edu.
Recruitment Phase Three
After both of the previously discussed outreach efforts were complete and two weeks passed with limited response, the research team conducted two more sets of outreach. First, the team contacted agencies with known equity efforts (22) directly to request their participation. Second, the research team coordinated with the TTI communications department to initiate a third and final round of recruitment via TTI’s social media channels (LinkedIn and X). The posts, shown in Figure 44 and Figure 45, were shared with the same outreach partners listed in the Phase Two description, above, and the research team requested that those organizations reshare the posts to their followers.

Source: https://www.linkedin.com/feed/update/urn:li:activity:7056633751706992641?updateEntityUrn=urn%3Ali%3Afs_feedUpdate%3A%28V2%2Curn%3Ali%3Aactivity%3A7056633751706992641%29
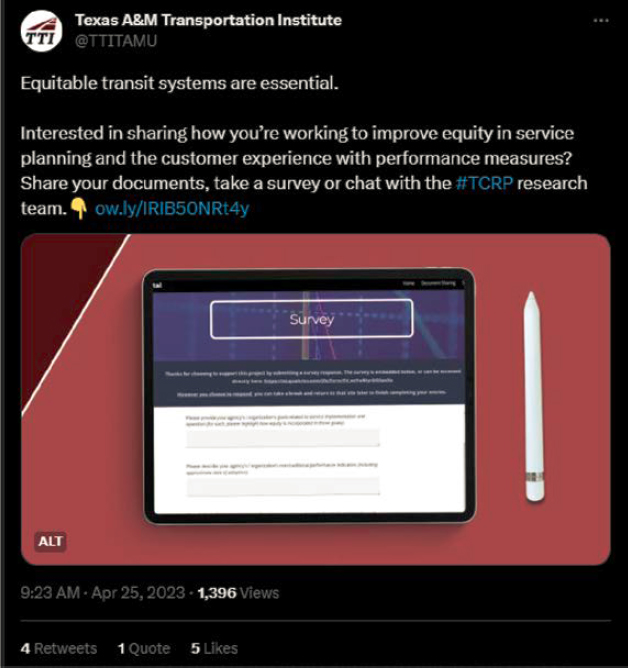
Source: https://twitter.com/TTITAMU/status/1650868060016852994?s=20
Survey/Research Chat Questions
The following series of questions outlines the information to be collected via the survey and chats described above. While this outline does include follow-up questions (e.g., if yes, then _____?), it does not include complete survey logic (e.g., if a respondent responds “yes” then they will see Question X next and if they respond “no” they will see Question Y next) which was be programmed via Qualtrics after the project panel approves the survey outline. In a chat format, the same questions were used to guide the discussion, but the researchers followed up to learn more where/as needed in a manner that cannot be captured in this type of outline.
Defining Equity
For the purposes of this discussion/survey, the following definition of equity in transit should be referenced:
Equity in transit is the fair and just distribution of the benefits and burdens associated with transit services and infrastructure across communities to address the needs of the people in a manner that acknowledges and accounts for historical and current disparities, considers and supports people’s unique circumstances and abilities, and continues to evolve as these factors change. At minimum, transit benefits are presumed to include sufficient access to destinations and opportunities.
- Does this definition align with your how your agency/organization defines equity?
- Yes
- No
- If no: How does your agency/organization define it? [short answer]
- If short answer supplied: Was this definition formally adopted by the governing body or similarly “embraced” officially?
- Yes
- No
- If short answer supplied: Was this definition formally adopted by the governing body or similarly “embraced” officially?
- If no: How does your agency/organization define it? [short answer]
**If a respondent selects “yes” for Question 1 they will be prompted to use the definition of equity in transit presented at the beginning of this section throughout the discussion/survey. However, if they select “no” they will be prompted to use the definition they provide in Question 1.b.i. throughout.**
Current and Potential Non-Traditional Performance Indicators
This section includes questions about non-traditional performance indicators and their relationship to equity-focused goals. A “non-traditional performance indicator” is broadly defined as a metric that can be tracked (e.g., rider perceptions or affordability of a complete multi-modal trip) but which has not been historically used to gauge performance in the transit industry. As equity continues to be acknowledged as a critical aspect of transit service, new methods of gauging levels of equity, via non-traditional indicators, have begun to emerge.
- Please describe your agency’s/organization’s non-traditional performance indicators: [short answer]
- Please provide your agency’s/organization’s goals and describe how equity is incorporated in those goals: [short answer]
- How do the indicators described in Question 2, help your agency/organization track progress towards equity-focused goals?
- How were the goals described in Question 3 established? [short answer]
- What role, beyond mandated requirements, did stakeholders and governing agencies play in establishing the goals described in Question 3? [short answer]
- Has your transit agency attempted to reframe any traditional performance measures (e.g., ridership) for use as an equity indicator?
- Yes
- If yes: Please describe what was done and how it worked. [short answer]
- No
- Yes
- Does your agency/organization track any of these equity-relevant performance measures? (Please select all that apply)
- On-time performance
- If selected: What is your agency’s/organization’s definition of “on-time”?
- Fare categories (e.g., discounted fares for people with low incomes)
- If selected: What categories of fares are tracked?
- Use of mobility device (e.g., wheelchairs)
- If selected: What categories of devices are tracked?
- Other: please describe
- On-time performance
Equity in Planning, Programming, and Operations
Provision of transit service is accomplished in three main phases: planning, programming, and operating. Each phase represents an opportunity to incorporate equity in practices and procedures, and to measure performance. This section includes questions about how your agency/organization incorporates equity in a comprehensive manner.
- How does equity feature in the three key phases of your agency’s/organization’s transit service?
- Planning (ideas for new or updates service): [short answer]
- Programming (the process to take the ideas from paper to implementation): [short answer]
- Operations (day to day to service provision): [short answer]
- How is equity incorporated in your agency’s/organization’s goals (including the process to establish goals)? [short answer]
- How is equity incorporated in your agency’s/organization’s processes (e.g., decision-making or hiring/contracting)? [short answer]
- Is there anything your agency/organization would like to do related to equity in service or customer experience but is not currently doing?’
- Yes
- If yes: If so, what do you want to do and why is not currently being done? [short answer]
- No
- Yes
Data Collection and Management
Performance indicators rely on data; therefore, data collection and management are critical to the success of any indicator. This section includes questions about your agency’s/organization’s current data collection methods and practices.
- What data do you currently collect, regardless of whether it informs performance measures (please describe the type of data, such as ridership, and other pertinent information such as frequency of collection and granularity of data set)? [short answer]
- Does any of the data you collect come from a contracted service provider?
- Yes
- If yes: Please describe what data is collected in this manner and what, if any, data limitations are in place (e.g., some TNCs limit data granularity when providing service data to those they contract to).
- No
- Yes
- Does any of the data you collect come from another public entity?
- Yes
- If yes: Please describe what data is collected in this manner and what, if any, risk there may be that the data could become unavailable.
- No
- Yes
- Is there any data you could be collecting that you are not?
- Yes
- If yes: What data and why is it not collected? [short answer]
- No
- Yes
- Could any of the data your agency/organization (or partner entities) collects be used to tell a story about your riders in a new way (e.g., on-time performance by route by time of day combined with demographics could describe whether folks can reliably commute via transit)?
- Yes
- If yes: What data and what story (or stories) could it tell? [short answer]
- No
- Yes
Responsiveness and Engagement
This section includes questions about your agency’s/organization’s actions to improve services, infrastructure, or the organization itself to improve equity and customer experiences as well as how the engagement process works.
- Has your agency/organization implemented any changes (service, infrastructure/vehicles, or organizational/administrative) in an effort to improve equity and the experience of its customers in the last five years?
- Yes
- If yes: Please describe the changes made [short answer]
- No
- Yes
- What does your agency/organization do, beyond mandated requirements, to engage with customers and learn about their needs? [short answer]
- If short answer supplied: How do the findings from these engagement processes inform equity-related agency initiatives?
- What can you contribute to the conversation around equity (either within the agency or within the city/region) that you aren’t currently being asked for?
- Considering efforts to address equity in transit, what could be done better (and how)?
Challenges
This section includes space to share information about the challenges associated with your agency’s/organization’s experience working to improve equity and the customer experience.
- What challenges did your agency/organization face when establishing equity-focused goals? [short answer]
- If short answer supplied: How were the challenges addressed and what lessons did you learn? [short answer]
- What challenges did your agency/organization face when establishing equity-focused performance indicators? [short answer]
- If short answer supplied: How were the challenges addressed and what lessons did you learn? [short answer]
- If you experience any other challenges you’d like to share, please do so here: [short answer]
Follow-up [Survey Only]
- Would you be willing to schedule a follow-up discussion with a member of the research team?
- Yes
- If yes: Please provide the following information:
- Name
- Title
- Email address
- Phone number
- If yes: Please provide the following information:
- No
- Yes


