Resilience in Transportation Networks, Volume 1: Resilience Case Studies (2024)
Chapter: Section 3: Case Studies
Section 3: Case Studies
3A.1: ARC Vulnerability and Resiliency Framework for the Atlanta Region
Summary
The ARC Vulnerability and Resiliency Framework for the Atlanta regions builds on the FHWA Climate Change & Extreme Weather Vulnerability Assessment Framework, extending it to focus more on transportation-related decision-making. Assessing vulnerability has primarily focused on transportation assets, as previous disasters have demonstrated that transportation network failures significantly exacerbate large-scale disruptions. This exacerbation has shown to be due
to cascading effects resulting from dependencies in the transportation system and illustrating the impact of transportation system resilience on other policy areas.
The framework was used to identify critical assets, facilities, and services in the transportation network, consider the effects of climate change on local environmental conditions, and identify vulnerabilities by scoring their exposure, sensitivity, and adaptive capacity. The anticipation that future conditions will differ from present conditions is central to the analysis, and scenario-based forecasting is used to explore impacts under different assumptions and timescales. A combination of GIS, travel demand modeling, and expert guidance are used to make the assessment. The risk appraisal is then linked to transportation decision-making, including impact on other policy areas, such as public health, through incorporation into other planning efforts and supporting efforts by partner agencies.
Data is the greatest challenge to engaging in a resilience and vulnerability assessment, and a repository of relevant geodata must be created and populated. While existing data sources and tools can be leveraged, substantial data cleaning and correction is necessary before analysis can be performed.
The effort is part of the “100 Resilient Cities” initiative funded by the Rockefeller Foundation, which funded a “Chief Resilience Officer” position for several years in Atlanta, providing an explicitly responsible person for resilience issues and activities. While the foundation funding is not replicable, many practices and procedures pioneered by network members remain applicable in other contexts. Drawing on the experience of other agencies in applying frameworks is very important, as is the existence of formal channels for doing so.
Making the shift toward a resilience-based framework requires changing existing processes and protocols. Guidance for the framework included recommendations for incorporating it into operational processes. Further, having an explicit framework makes it possible to compare transportation policies and initiatives for conformity with resilience principles.
Keywords: risk assessment, data-driven models, institutional capacity, governance, adaptation
Description of Resilience Approach Taken
Development of a framework to: “emphasize the linkage between the results of a vulnerability assessment to the decision-making processes that ultimately define the transportation system through investments and operational changes” (Filosa et al. 2017), leading to:
- Planning goals, objectives, and performance measures sensitive to system resilience
- Comprehensive/modal plan elements in which resilience is an important system characteristic
- Project criteria that provide additional weight to projects that enhance system resilience
- Projects and strategies that enhance resilient system performance
The resilience approach taken was intended to extend the FHWA Vulnerability Assessment Framework beyond transportation system assets to include public health, safety, and economic development. Extending it beyond assets to those functions and systems depends on transportation system network resilience.
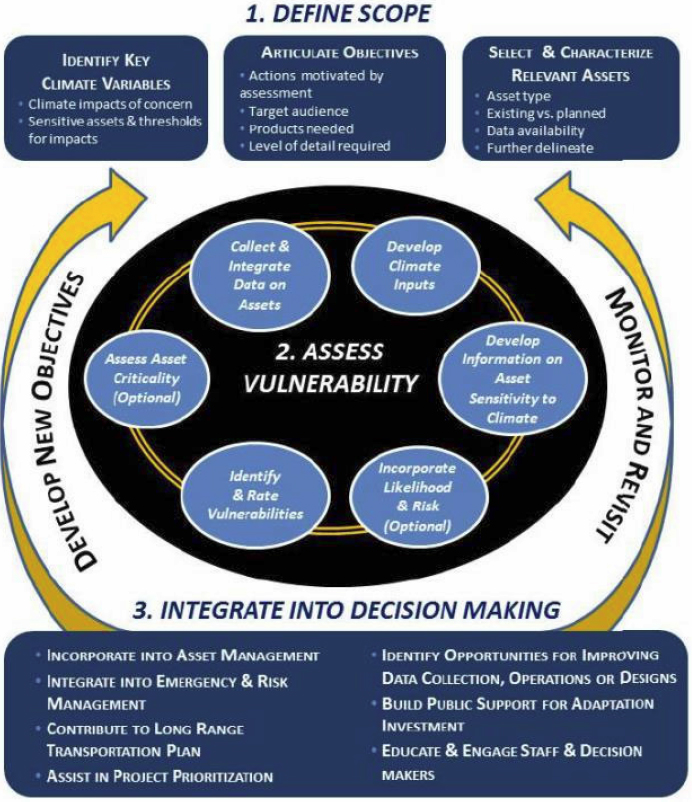
Figure 11: FHWA Climate Change & Extreme Weather Vulnerability Assessment Framework.
FHWA Framework
The FHWA framework on which the ARC’s was based was articulated as having two parts: Part 1) Defining the Scope of the Analysis and Part 2) Vulnerability Assessment. Part 1 has three steps: “1) identifying key climate variables to study, 2) articulating objectives for the assessment, and 3) selecting and characterizing relevant assets to study”; Part 2 assesses vulnerability in terms of sensitivity, exposure, and adaptive capacity (see Figure 11) (Filosa et al. 2017). Sensitivity analysis consists of identifying critical thresholds (such as height or heat tolerance) by working with asset owners. Analysis of exposure is determined through GIS. A combination of raster analysis (heat), elevation (LIDAR data), and tagging was used to identify at-risk assets or assets that had been affected by recent extreme weather events, such as flooding. The need for manual assessment and correction of data was noted. Analysis of adaptive capacity itself had three elements: impact on network function, expected downtime, and replacement costs. Network modeling was suggested to explore network vulnerability, “assumed reconstruction or restoration times are developed for different types of facilities based on previous experiences and close consultation with the asset owners’ and replacement vs. repair costs require consideration” (Filosa et al. 2017).
The framework then suggests calculating a vulnerability score for all assets, with the capacity to provide rankings across the region, analyzed in the entire region by geographic subarea, mode, asset type, or asset owner. The framework also suggested modeling vulnerability across multiple different climate scenarios (weighted more near-term conditions more heavily).
ARC Region Vulnerability and Resilience Framework
The ARC Region Vulnerability and Resilience Framework closely mimics the elements and steps of the FHWA framework but provides a more directive flow of the processes involved and greater emphasis on transportation decision-making and associated linkages. The proposed framework is visually represented in Figure 12.
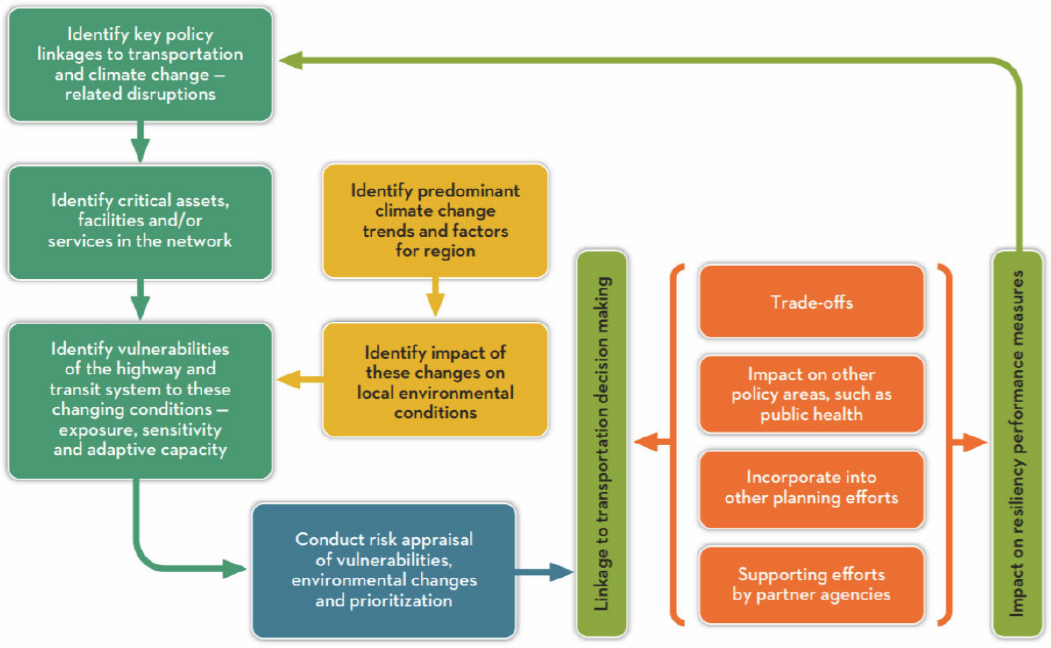
Figure 12: Proposed ARC Readiness Framework.
Essential to the framework is linking risk appraisal (blue in Figure 12) to transportation decision-making (kelly green in Figure 12) and connecting it to other policy areas, supporting partner agency efforts, and incorporating it into other planning efforts.
The scope of the intended function of the resilience approach is essentially one of contingency planning, identifying what might go wrong and the necessary actions to take when things do. Its sophistication lies in methods used to assess which things might go wrong by using the universe of infrastructure present in GIS data and estimating infrastructure importance in system function.
The anticipated benefits of the approach lie in preventing potential future harms through risk reduction and readiness. A vulnerability assessment enables an agency to make appropriate investment decisions and appropriate institutional preparations by estimating both chances of failure and consequences.
Implementation costs of the ARC Vulnerability and Resiliency Framework for the Atlanta Region are difficult to assess. It represents merely the most recent phase of a process begun in 2013 as part of the “100 Resilient Cities” initiative, which included a “Chief Resilience Officer” staff position funded by the Rockefeller Institute. This initiative continued with the Transportation System Vulnerability & High-Level Risk Assessment, a specialized LRTP element funded for about $175,000 (Atlanta Regional Commission 2020). The total program has been in operation for over six years and is ongoing.
The data, computing, and analytics costs are difficult to state because much of the data and computing/analytics capacity were pre-existing within the Atlanta Regional Commission. For example, scoring the criticality of roads and bridges requires the application of an existing travel demand model. GIS capable of hydrological modeling was necessary, but the USDOT Vulnerability Assessment Scoring Tool (VAST) provides a way to assess vulnerability (Filosa et al. 2017). An essential part of the ARC Vulnerability and Resiliency Framework for the Atlanta Region was delivering a series of recommendations on necessary actions and policy changes to implement the framework. Hence, the process is ongoing, as are the tasks.
Critical Assessment of Success or Challenges of Approach
Continuation is the fundamental measure of policy success. Atlanta remains active in resilience-related research, recently selected to participate in a Growing Convergence Research project introduced by the National Science Foundation to enhance urban resilience to extreme climatic events (Georgia State University 2020). It is possible that the ARC Vulnerability and Resiliency Framework has been a successful element in the ARC region’s resilience planning efforts.
Key success factors in this approach included extending an existing resilience framework and using the FHWA framework as the base, ensuring a common understanding with state transportation agencies. The extension of the framework to locally important issues was an influential factor. Also, the development of the framework made it possible to move beyond existing paradigms, such as “reliability” and peak-hour travel-time regularity metrics, toward a framework capable of incorporating extreme events and non-standard conditions in decision-making.
The primary challenge in developing and applying a vulnerability and resilience framework lies in the data, computing, and analytics requirements. A repository of relevant geodata must be created, populated, and maintained. Analytical capacity must be obtained, either by repurposing existing capacity or finding funding for additional capacity. While an increasing amount of geodata are publicly available, most data require enrichment by additional attributes before they can be effectively used.
Replicability of The Approach for Other Agencies
The core element of the approach is developing a resilience framework, which provides an explicit frame for understanding and discussing resilience in the preparedness, response, and recovery/adaptation phases. This approach is assessed to be a replicable and practical approach.
In contrast, the funding that made this possible is much less replicable. In 2013, the Rockefeller Foundation pioneered an initiative known as “100 Resilient Cities” “to help more cities build resilience to the physical, social, and economic challenges that are a growing part of the 21st century” (Rockefeller Foundation, 2020). The “100 Resilient Cities” initiative funded 80 global cities, including several major cities in America. Atlanta applied and was selected. Program sponsorship enabled hiring a “Chief Resilience Officer” and provided access to partners, technologies, and services necessary to develop a robust resilience strategy. The “100 Resilient Cities” initiative also established a network to share resilience approaches.
However, future resilience work has been made easier by the capacity to draw upon prior work by the cities in the “100 Resilient Cities” initiative. In the near term, the Rockefeller Foundation continues to fund “Chief Resilience Officer” positions. So, it remains possible in the near term to directly contact such key persons in developing resilience frameworks (Cities Today, 2020) for organizations interested in doing so. In the long-term, two successor organizations carry on the mission: the non-profit Resilient Cities Catalyst (https://www.rcc.city) and Global Resilient Cities Network (https://www.rockpa.org/project/global-resilient-cities-network).
Some of the practices pioneered by the “100 Resilient Cities” initiative is replicable, such as creating an executive-level post (“Chief Resilience Officer”) capable of directing focus within city governance. The core of the success of the “100 Resilient Cities” initiative was networking with other cities to discover reliant approaches.
The above elements may represent a clear limit to replicability beyond the executive branch of big cities. Effective replication would require drawing on state transportation agency-relevant aspects of city operations practices, such as vulnerability assessments. To replicate the framework and associated processes, state transportation agencies can leverage document resources from city resilience networks and cities to develop their own frameworks and plans. Likely, several state transportation agencies are already engaged in resilience practices, but a coordinating entity to provide collaboration between agencies is lacking, impairing the dissemination of effective practices. The presence of a coordinating entity (the Rockefeller Foundation) and dedicated personnel (Chief Resilience Officers) was central to the “100 Resilient Cities” program. AASHTO’s Resilient and Sustainable Transportation Systems Technical Assistance Program may be able to fill part of this need (AASHTO, 2020).
Key Takeaways
Assessing vulnerability is essential to resilience and a core part of preparedness activities. Assessing vulnerability has primarily focused on transportation assets, as previous disasters have demonstrated that transportation network failures significantly exacerbate large-scale disruptions. Effective emergency response and relief require functional transportation and communication systems, because when those systems fail, the emergency response system fails.
Large-scale regional disruptions build the political will to engage in resilience activities and to privilege them. In the past decade, Atlanta has faced the worst winter storm in city history, a tropical storm, tornadoes, and flooding. Changing climatic conditions are generating increasingly extreme heatwaves and rainfall, with concomitant drought and flooding.
A systems resilience focus in the transportation planning process emphasizes the reliability of the transportation system rather than just efficiency. It suggests a need for safeguards to protect the transportation system and its users. A systems resilience focus considers the importance of dependencies and cascading effects in the transportation system and the implication of transportation system resilience to other policy areas. Together, this suggests the importance of institutional connections and coordination. A systems resilience focus also acknowledges change and considers future projected weather patterns in the decision-making process.
3A.2: Climate Ready Boston
Summary
The city of Boston generally takes its vulnerability to climate change seriously, especially its vulnerability to rising sea levels, and finds its existing defenses will likely be insufficient in the coming decades. The city has spent time analyzing and quantifying the risk by mapping the zones of risk and structures/infrastructure at risk and the likelihood and timescales at which those risks will occur. New conditions will generate new risks, such as new flood inflow points, and reduce existing solutions, such as high sea levels preventing outflow. Solving the problem requires public investment in both gray and green infrastructure and retrofits of private property. Even maintaining the status quo requires substantial investment, but cost-benefit analysis suggests doing so is preferable. Getting the money (federal, state, developers, investors) through financing and funding (taxes, fees, partnerships) to pay for the financing is discussed, including some novel state-specific initiatives.
Keywords: flood, sea-level rise, risk assessment, preparedness, data-driven models
Description of Resilience Approach Taken
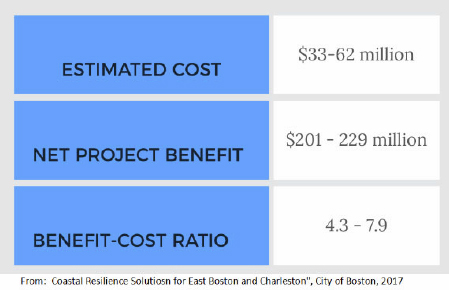
This resilience approach is best described as preparedness in a risk reduction and readiness sense. The approach intends to identify long-term risks and plan to take long-term actions to ameliorate long-term risks. The implementation cost of risk identification and making mitigation plans were minimal, with the cost of implementing the identified solutions running from a few million to half a billion dollars (City of Boston, 2016). These costs were set against the value generated by the suggested improvements, providing a rough cost-benefit analysis of risk reduction in the case of flooding, and identifying benefits to existing public infrastructure such as fire stations (see Figure 13).
In response to the challenge of climate change, including flooding, snowstorms, and hotter summers, the Climate Ready Boston initiative was intended to produce a systemic and comprehensive framework. This framework was developed working with local climate scientists, engineers, planners, and designers to identify vulnerable locations and engage in changes to promote resilience (City of Boston, 2016).
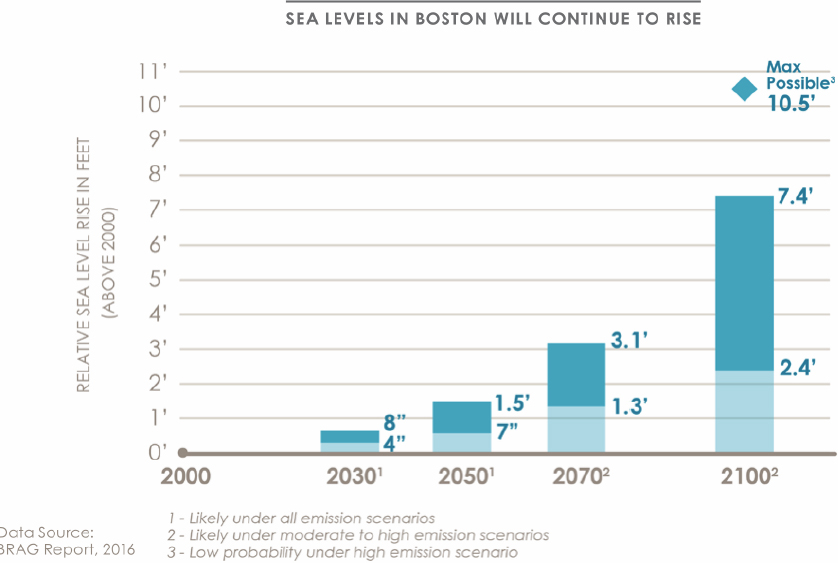
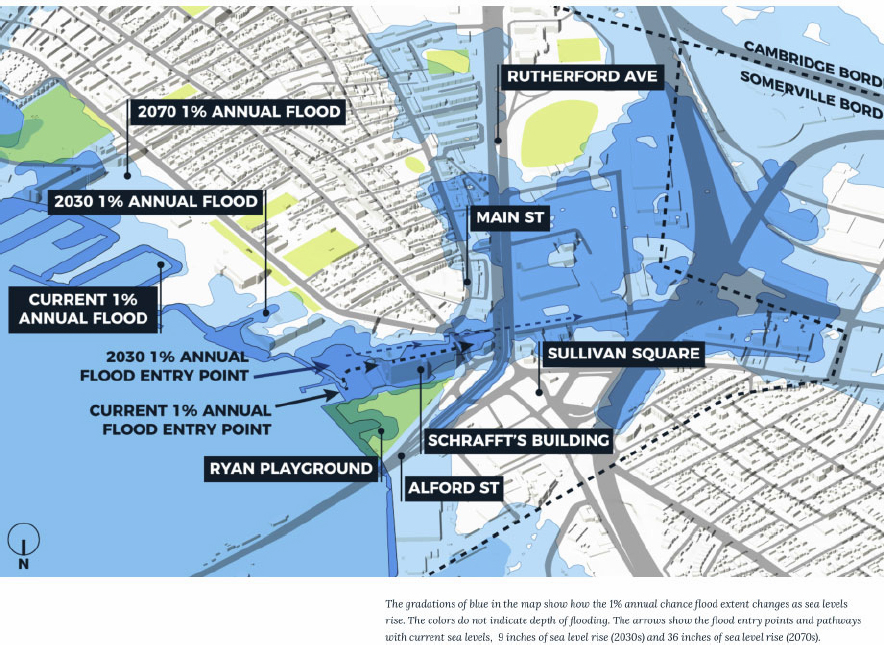
Expected impacts of climate change included increased extreme precipitation and increased sea-level rise. Climate change is generating stronger, wetter storms, resulting in higher storm surge levels on top of the baseline sea-level rise, causing additional flooding with greater frequency (see Figure 14).
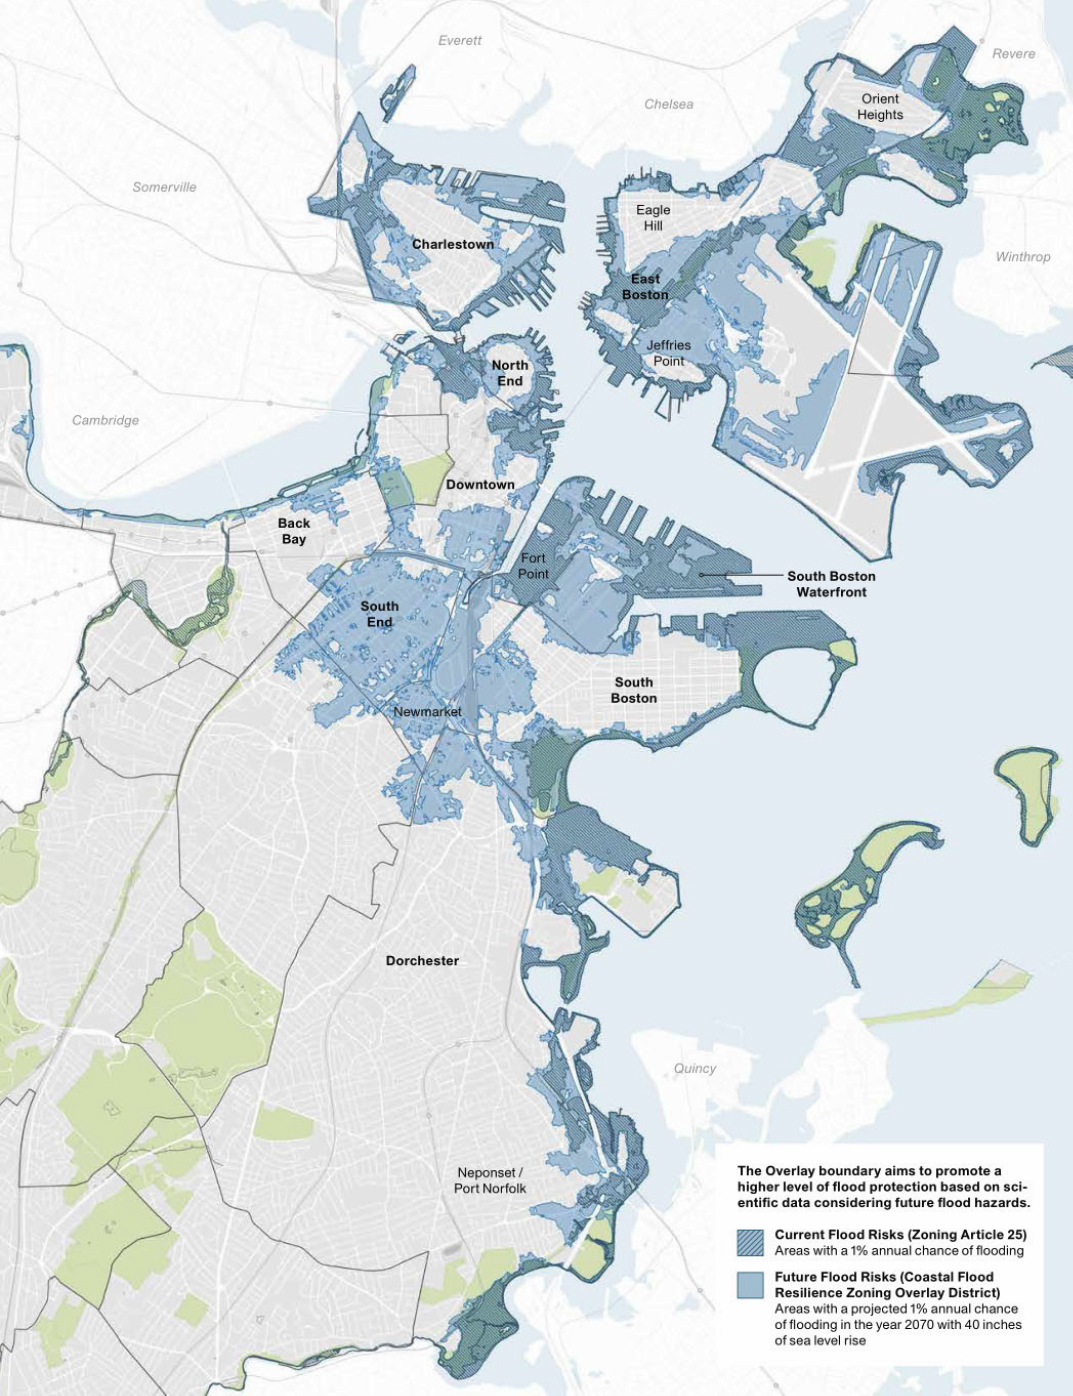
Buildings and land areas thus exposed to stormwater flooding are identified and quantified for several forecast periods (2030, 2050, 2070, 2100) and mapped (see Figure 15). This process revealed that 10% of the existing buildings would be exposed to coastal and riverine flooding, 5% flooding at high tide, and 25% during severe events (City of Boston, 2017).
Climate Ready Boston developed a detailed asset inventory by combining over a hundred data sets. It also identified interdependencies between different assets and amenities, individual and systemic vulnerabilities, and existing resilience measures. Both fixed guideway transit and major roads are essential public facilities identified as vulnerable. Those that are transit-dependent were found vulnerable to disruptions to the fixed guideway transportation network (City of Boston, 2016)
Other particular vulnerabilities included rail impairment due to high temperatures and roadway buckling on asphalt roads experiencing sub-surface moisture. Stormwater vulnerability was predicted to most likely increase due to outfalls being unable to discharge because of higher sea levels, with effects concentrated in low-lying areas and areas with poor drainage. Underground transportation infrastructure was understood as special risk (City of Boston, 2016).
The planned adaptive approach is to improve flood defenses, create resilient infrastructure, and adapt existing buildings to changing conditions through local planning, mitigating flood risk, and making coordinated infrastructure investments. Providing financial, technical, and insurance assistance was also suggested. Specific initiatives included evaluating the current flood insurance market, engaging in better flood-risk ratings, and advocating for changes in the National Flood Insurance Program. Currently, insurers underestimate the risks of extreme storms and associated disruption due to communication, power, and transportation failures.
A framework of strategies and related initiatives is laid out. Resolution actions are identified as short, medium, and long-term. Suggested actions included providing temporary flood barriers, “green” infrastructure such as flood-resilience parks and amenities, and district-scale protections. Other proposed actions include education and readiness training, local planning efforts, infrastructure investment prioritization frameworks, re-zoning, and preparation of municipal buildings.
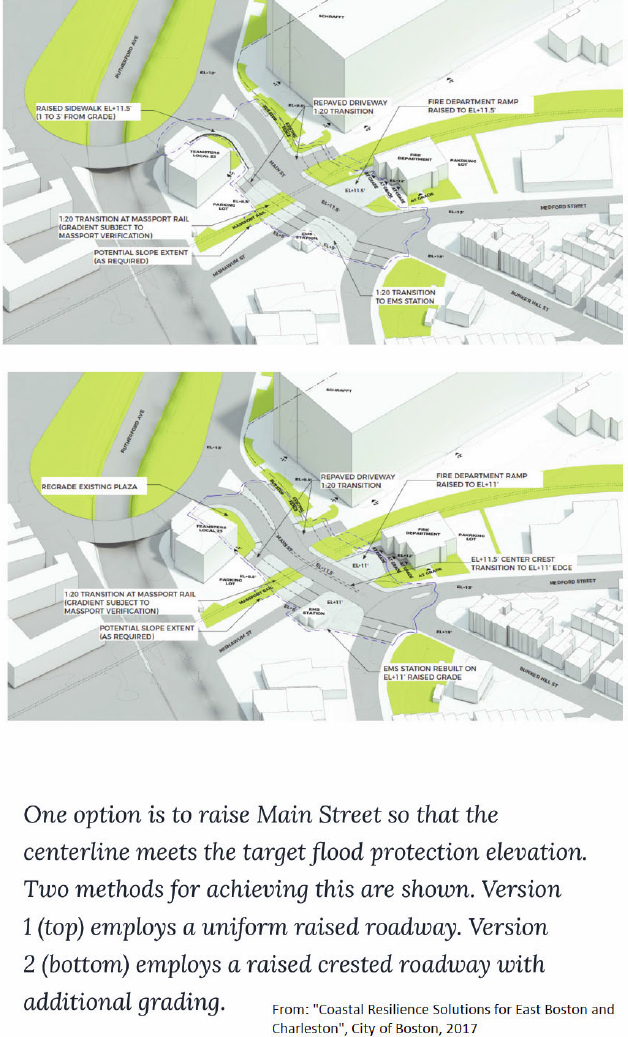
The analysis is based on focus areas, providing district-specific analysis and planning recommendations. The district-specific research also includes a written analysis of impacts and mapping that identifies flood pathways, locations, and depths and identifies vulnerabilities where existing dams/barriers could be overtopped and how the flooding of some facilities could overflow into nearby areas. The study also analyzes changes in impacts over time. For example, 0.7’ in 2030 might become 4.4’ in 2070, transforming a nuisance into a major destructive event. While reinforcing existing flood pathways is suggested, the need for new infrastructure is diagnosed when estimated rising sea levels show new, additional flood pathways being created. Planned actions include elevating small sections of some roads in partnership with the state DOT. Long-term needs suggest a new system of elevated parks and walkways to provide new open space and waterfront access to create sufficient elevations along the shore to act as barriers to predicted 2070 sea levels. Activities in combination with private development are suggested as a funding mechanism. Bunding with scheduled improvements to parks and roadways is also recommended. Potential design solutions were detailed (see Figure 16). Regulatory changes to zoning, coastal zone management, and other regulatory tools were also suggested (City of Boston, 2017).
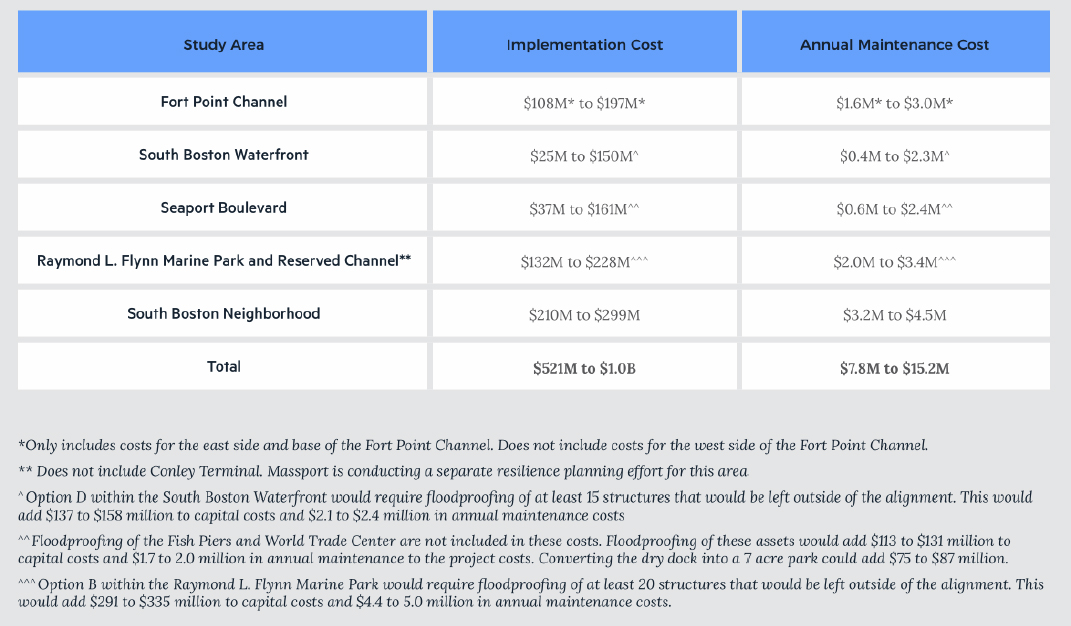
Analysis was done iteratively, with different districts done in different years and providing different outputs for different districts. A later implementation provided annual maintenance costs associated with improvements (see Figure 17) (City of Boston, 2018).
Some proposed investments, such as a harbor barrier, run into billions of dollars, with expected completion timelines after 2050.
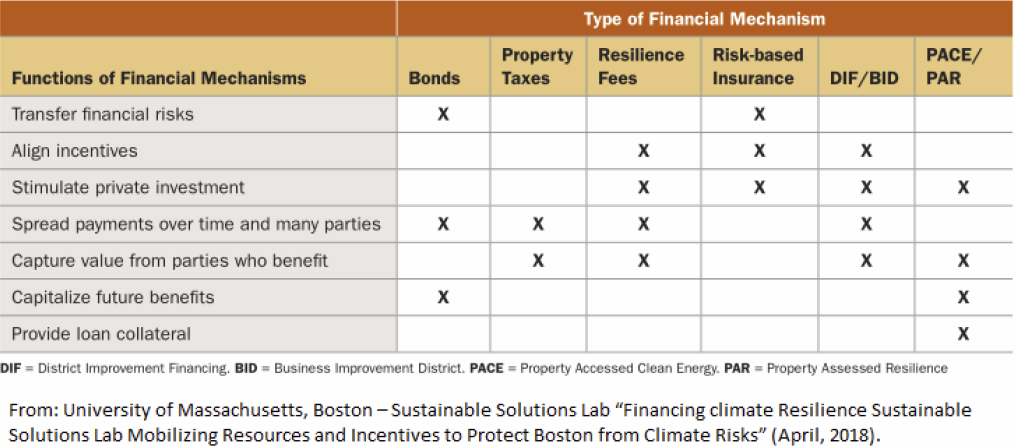
Further analysis extends the definition of resilience beyond risk reduction to include improved emergency response and disaster recovery capacity by ensuring the reliability and continuity of essential services, government agencies, and critical businesses. It also includes pre-distancing financial preparation through insurance or catastrophe bonds. Catastrophe bonds, paying out a set amount when set conditions are met, ensure against risk, trading a stream of payments against a potential windfall in a disastrous situation. Other financial mechanisms considered include bonds, tasks, fees, insurance premiums, District Improvement Financing, Business Improvement Finance, and assessed fees/tax on resilience (see Figure 18) (University of Massachusetts, Boston 2018).
Further suggestions also included revenue-backed bonds using money from local open-space funding initiatives, increased gas taxes, and funding from a Regional Greenhouse Gas Initiative, district-level financing regimes making use of tax-increment financing, and Business Improvement Districts. More novel recommendations include a “District Resilience Improvement” apportioning assessment based on risk and property value and negotiating funding from non-property tax paying entities such as utilities and transit providers. The potential was identified for establishing a stormwater utility charged with providing stormwater service, collecting a fee as a surcharge on water/sewer billing in proportion to runoff generated, within mitigating reductions for green infrastructure or on-site retention. Community Facilities Districts in California are suggested as a model. The Infrastructure Investment Incentive Program, a Massachusetts-specific program, provides funds from RDA bonds during construction for private development and then relies on local assessments to repay the bond. This arrangement is highly suitable for developing infrastructure associated with new development.
The use of “linkage” fees is suggested for parcel/building level financing by first mandating infrastructure associated with development but permitting payment into a linkage fund instead of their direct provision. Boston currently uses such a system to fund affordable housing. “Green Bonds,” such as those issued by Connecticut Green Bank, offer zero-interest loans for energy-efficient upgrades, repaid through a small surcharge on future electricity bills, thus providing retrofit capacity to persons and organizations otherwise lacking in financial ability (Wong, 2019). Connecticut also offers the Shore Up CT program, providing home retrofit loans to elevate homes in danger of flooding. Property Assess Clean Energy (PACE) has been used to finance energy retrofits, with repayment ensured through a lien on the building. It is identified as being suitable for multifamily properties or community development corporations. Adapting such arrangements to “Property Assessed Resilience” has occurred in Florida and San Francisco, CA. In California, “Community Facility Districts” offering non-FEMA insurance for perceived over-priced risks have been suggested, matching the insurance with fees to provide premiums.
FEMA provides flood insurance to many jurisdictions but underprices risk to maintain affordability (Wong, 2019). However, it provides a mechanism for communities to obtain lower premiums (up to 45%) by engaging in activities that reduce flood risk for public information and mapping, zoning and building regulation, flood damage reduction, improved drainage systems, floodplain management, and other activities. Only a small fraction of communities participates in this program.
As addressed previously, catastrophe bonds, paying out a set amount when set conditions are met, ensure against risk, trading a stream of payments against a potential windfall in a disastrous situation. The Metropolitan Transit Authority (MTA) of New York maintains a fire and earthquake bond to guard against storm surges and earthquake events. Another insurance-like bond known as a “contingent bond” transfers project underperformance risk to outside investors, providing a hedge in case projects intended to improve resilience fail.
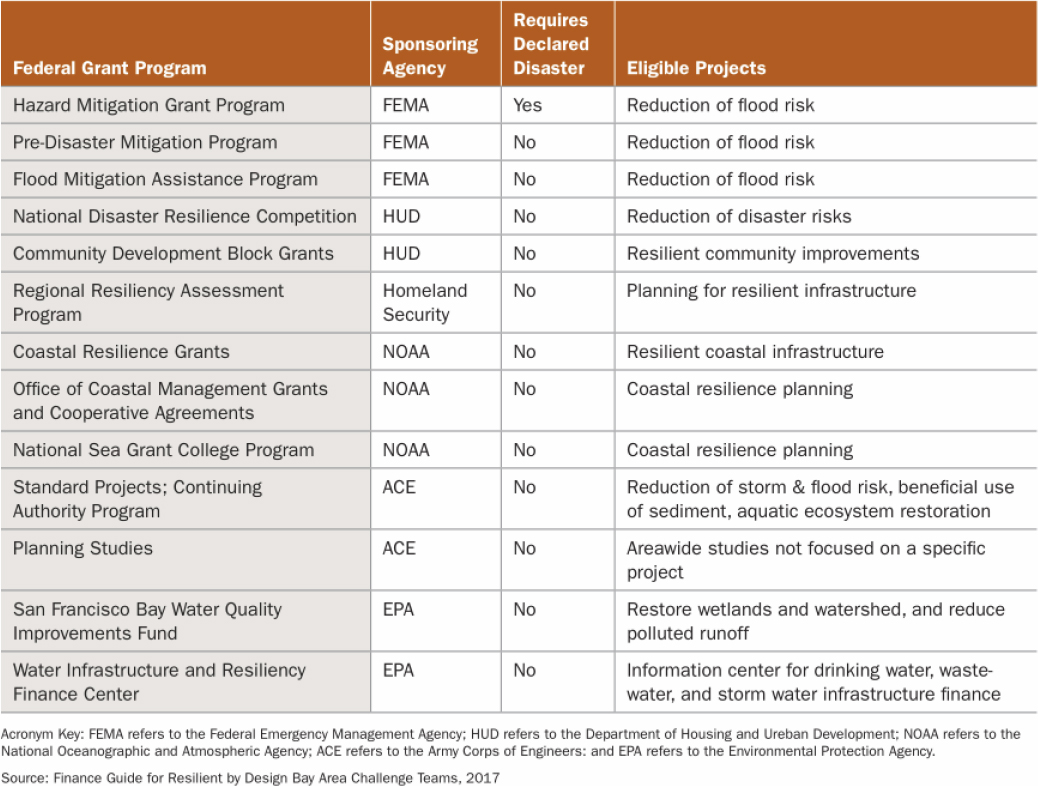
Numerous federal programs offer grants or funding for risk reduction activities detailed in Figure 19 (Resilient Bay Area, 2017).
Critical Assessment of Success or Challenges of Approach
Climate Ready Boston seems to be an effective program for identifying and quantifying risks associated with sea-level rise, coming up with solutions, making plans to implement them, and identifying potential actions necessary. It offers an effective and practical blueprint other communities can follow while engaging in their resilience planning. The approach also uses scenario-based forecasting, providing high-medium-low impact scenarios to assess the bounds of best-case, worst-case, and median outcomes rather than using a single average value for forecasts. The program assesses what is likely to flood, how likely it is, and the costs and benefits of preventing it.
The primary limitation of the approach is that it is primarily a scoping activity, identifying potential actions rather than a planning and implementation process designed to effect change actively. However, this is a reasonable and almost inevitable limitation, given the scale (both temporal and spatial) of the major infrastructure investments necessary to retrofit a small low-lying seaside community to the challenge of sea-level rise. Also, in accordance with the scale, the approach focuses on prioritizing infrastructure investments and matching them with a timescale when needed. For example, half a foot of flooding in 2030 may not require a major multi-billion-dollar harbor barrier, while a four-foot rise in 2070 likely will. The approach also recognizes that the necessary infrastructure will be expensive and provides alternatives for financing the construction and potential novel funding resources available to different levels of government.
In implementation, timing is essential. One theme throughout the report is local floods or disasters occurring either recently or within living memory, emphasizing their potential to increase in severity or frequency. Another theme is the harm of failing to act and how existing infrastructure or structures might be compromised or damaged, resulting in preventable repair costs.
Climate Ready Boston represents a substantial investment in analytic capacity to determine risks and readiness. However, it also represents an investment in brainstorming, presenting potential solutions, and providing cost estimates for those solutions. This investment implies several hundred thousand dollars in either staff or consultant time for analytics and presentation of the results for data assembly and computing, as well as leveraging existing partnerships with educational institutions. The challenge in implementing this approach lies in obtaining or constructing the institutional relationships and technical capacity necessary to carry it out in an effective way. This challenge may make the method unsuitable for application outside major metropolitan areas. The geographic scale of analysis would also likely sit poorly with state transportation agencies attempting to provide coverage of their entire jurisdiction rather than topical and context-dependent application to a limited number of small areas. Figure 20 shows the general area of analysis, including sub-areas. (Boston Planning and Development Agency, 2010).
Replicability of the Approach for Other Agencies
The modeling approaches used to identify locations with increased vulnerability to flooding due to sea-level rise can be replicated using existing GIS tools. Identifying low-lying areas prone to flooding and future inflow points provides an alternative mechanism to FEMA flood maps, which identify only present flood conditions and cannot evaluate future flood risk resulting from changed conditions.
The replicability of the climate resilience funding/financing revenues proposed in a different context is variable. Some funding/financing options are specific to Massachusetts or the city of Boston. Others rely on institutional capabilities unique to Boston or Massachusetts (such as MIT and grants from wealthy family foundations) that are difficult to duplicate.
However, much of the work was accomplished through contracts with private consultants, further matched with in-kind services from the Boston Planning Department and the Boston Environmental Department. The project steering committee included a traditional mix of city departments, nearby cities, and transportation agencies (DOT, Port Authority, Tolls, Transit). It also included many non-governmental organizations and neighborhood associations that helped engage with stakeholder communities. Jurisdictions would need to build working relationships with similar organizations ahead of time or stimulate the creation of such organizations to leverage such a resource
Regarding state-specific assets, the basis of the Climate Ready Boston analysis identifying the flood pathways in East Boston and Charlestown is the Boston Harbor Flood Risk Model developed by the Massachusetts Department of Transportation. The asset is replicable using existing GIS tools but requires specialized knowledge and skillsets. The analysis also leverages graduate student work from at least two institutions (MIT and UMASS Boston). The capacity to generate specific solutions for identified climate risks is impressive but requires substantial resources. While not suitable for all jurisdictions, the course of action undertaken by Boston offers lessons for other major metropolitan areas. The resources developed for Boston to explain funding and financing options can be applied elsewhere, even if at a lower level of sophistication or reduced scale if needed. It is worth noting that developing coastal resilience solutions for Boston is an iterative process, done across multiple districts over time rather than region-wide, hence reducing peak effort, ensuring that deliverables remain timely, and allowing for learning to occur throughout the process.
Key Takeaways
Effective resilience planning requires effective risk assessment of previous and newly emerging risks based on changing conditions. Risk assessment also requires systemic and contingent risk assessment to evaluate the consequences of system failure, and the spillover impacts as one system affects another. The level of specificity needed to do so effectively forbids a region-wide or even citywide application of the methodology. The case shows the value of an ongoing campaign of risk assessment for different communities, carried out incrementally not to overwhelm staff capacity or exhaust participating partners. The use of quantitative metrics is also found to be a key success factor. Effective implementation requires a combination of building risk reduction into ongoing maintenance activities and new infrastructure investments to defend existing development. Inevitably, this requires retrofitting of both public infrastructure and private property.
In some cases, private funds can be leveraged for the former through public-private partnerships. In other cases, public financing can be used for private benefit through bond and loan programs. In many cases, the financial capacity to fund retrofits is limited due to a low return on investment, and the cities may need to profit on loans in the form of reduced risk. While the majority of actions suggested relating to risk reduction, risk reduction can be considered a pre-emptive form of damage mitigation, reducing harm and disruption in the event of a disaster and thus speeding recovery in a post-disaster context.
3A.3: Cyberattack Disruption Case Study
Summary
“COPENHAGEN– Shipping giant A.P. Moller-Maersk, which handles one out of seven containers shipped globally, said the Petra cyberattack had caused outages at its computer systems across the world on Tuesday.” (Reuters - June 27, 2017)
“Texas struck by two ransomware attacks in one week - The Texas Department of Transportation was hit with a ransomware attack last Thursday, marking the second ransomware incident on a state agency in less than a week.” (TechTarget – May 18, 202)
Cyberattacks disrupt private or government infrastructure by gaining and controlling information technology (IT) systems. Cyberattacks are a growing threat to transportation infrastructure networks increasingly managed and linked through technology. The 2017 NotPetya attack on A.P. Moller-Maersk was estimated to cost the company $200 - $300 million affecting not only its container shipping but also tugboat operations, oil and gas production, drilling services, and oil tankers. The attack has now been traced to the Russian military, costing the European subsidiary of Fed Ex, TNT Express, approximately $400 million, and the pharmaceutical giant Merck over $800 million. A White House assessment put the total cost of the NotPetya attack at roughly $10 billion in damages (Wired, 2018).
More recently, Texas state government networks were attacked. In August of 2019, IT systems for the state’s court system, TxDOT, and over twenty city governments were hacked over two weeks. Louisiana schools and the city of Baltimore also reported cyberattacks in 2019. Cyberattacks can be conducted by individual hackers, foreign governments, or hostile state actors. The research identified two prevailing types of cyberattacks that can affect transportation networks.
- Ransomware attacks use malicious software to disable networks, shutting down IT systems until a ransom is paid, and the motivation is usually financial gain.
- Malware attacks use software specifically designed to disrupt, damage, or gain unauthorized access to a computer system and are most often motivated by the desire to cause chaos, usually for political gain.
In the case of the NotPetya attack, Maersk initially reported that the attack included a ransom to be paid in Bitcoin. Maersk did not pay the ransom, and it was later discovered that the damage done by NotPetya was irreversible. Security experts believe the true motive was to
target anyone doing business with Ukraine, using malware distributed via a popular tax accounting software.
The in-depth review of the 2017 NotPetya attack by Wired Magazine concluded that “the most enduring object lesson of NotPetya may simply be the strange, extra-dimensional landscape of cyberwar’s battlefield.” Cyberattacks do not conform to traditional geopolitical boundaries. While most cyberattacks have been terrestrial, the potential exists to target satellite communication systems, which could have huge implications for transportation networks, including impacts from disabling GPS and cell phone networks.
At a recent cyber fraud conference, the head of Maersk’s cybersecurity unit emphasized that both internal and external communication remain one of Maersk’s biggest challenges. The company took the stance of being entirely open and honest with customers about the NotPetya attack. The company was praised for its willingness to communicate quickly and reliably, providing updates at regular intervals via its social media channels to keep customers and investors informed.
Keywords: cybersecurity, cyberattack, network
Information Sharing Analysis Centers- A Broad Communication Response to Cyber Threats
Information Sharing Analysis Centers (ISACs) are a U.S. strategy against cyber threats organized by industry to facilitate information sharing between public and private sector groups. ISACs help critical infrastructure owners and operators protect their facilities, personnel, and customers from cyber and physical security threats and other hazards. ISACs collect, analyze and disseminate actionable threat information to their members and provide members with tools to mitigate risks and enhance resilience.
There are 24 ISACs organized under the National Council of ISACs, of which four are specifically centered around the transportation industry:
- Surface Transportation, Public Transportation, and Over-the-Road Bus ISAC
- Aviation ISAC
- Maritime ISAC
- Maritime Transportation System ISAC
In addition, a multistate ISAC is dedicated to disseminating information to state agencies in general. An ISAC specific to state department of transportation operations was not identified.
American Trucking Association
The American Trucking Association (ATA) participated in an interview to discuss an ISAC it led. Ross Froat, Director of Technology and Engineering Policy at the ATA said the trucking industry had not seen any specific pattern regarding who may be the target of an attack. The ATA has developed Fleet CyWatch, which works with other ISACs like the Surface Transportation, Public Transportation, and Over-the-Road Bus ISAC. However, one must be a member of ATA to join CyWatch.
It is prudent for state departments of transportation to develop their own ISAC, especially in the emerging Connected and Automated Vehicle (CAV) environment. As transportation networks use technology to become more sophisticated and efficient, they also become more vulnerable to cyberattacks.
AP Moller-Maersk
AP Moller-Maersk is one of the biggest shipping companies in the world, controlling around 25% of the world’s shipping capacity. It operates 800 seafaring ships out of 343 ports serving 121. On June 27, 2017, the Maersk network was hacked. Maersk computer screens froze, and a message in red and black lettering appeared. Some messages read “repairing file system on C:” warning operators not to turn off the computer, while others read “oops, your important files are encrypted.” The hack affected computers across Asia and Europe, and the perpetrators demanded $300 worth of Bitcoin to decrypt the files.
The malware used in the attack was developed as a disk-wiping cyber weapon by the Russian military and assisted by a leaked version of the NSA’s EternalBlue hacking tool. Eventually, it was determined that NotPetya’s target was not actually ransom but businesses in Ukraine. However, the malware quickly got out of hand and soon spread worldwide, taking down networks and causing billions of dollars in damage and lost revenue.
Impact on Maersk
The NotPetya cyberattack on Maersk,
- Destroyed nearly 49,000 company laptops,
- Destroyed all print capability and rendered file share as unavailable,
- Disabled its entire network of VoIP phones,
- Destroyed 1,000 applications and rendered 1,200 inaccessible,
- Destroyed 3,500 out of 6,200 servers, and
- Cost the company $250-$300 million.
Maersk Reaction and Remediation
As soon as the attack was confirmed, the company’s IT staff immediately ran into employee offices, telling them to turn off computers or disconnect from the network. It took more than two hours to disconnect Maersk’s entire global network. The company identified servers in Lagos, Nigeria, which had not been connected to the global network due to a local power failure. These servers were carefully transported to world headquarters in Denmark, and the organization’s directories could be recovered from there.
Senior leadership at Maersk decided to be as transparent as possible about what had happened. Using the clean software from the servers in Nigeria, IT teams moved quickly, using reverse engineering, to design and build new machines more resilient to cyberattacks. The company quickly built 2,000 new laptops within nine days of the attack by using this technique, and after four weeks, all 49,000 laptops had been rebuilt.
Description of Resilience Approach Taken
The concept of ISACs was introduced and promulgated under Presidential Decision Directive-63 (PDD-63), signed May 22, 1998, after which the federal government asked each critical
infrastructure sector to establish sector-specific organizations to share information about threats and vulnerabilities. There are 24 ISACs organized under the National Council of ISACs, including a multistate ISAC dedicated to disseminating information to state agencies. There are ISACs centered around the transportation industry:
- Surface Transportation, Public Transportation, and Over-Road-Bus ISAC,1
- Aviation ISAC,
- Maritime ISAC, and
- Maritime Transportation System ISAC.2
Information Sharing and Analysis Centers (ISACs) help critical infrastructure owners and operators protect their facilities, personnel, and customers from cyber and physical security threats and other hazards. ISACs collect, analyze and disseminate actionable threat information to their members and provide members with tools to mitigate risks and enhance resilience.
ISACs have successfully provided operational services that protect critical infrastructures, such as risk mitigation, incident response, and information. Other ISAC services include annual meetings, technical exchanges, workshops, and webinars.
Most ISACs have 24/7 threat warning and incident reporting capabilities and may also set the threat level for their sectors. Many ISACs also have a track record of responding to and sharing actionable and relevant information more quickly than government partners.
Key Takeaways
Because there is no “zero cyber risk environment” cyber security planning is shown by the case to be essential for sustaining network operation and security. In the case, it is clear that prevention and early detection is the most effective counter-measure for a cyber-disruption. The case also points to the importance of Privileged Access Management (PAM) to vital systems. PAM is a system that manages all the system access/restriction within existing active directory in a company. Unlike a superuser scenario, where a user (system admin) who has all the access, this system forms a layer between any user and his capability to access all the servers. for instance, the individual entities in the network can have a separate password and PAM will manage those, thus in case if the superuser credential is compromised the attacker does not have access to all servers and networks. A staff member points out that “Had Maersk have PAM, the impact would have limited to 5000 computers, not 55,000.” Other key findings point to the importance of regular cyber security risk assessments and coordination between state, regional and private sector partners in monitoring and reporting disruptions.
__________________
1The ATA has developed Fleet CyWatch that works together with the SURFACE TRANSPORTATION, PUBLIC TRANSPORTATION AND OVER-THE-ROAD BUS ISAC. However, you must be a member of ATA to gain access to participate.
2Maritime ISAC is focused on maritime security and Maritime Transportation System ISAC is focused on cybersecurity within the maritime industry.
3A.4: EPA / Rhode Island Community Planning Framework
Summary
“Planning Framework for a Climate-Resilient Economy” is a report from the U.S. EPA which includes input from the state of Rhode Island (RI). It develops a framework for planning for resilience, and the report gives local governments and stakeholders guidance concerning how to develop and implement this planning framework.
Throughout the document, examples and applications for North Kingstown, RI, are presented. Planned implementation in North Kingstown was sidelined by the election of a new Town Council. But numerous other examples from all over the U.S. are included. The framework is oriented toward the entire local economy, discussing planning and projects for transportation facilities and economic components such as commercial establishments and utilities.
This framework will likely be useful to localities looking to initiate or improve climate resilience efforts, and it is suggestive of how major stakeholders can work together. In most cases, the planning framework will not have a dedicated funding source, nor is the framework currently required by federal or state law. However, it provides guidance for handling threats that may become more serious in the coming years.
In terms of assisting the application and success of the planning framework, federal and state governments may be able to do more by documenting and tracking the success of such local efforts throughout the country. Federal and state governments may also help local efforts by providing technical assistance with GIS analysis, climate modeling, and other information technologies.
Keywords: land use, recovery, climate change, FEMA, drought
Description of Resilience Approach Taken
“Planning Framework for a Climate-Resilient Economy” (EPA, 2016) helps communities prepare for and mitigate major setbacks from natural disasters. It is intended to help local government agencies, businesses, and non-profits plan, prepare and coordinate their efforts in the face of various climate-related and natural disaster threats. The U.S. Environmental Protection Agency (EPA) Office of Sustainable Communities developed the framework. Evidence of climate change and the threat of increased climate change motivated the project.
To assure the framework’s applicability to communities, the EPA worked with the Rhode Island Division of Planning and the town of North Kingstown, RI. The report explains how the framework was developed and applied in North Kingstown. Examples are also provided for many other localities, such as Chapel Hill, North Carolina, and Bethesda, Maryland.
The framework is oriented toward economic resilience and emphasizes maintaining and even increasing economic activity as measured by gross domestic product (GDP), jobs, and property values. Developing the framework requires close cooperation between public agencies and private businesses.
Transportation is identified as a critical economic component, along with utilities, industry, commerce, agriculture, and natural resources. The report points out that some communities address their vulnerability to floods in their local hazard mitigation plan, which is required for certain Federal Emergency Management Agency (FEMA) grants (FEMA,2020). Where such plans exist, they will be informative sources for developing a climate resilience planning framework.
The report also points out that the framework can be applied more qualitatively or quantitatively. A qualitative approach would rely on existing maps, published data, and available knowledge to assess vulnerabilities, potential destruction, and damage from natural disasters. A quantitative approach would use GIS and other software to evaluate vulnerabilities and generate more specific numerical estimates of potential destruction and damage.
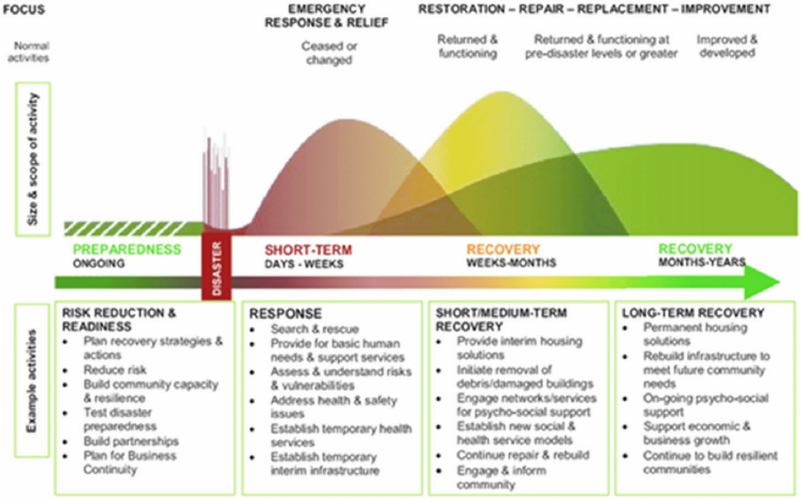
The framework encompasses all the major phases of the resilience cycle, including Preparation, Emergency Response, Short-Term Recovery, and Long-Term Recovery. Most communities are not currently experiencing a disaster nor grappling with immediate consequences of one. Therefore, preparation and protection motivate most of the steps in implementing the framework. Effective implementation requires public involvement, including presenting the framework and receiving community feedback to ensure buy-in.
The framework is oriented toward opportunity as well as protection. As climate threats increase, societal needs and economic systems will likely change. With this potentially dramatic set of changes, many communities may find opportunities to develop new products and services and generate economic and demographic growth as they adapt. For example, an office building in Miami improved its competitiveness by reducing its vulnerability to flooding and wind and guaranteeing electric service.
The framework provides for a specific set of actions, organized into five steps:
- Organize
- Evaluate Projected Climate Change Impacts and Hazards
- Identify Community Assets and Their Vulnerability
- Analyze Overall Economic Implications
- Explore Options to Enhance Resilience and Pursue Opportunities
The first step, Organize, is critical for any organization or coalition that decides to apply the framework to strengthen their community. Most typically, a city or county department would lead the effort, but any number of arrangements are possible. This step is broken down into three objectives, 1) establish the assessment team, 2) geographically define the community of interest, and 3) set objectives.
The assessment team should include needed public and private stakeholders and have the technical and managerial expertise to complete the assessment. Sometimes, the community may be defined by city or county boundaries. However, in other cases, it may be practical to customize the area of focus because of a desire to include particular infrastructure, populations, or natural resources in the process. Finally, it is essential to have specific and attainable objectives, including a date for completion, because attempting to do more than can
be accomplished effectively may result in poor results and frustration on the part of the stakeholders.
The second step, Evaluating Projected Climate Change Impacts and Hazards is broken down into three objectives, 1) select climate change scenarios, 2) assess hazards (quantitatively or qualitatively), and 3+) select a method for spatial analysis.
The selection of climate change scenarios is primarily determined by the community’s climate and geographic setting, and area-specific scenarios are available from the National Climate Assessment and other sources. Once the scenarios are established, it is necessary to identify and specify specific hazards. Different areas will have concerns about sea-level rise, drought, tornadoes, extreme heat, or other contingencies. Spatial analysis can project which specific lots and other geographic features have the highest vulnerability. Using a more sophisticated tool, such as the Hazus model or GIS software, permits more quantitative estimates of destruction, damage, and other harms, such as the degradation of drinking water.
The third step, Identify Community Assets and Their Vulnerability, involves converting potential physical harms identified in step two into economic and social consequences. This decisive step entails four sequential objectives, 1) develop an economic assessment methodology, 2) identify community assets at risk, 3) define and apply a local vulnerability scale, and 4) assess potential impacts, negative or positive, on economic activity. Equity could also be considered using a fifth objective, weighting environmental justice issues in the vulnerability ratings, giving a higher score to adverse impacts disproportionately affecting disadvantaged communities.
The third step description features a table laying out the primary methodology. This table includes 25 categories of assets and seven climate-related threats and provides information for North Kingstown as an example. The 25 assets are classified into five categories: Transportation, Industrial Areas, Commercial Areas, Agriculture/Fisheries, and Natural Resources. Most specific assets, such as Roads, Annual Crops, and Wetlands, are still fairly broad. However, Commercial Operations are defined as more specific sites, usually within a radius of 300 feet or less. The categories of climate-related threats include inland flooding, wind damage, and drought.
In the North Kingstown example, vulnerability for each cell in the table is rated High, Moderate, Low or None. Of 175 cells, about 37 are rated High (some of the vulnerability ratings are Moderate/High hybrids or designated High for coastal facilities). These high vulnerability cells include Bus Service in a Blizzard, Waterfronts Facing Sea Level Rise, Commercial Operations Vulnerable to Wind Damage, Agricultural Operations Vulnerable to Flooding, and Coastal Natural Resources Exposed to Storm Surge.
An important question in step three is how much effort and other resources can be applied. Implementation can vary regarding the amount of labor, technical tools, and specialized analysis required. An example of an increased labor effort would be finding and checking most employers and commercial establishments in the study area. If technical expertise is available, it can be used to apply GIS, Hazus, or statistical software to develop more comprehensive and quantitative data.
The fourth step, Analyze Overall Economic Implications for the Community, is a less resource-intensive step. However, it is important to go beyond cataloging impacts on individual assets and to consider the community as a whole. Three applicable objectives are 1) estimate effects on the overall business climate, 2) analyze effects on real estate values and residential areas, and 3) consider interactions between public and private sectors during the recovery period. The report recommends some effort to fulfill each of these three objectives.
Analyzing the effects of a climate disaster on the overall business environment could entail the impact of one major business’ potential failure on smaller companies or the effects of a disaster on financial factors, such as the availability of capital and insurance. The impacts on real estate and residential areas to analyze could include the estimated number of residents leaving the area in the wake of a disruption and adverse effects on residential property. Finally, effects to consider regarding public-private interaction include adverse effects on municipal revenues and developing a consensus concerning rebuilding strategies.
Step five, Explore Options to Enhance Resilience and Pursue Opportunities, is the culmination of the framework, and its results should influence the plans and budgets of each locality. The specific processes and documents may vary across states or particular municipalities. This step can be broken down into two distinct objectives, 1) raise public awareness and garner support, and 2) identify actions.
Raising public awareness should flow from providing public access at the beginning of the process and throughout the previous steps. Public interest in, and support for specific actions and coalitions to develop the resilience program, is necessary to achieve implementation.
The essential goal of step five is to identify actions to enhance economic resilience and pursue opportunities. This process enables the transition from planning to actions that will pay off in case of a climate-related disaster. Efforts to help businesses take advantage of climate-related opportunities can pay off as national and global economies change in response to climate change as adverse events don’t have to hit locally for climate readiness to improve competitive position.
Most of the options to identify actions can be placed into seven categories:
- Facilitating the physical movement of businesses, public facilities, and residences to more resilient and safer locations,
- Floodproofing and stormwater management,
- Using renewable energy and resilient energy equipment,
- Ensuring and improving supply chains to eliminate or minimize disruption in the case of disaster,
- Developing multimodal transportation options to enhance resilience for commuters and emergency response,
- Projects for energy and water utilities to improve their ability to respond to adverse events, such as drought for water utilities and a variety of supply disruptions for energy utilities, and
- Creating task forces and coalitions to prioritize, coordinate and broker resources for resilience projects and programs.
The sub-section provides numerous real-world examples of public and private organizations improving resilience in their communities. The example of North Kingstown involves including hazard assessment in the town’s Comprehensive Plan and a small project to reduce potential flood damage.
One of the most notable cases involves Bennington, Vermont, where a decision was made to allow the local river to expand into a flood plain rather than risk flooding the downtown. A few years later, Tropical Storm Irene (originally Hurricane Irene) caused the river to flood, and the flood plain restoration averted an estimated $93 million in damages.
In 2007, a tornado destroyed 90% of the buildings in the small town of Greensburg, Kansas. The town was rebuilt as a green, resilient community, adopting Leadership in Energy and Environmental Design (LEED) standards for new buildings, burying power lines, and requiring backup generators for critical facilities. These and other changes led to Greensburg being labeled “the greenest town in America.”
Critical Assessment of Success or Challenges of Approach
The EPA report, “Planning Framework for a Climate-Resilient Economy,” highlights the urgency for communities all over the U.S. to develop their own frameworks to increase resilience to climate-related threats. The primary reasons for undertaking a structured effort are:
- The potentially devastating effects of many disasters require preparations put in place often years in advance.
- A high degree of public/private communication and coordination is needed.
- Assistance from federal and state agencies can be valuable and takes time to arrange.
By breaking the process into five specific steps and delineating objectives for each step, the report enables each community to assess the envisioned framework and apply it to their physical environment and other attributes. Step three, which entails identifying community assets and specifying each asset’s vulnerability to various threats, is the cornerstone of the process. Some communities may be able to focus on more assets and perform a more comprehensive, quantitative analysis. Others may limit their efforts to evaluating the most essential assets and using existing data and knowledge.
The potential flexibilities in using technical expertise and quantitative analysis are a strength of this framework. Localities vary widely in technical resources. A more prescriptive program would dictate which experts to bring in and what modules to run on specific software. These requirements might work for some localities but be daunting or prohibitive for others. As the framework is further developed and applied, it should be possible to establish various technical options. More information concerning appropriate experts and available data and software products could help localities not know how ambitious to be concerning data and analysis.
The report is advisory; therefore, the development of the proposed framework is limited in certain respects. The EPA cannot require any community to develop this framework nor mandate a schedule for development or updating, and few localities have dedicated funding sources for resilience projects and programs. Some private businesses may be willing and able to make significant investments, but this is at the discretion of each firm. However, the framework can be a tool to emphasize the importance of securing funding and all stakeholders pulling together for the benefit of their community.
Replicability of the Approach for Other Agencies
The “Planning Framework for a Climate-Resilient Economy” presents a detailed program for developing and applying a planning framework and details the application of this framework to North Kingstown, RI. The example of the North Kingstown application provides good reason to believe that the approach is replicable and practical. There are two primary issues of concern. The first is resources at the municipal, state, federal, and private sector levels to develop this framework. The second is the will to do so, given competing priorities, political controversy, and inevitable tensions among various stakeholders.
The planned implementation in North Kingstown was sidelined by the election of a new Town Council while the report was being completed. In hindsight, it also appears that implementation in certain areas might have been promoted by more attention to equity issues and structural racism. Funding is generally seen as the most critical issue for implementation, and there has been little progress toward funding solutions in most states. However, research on this case suggests increasing optimism regarding implementation as the effects of climate change become more pronounced.
While the growing threat of massive or irreparable damage from a climate-related event provides an incentive to secure resources for this effort, every locality is different regarding its level of engagement and fiscal situation. Some localities have Local Hazard Mitigation Plans, which are required for certain FEMA grants. However, these plans are often prepared to meet minimum FEMA requirements, with little provision for mitigation or capital resilience projects. All three levels of government can work together to expand current hazard mitigation plans to implement the EPA framework.
State and federal agencies may be able to assist localities with implementation at relatively little cost. This assistance could include tracking local efforts, documenting plans and projects in numerous jurisdictions, and assessing long-term payoffs. If these results were made available in a database, that would help other localities to benefit from the experience of others. Finally, most states may have the practical ability to assist local governments with GIS functionality and data from climate models.
One participant recommended that transportation agencies, including state departments of transportation (DOTs) and metropolitan planning organizations (MPOs), play a significant role in implementation for multiple local areas. Transportation agencies frequently bring major private and public stakeholders together, and they could do so to develop resilience plans.
The report cites several examples of turning goodwill into detailed planning and follow-up action. Although not in response to a climate-related event, Clinton County, Ohio, presents an excellent example of different levels of government working to bring stakeholders together to offer assistance and effect change. After the departure of the leading employer, the state, the county, and a new non-profit put together a task force and held public meetings. The task force developed a strategy to help local businesses retain young people and improve energy efficiency. Its work enabled Clinton to remain economically in the middle tier of Ohio counties despite the initial blow to its economy.
Another example is the CLEAN Business Program of Chula Vista, California. This program provides a free energy audit and recognition for businesses that meet its sustainability standards. The CLEAN Business List provides contact information for over 150 establishments (Chula Vista,2020).
Key Takeaways
- Many local leaders are interested in planning for climate resilience to reduce economic losses from climate-related disasters. However, they lack a clear framework and process for identifying their community’s most significant vulnerabilities and the most desirable actions to increase resilience.
- The EPA’s “Planning Framework for a Climate-Resilient Economy,” prepared with input from the state of Rhode Island, provides a practical framework and numerous examples of how planning has helped communities all over the U.S. The framework is built around five specific steps detailed in this case study.
- Continuing greenhouse gas emissions and the prospect of increasing climate change lend an increased urgency to this effort. Each community needs to identify its most salient threats, such as flooding and related phenomena, wind damage, drought, blizzards, and wildfires.
- Climate resilience includes actively pursuing new opportunities and handling climate-related threats. The framework encourages businesses and governments to take advantage of market changes and needs. Several examples are provided in the report.
- Each community can customize the framework to meet its needs best. Some communities can marshal more resources and apply more sophisticated analysis, while others may consider fewer assets and rely upon available data. But numerous communities can profit from using the framework.
- Since the report was posted in 2016, implementation has not been as extensive as was hoped. In the case of North Kingstown, RI, newly elected council members deemphasized implementation. The case of North Kingstown provides a lesson that planners and private stakeholders interested in developing a resilience planning framework must be sensitive to local political conditions and developments.
3A.5: Florida Resilience Planning at Metropolitan Planning Organizations
Summary
This case study explores efforts within Florida to incorporate resilience into the transportation planning process. The Florida Department of Transportation (FDOT) has undertaken efforts and developed guidance to assist the state’s 27 MPOs in incorporating resilience into their efforts. Florida’s efforts have been guided and assisted by FHWA’s Vulnerability Assessment and Adaptation Framework. The case also highlights data-driven planning efforts undertaken by Resilient Tampa Bay, a coalition of regional groups that include the region’s MPOs.
The fact that Florida’s effort falls within the “Preparedness” phase of the resilience cycle points to its appropriateness for any transportation planning efforts in regions with recurring disruptive events like hurricanes, flooding, forest fires, and landslides, or those reasonably expecting a disruptive event may occur, such as an earthquake.
Resilience planning is an ongoing process for FDOT and the state. Florida is home to 27 MPOs with various levels of sophistication, which adds complexity to an already complex undertaking. Resilience is a broad issue with efforts underway by multiple jurisdictions, agencies, and actors. Often, these Florida-based resilience coalitions work together. Up to this point, FDOT has received positive feedback related to its Resilience Quick Guide. The Quick Guide has also been used to educate local politicians and communities about the ongoing efforts at the state and local levels to plan for future disruptive events.
There is a lot of enthusiasm and support for the resiliency effort. However, it was acknowledged that coordination among the many players, and even within FDOT, is a work in progress. For instance, it has not been clearly established how incorporating resilience in the planning process translates into projects developed in the long-range plans, which are then carried through to the project development process and implementation.
The ability of the MPO to frame resiliency in a way that is not fiscally constrained, provides an opportunity to show how projects will strengthen and create a more adaptable transportation network and offer valuable comparisons to use when selecting the best projects, programs, policies, and planning efforts.
-FDOT, Resilience Quick Guide
Finally, there is an opportunity to use a needs plan to identify the transportation infrastructure essential to accommodate future travel demand and assess how projects would strengthen the network’s resilience. A needs plan, or needs assessment, is an element of the LRTP that does not consider financial constraints when inventorying transportation investment projects to improve efficiency and meet future needs. Maps resulting from vulnerability assessments also help communicate the need for resilience planning to the general public and legislative representatives.
Keywords: vulnerability assessment, resilience, resiliency, adaptation framework
Description of Resilience Approach Taken
Florida Department of Transportation’s (FDOT) incorporation of resilience into its planning efforts and those of the state’s MPOs was not the result of a single incident or event. It was a response to the growing threat of various types of disruption events, such as hurricanes, flooding, wildfires, and cyberattacks, that can negatively affect its residents and businesses. Forecasted population growth of 30% to 27 million people by 2045, rising sea levels, and shifts in global economic trade partnerships are trends expected to increase the complexity of improving the resilience of a statewide multimodal transportation system. Florida’s effort falls within the “Preparedness” phase of the Resilience Timeline, shown in Figure 21.
Federal Regulation 23 CFR 450.306(b)(9)
requires Metropolitan Planning Organizations, in cooperation with the State and public transportation operators to improve the resiliency and reliability of the transportation system and reduce or mitigate stormwater impacts of surface transportation.
In its most recent Florida Transportation Plan (FTP), FDOT identified resilience as one of its long-range goals and cross-cutting topics with a focus on how extreme weather events affect the transportation system, emergency evacuations and responses, rising sea levels, and economic and societal changes. In January 2020, it released its Resilience Quick Guide: Incorporating Resilience in the MPO Long Range Transportation Plan. The guide is meant to assist transportation agencies across the state plan, design, build, and operate transportation facilities that can quickly recover from the various disruption incidents the state commonly faces. It discusses the sections of an LRTP as it relates to resilience, such as goals and objectives, performance measures and targets, a risk and vulnerabilities assessment, a needs plan development, and investment and project prioritizations. The guide provides each section’s noteworthy practices from MPOs in Florida and nationwide.
In a separate effort, the Hillsborough, Pinellas, and Pasco County MPOs, the Tampa Bay Regional Planning Commission, and FDOT participated in the Federal Highway Administration’s (FHWA) Resilience and Durability to Extreme Weather Pilot Program. The 11 pilot projects sought to incorporate resilience into transportation agencies’ practices, tools, resources, performance management, and decision-making. The Resilient Tampa Bay (RTB) project noted that with 1,000 plus miles of shoreline and 39% of its 2.8 million residents located within flood zones, the Third National Climate Assessment (2014) identified its region as one of three areas in Florida especially susceptible to rising sea levels. This region’s potential losses from storm surges are estimated at $175 billion. The pilot study focused on assessing the vulnerability of the region’s surface transportation assets and integrating hazard mitigation, emergency management, and post-disaster redevelopment plans into their LRTPs. It was conducted with two goals in mind:
- Address the Fixing America’s Surface Transportation (FAST) Act requirement for MPOs to incorporate and improve the resilience and reliability of the transportation system into their long-range planning.
- Inform decision-making and ensure the region’s transportation system meets functional, economic, and quality of life goals for its users (residents, businesses, and tourists).
At the core of the 11 FHWA Resilience and Durability to Extreme Weather Pilot Projects was its Vulnerability Assessment and Adaptation Framework. This framework was developed to help state, regional, and local transportation agencies assess the vulnerability of their transportation systems and underlying assets to the effects of extreme weather. The framework provides national examples of previously conducted assessments between 2010 and 2017, links to more information and related resources, and a step-by-step process for conducting a vulnerability assessment including:
- Defining objectives and scope,
- Obtaining asset and climate data,
- Assessing vulnerability,
- Identifying, analyzing, and prioritizing adaptation options, and
- Incorporating results into decision-making.
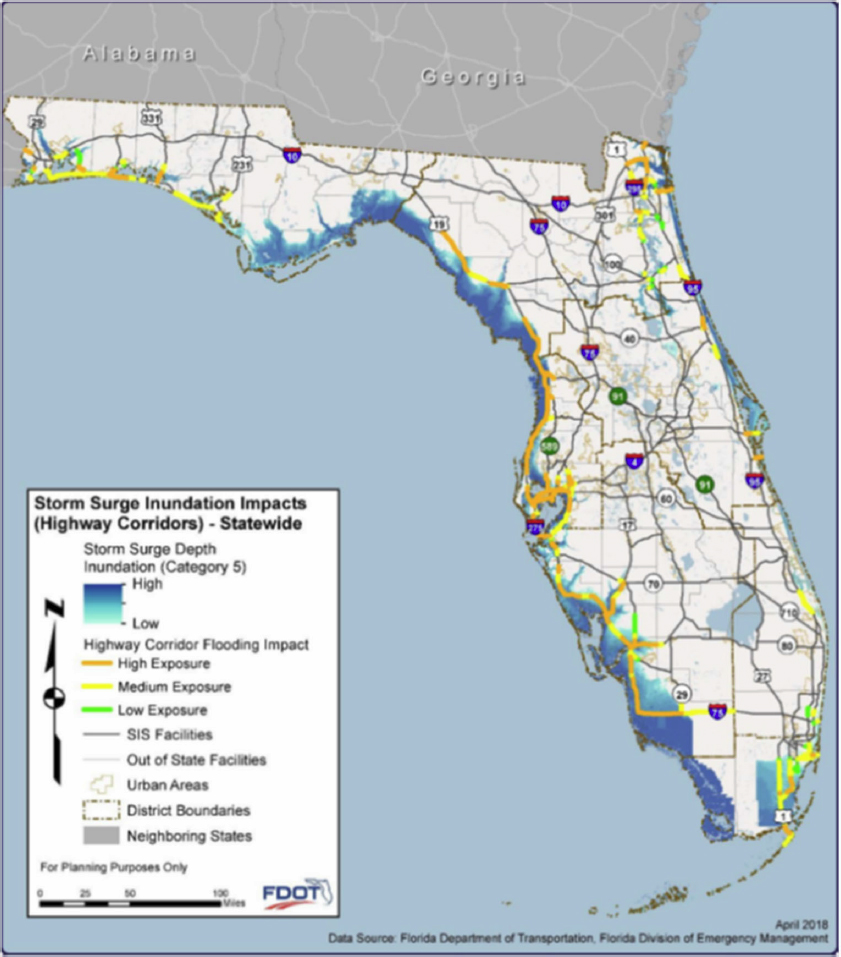
As one of the 11 pilot projects, Resilient Tampa Bay utilized FHWA’s Vulnerability Assessment and Adaptation Framework to design its work plan. FDOT referenced the framework in its Resilience Quick Guide section, “Risks and Vulnerabilities Assessment,” and reviewed it before establishing its own framework used to conduct its risk assessment on the state’s Strategic Intermodal System (SIS), shown in Figure 22. FDOT developed its framework to be a tool used to support and strengthen its decision-making by incorporating weather-related risks as they relate to the sustainability of the SIS network and FDOT’s role in improving mobility and economic competitiveness for the state’s residents and businesses. The study identified critical infrastructure and network risks/vulnerabilities stemming from floods and pre-disaster mitigation strategies such as retrofitting and adapting existing assets, pre-disaster emergency response planning, and emergency response operations, among others.
Geospatial data, tools, and models played a central role in FDOT’s and Resilient Tampa Bay’s assessments. Data related to the climate and weather were paired with topographic characteristics and transportation assets to conduct the vulnerability assessments. The University of Florida’s GeoPlan Center’s Sea Level Rise Inundation Surface Calculation Tool and the Sea, Lake, and Overland Surges from Hurricanes (SLOSH) model from the National Oceanic and Atmospheric Administration (NOAA) were combined with the geospatial data to understand the geographic extent of future sea levels and storm surges. GeoPlan’s sketch planning tool is a publicly available ArcGIS add-in that helps to identify and visualize transportation assets at risk from sea-level rise, storm surge, and inland flooding. Resilient Tampa Bay has created an ArcGIS tool suite with built-in storm surge, rain event, demographic, and damage models for MPO and county use. Figure 22 shows the SIS facilities’ assessment of a Category 5 storm surge.
Resilient Tampa Bay’s vulnerability assessment used NOAA’s 2045 High Sea Level Rise Projection and Category 3 Storm Surge estimation to identify areas vulnerable to flooding and associated transportation infrastructure. Links in the region’s transportation network were categorized based on criticality by combining qualitative information via stakeholder engagement with quantitative GIS-based analysis. The critical linkages were classified as either low, medium, or high using 11 weighted factors:
- Evacuation Route (3 pts.)
- Projected 2040 Traffic volume (3 pts.)
- Proximity or primary route to major economic and social activity centers (3 pts.)
- Projected Population Density (3 pts.)
- Transit Corridor (2 pts.)
- Part of adopted land use and transportation plans (LRTP, TIP, SIS, NHFN) (2 pts.)
- Projected Employment Density (2 pts.)
- Percentage of zero-car households (2 pts.)
- Intermodal Connectivity (1 pts.)
- Projected Truck Traffic or Freight Corridor (1 pt.)
- Equity Areas- Environmental Justice (disadvantaged populations) (1 pt.)
After Resilient Tampa Bay conducted the criticality assessment, it considered adaptation strategies using scenario planning with the help of econometric modeling via REMI’s TranSight model. The scenarios looked at the benefits and costs of various investment levels. Scenario 1 included an investment level 1 ($31 million per year) to continue today’s stormwater drainage improvement program and a Category 3 storm. Scenario 8b paired a Category 3 storm with a level 3 investment ($39 million per year) to continue today’s stormwater drainage improvement programs, raise road profiles, enhance base, and protect shorelines from wave damage. Scenario 1 resulted in eight weeks of major roads being unusable and $266 million in economic losses. Scenario 8b resulted in losing major roads for three weeks and $119 million in financial losses, more than half of Scenario 1’s losses. Several representative projects were selected and evaluated to identify appropriate mitigation strategies and associated costs to be included in the LRTP.
A Critical Assessment of the Success or Challenges of the Approach
Resilience planning is an ongoing process for FDOT. Florida is home to 27 MPOs with various levels of sophistication, which adds complexity to an already complex undertaking. Some MPOs in the state are progressive when it comes to resilience planning, while some are just getting started. The process is constantly ongoing, with updates to LRTPs required every four or five years. For example, eight MPOs’ LRTPs were updated in the fall of 2019, 15 were updated for the fall of 2020, and four were scheduled for the fall of 2021. As of this study, FDOT has received positive feedback about its Resilience Quick Guide and has encountered no resistance from MPOs when it was introduced. While the guide may not present any new information for some of the more progressive Florida MPOs, it has effectively been used to educate local politicians and communities about the ongoing efforts at the state and local levels to plan for future disruptive events.
While there is a lot of enthusiasm and support for the effort, it was acknowledged that coordination among the many players, and even within FDOT, is a work in progress. For example, it has not been clearly established how incorporating resilience in the planning process translates into projects developed in long-range plans, which are then carried through to the project development process, and implementation. Another complicating factor is that many Florida areas use different modeling assumptions, like sea-level rise forecasts.
An Analysis of the Replicability and Practicality of the Approach for Other Agencies
The fact that the resilience efforts by FDOT and Resilient Tampa Bay are situated within the “Preparedness” phase of the disaster timeline points to its appropriateness for any transportation resilience planning efforts in regions with recurring disruptive events, like hurricanes, flooding, forest fires, and landslides, or those reasonably anticipating a disruptive event, like an earthquake. The frameworks, tools, data, and models applied by FDOT, and Resilient Tampa Bay are either publicly available or can be reasonably acquired through partnerships with other regional stakeholders.
Key Takeaways
Resilience is a broad issue with efforts underway by multiple jurisdictions and agencies. These efforts range from local governments forming comprehensive plans, to MPOs conducting LRTPs, to state agency-based plans, initiatives, and data resources at FDOT, the Florida Department of Economic Opportunity, Enterprise Florida, Space Florida, and all of FDOT’s modal partners such as transit, the expressway, seaports, airports, and other authorities. Currently, multiple resilience coalitions in the state often work together and coordinate. With the responsibility of creating strategic regional policy plans, Regional Planning Councils can be a source for this coordination. As of this study, the state is awaiting selection to combine multiple regional efforts into a single HUD-based effort.
There is an opportunity to use the needs plan to identify the transportation infrastructure essential to accommodate future travel demand and assess how projects would strengthen the network’s resilience. Maps resulting from vulnerability assessments help communicate the need for resilience planning to the general public and legislative representatives. Whereas the cost-feasible plan only lists the projects that can practically be undertaken with existing funding levels, the needs plan can list all desired projects. The cost-feasible plan is an important part of the LRTP in that it shows constituents how available funds will be used to meet resilience goals and objectives. Resilience factors can be inserted into the project prioritization process by recognizing if proposed projects are along an evacuation route, promote connectivity, reduce congestion, are freight routes, or impact wetlands. Other criteria to be considered include location within a flood plain and travel time measures for critical response routes.
The ability of the MPO to frame resiliency in a way that is not fiscally constrained, provides an opportunity to show how projects will strengthen and create a more adaptable transportation network and offer valuable comparisons to use when selecting the best projects, programs, policies, and planning efforts.
-FDOT, Resilience Quick Guide
3A.6: Louisiana Supply Chain Transportation Council
Summary
The Louisiana Supply Chain & Transportation Council (SCTC) is an outgrowth of the Federal Emergency Management Administration’s (FEMA) National Disaster Recovery Framework (NDRF) in response to the severe flooding that affected much of Louisiana in March and August of 2016. These floods were equivalent to two 1,000-year reign events in six months. Fifty-six of the state’s 64 parishes were declared disasters in one or the other event, and seven parishes were included in both disaster declarations (DR-4263-LA and DR-4277-LA). The flood events significantly affected Louisiana’s multimodal transportation system’s ability to serve its citizens and businesses.
Louisiana is connected to the U.S. and ultimately the world via 930 miles of interstate, 2,600 miles of U.S. Highways, six Class I and multiple short-line rail networks, several airports, and deep-water and river ports. The March flood caused 450 miles of public roads to be closed, including portions of Interstates 10, 20, and 49, and the closure of J. Bennett Johnston Red River Waterway to commercial traffic. The flooding also forced service suspension on Class I mainlines, which cascaded to the connecting short-line networks. The August flood caused closures on over sixty thousand miles of public roads, including Interstates 10 and 12. Motorists were stranded on I-12 for 48 hours. When interstates were reopened to commercial truck traffic, it was with eight inches of water. Rail traffic in the state essentially stopped with the closure of three Class I rail networks.
In response to the March flood, FEMA activated the National Disaster Recovery Framework (NDRF), created following Hurricanes Katrina and Rita, to guide coordinated recovery and response efforts among local, state, federal, and nongovernmental organizations. The NDRF provides context for how a community restores, redevelops, and revitalizes its social, economic, and environmental aspects after a disaster. It also provides guidance on pre- and post-disaster recovery planning. Under the NDRF’s Economic Recovery Support Function (ERSF), Louisiana Economic Development (LED) and the U.S. Economic Development Administration (EDA) identified supply chain and commercial transportation disruptions as a recovery issue. They recommended a public-private partnership be formed to increase the overall effectiveness of the multimodal transportation system post-disaster to reduce negative impacts on the state’s commercial and agricultural industries.
The NDRF provides context for how the whole community works together to restore, redevelop, and revitalize the health, social, economic, natural, and environmental fabric of the community. The NDRF is one of the five documents in the suite of National Planning Frameworks. Each cover one preparedness mission area: Prevention, Protection, Mitigation, Response, or Recovery. -FEMA Information Sheet, National Disaster Recovery Framework (Second Edition)
In February of 2017, a joint effort of the U.S. EDA, LED, the Louisiana Department of Transportation and Development (DOTD), and the U.S. Chamber of Commerce resulted in the creation of the SCTC. By May, the Louisiana State Legislature passed Senate Concurrent Resolution 99 authorizing and establishing the SCTC. While not required for the SCTC to operate, the resolution effectively championed the council when seeking private sector stakeholder participation. Subsequent resolutions, SCR 9 in 2018 and SCR 110, have reiterated that support with the latter authorization extending until June 10, 2021.
Several lessons can be learned from the SCTC:
- FEMA’s NDRF provides a proven process for implementing risk reduction and readiness efforts. While the SCTC was an outgrowth of NDRF Recovery Function, the fact that it is situated within the “Preparedness” phase of the disaster timeline points to its appropriateness for any freight-related transportation planning efforts in regions with recurring disruptive events such as hurricanes, flooding, forest fires, and landslides, or those reasonably expecting a disruptive event, like an earthquake.
- Funding for staff to perform administrative, coordination, implementation, and outreach activities is essential to accomplishing the work required in a recovery effort. Federal support is likely to fluctuate, and local staff resources may not have the needed resources to move the action items forward. Having knowledgeable and effective administrative staff can help mitigate these issues.
- Project champions are needed to support and assemble key players as active participants. The SCTC was championed by the Louisiana Legislature, Assistant DOTD Secretary, the Freight Advisory Council (FAC), and others. Engaging the private sector via the FAC provided a ready-to-use roster of potential participants to acquire the needed input and support.
- Involving academic institutions in recovery efforts brought multiple benefits, including additional grant opportunities and intellectual resources for analysis and modeling capabilities.
Description of the Resilience Approach Taken
In March and August 2016, Louisiana experienced two flooding events in which 56 of the state’s 64 parishes were declared disasters in one or the other event, and seven parishes were included in both disaster declarations (DR-4263-LA and DR-4277-LA). These two flooding events were the equivalent of two 1,000-year reign events in six months based on annual exceedance probabilities. The flooding events severely affected the state’s multimodal transportation system’s ability to provide safe and efficient mobility to users, passengers, and freight. Figure 23 shows the flood events’ geographic extent.
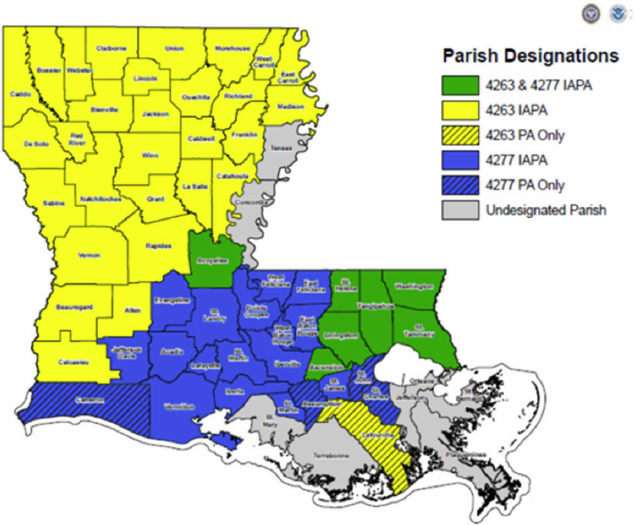
(Louisiana Supply Chain & Transportation Council).
There are over 61,000 miles of public roads in Louisiana, including 930 miles of interstates and 2,600 miles of U.S. Highway. The rail network allows shippers to efficiently and economically move large amounts of freight over land, especially over long distances. Rail also provides shippers with access to waterway ports. Louisiana is serviced by six of the seven Class I railroads BNSF, CN, CSX, KCS, NS, and UP) and multiple short-lines, including the New Orleans Public Belt.
Louisiana boasts the country’s second-largest network of navigable waterways with more than 2,800 miles, access to both the Mississippi River and the Gulf Intracoastal Waterway, a total of 31 ports, and soon the Louisiana International Deep Water Gulf Transfer Terminal, the country’s first deep water transfer terminal. According to the Bureau of Transportation Statistics, Louisiana was home to five of the top 15 ports by tonnage in 2018. The Port of South Louisiana handled more tonnage, 275.5 million, than any other port complex in the nation.3
The March flooding (FEMA DR-4263-LA) closed about 450 local and state roads and sections of Interstates 10, 20, and 49. The J. Bennett Johnston Red River Waterway was particularly hard hit by flooding. The waterway, which carried roughly 8.6 million short tons of freight in 2015 and has only a 9-foot draft, was closed to commercial traffic. Rail traffic was also significantly affected, with KCS having to suspend service on both main lines between March 9th and April 12th and UP having to suspend service on some lines for nine days. The Class I closures affected the short-line and connecting railroads as well. The August flood of 2016 (FEMA DR-4277-LA) affected travel on 1-10 and I-12, with commercial traffic forced to use roads still inundated with more than eight inches of water. Sixty-one thousand three hundred miles of public roads were closed, with motorists stranded on I-12 for over 48 hours.
__________________
3https://www.bts.dot.gov/content/tonnage-top-50-us-water-ports-ranked-total-tons
In response to the March flood, FEMA activated the National Disaster Recovery Framework (NDRF), which was created in response to Hurricanes Katrina and Rita to guide coordinated recovery efforts among local, state, federal, and non-governmental organizations in response to natural disasters. The NDRF provides context for how a community restores, redevelops, and revitalizes its social, economic, and environmental aspects. It includes:
- Guidance and core capabilities,
- Roles and responsibilities of recovery coordinators and other stakeholders,
- Federal support structure,
- Coordinating structure that facilitates communication and collaboration,
- Guidance on pre- and post-disaster recovery planning.
Under the NDRF’s Economic Recovery Support Function (ERSF), the Louisiana Economic Development and the U.S. Economic Development Administration identified supply chain and commercial transportation disruptions as a recovery issue. Specifically, closures along I-20 and I-49 combined with more than 400 miles of closures along U.S., state, parish, and local roadways affected flows of freight and people for an extended period. Flooding also affected the flow of commerce using the rail and waterway networks within the state. A goal was set to increase the overall effectiveness of the multimodal transportation system to keep networks operating (or to reduce the post-disaster downtime) and reduce negative impacts on the commercial and agricultural industries from future similar events. A significant ERSF recommendation for accomplishing this goal was to “Establish a supply chain network to engage business and agriculture interest in support of transportation resilience and enhanced transportation systems, in partnership with the Louisiana Department of Transportation and Development (DOTD) and Louisiana Economic Development (LED).”
The U.S. Economic Development Administration (EDA), the Louisiana Economic Development, the Louisiana Department of Transportation and Development, and the U.S. Chamber of Commerce formed the Louisiana Supply Chain & Transportation Council in February 2017. The council garnered support from the Louisiana State Legislature, which passed Senate Concurrent Resolution 99 in May 2017. SRC 99 authorized and created the SCTC to study and make recommendations about improving the resilience of the state’s multimodal freight transportation network. While the authorization was not required for the council to operate, it did provide a championing effect when organizers approached private sector stakeholders with an invitation to participate. Subsequent resolutions, SCR 9 in 2018 and SCR 110, have reiterated that support with the latter authorization extending until June 10, 2021.
To authorize creation of the Louisiana Supply Chain and Transportation Council to study and make recommendations regarding increasing resilience in various modes of transportation through increased communication, collaboration, development of geographic information technologies, and new innovations in transportation resilience.
-Louisiana Senate Concurrent Resolution No. 99, 2017
The SCTC’s mission statement, adopted during the first organizational meeting in February 2017, was taken directly from the ERSF RSS: “To increase the overall effectiveness of transportation and reduce impacts on commercial and agricultural interests from future events.” The council quickly coalesced around eight specific tasks:
- Identify known single points of failure for all transportation modes.
- Identify known single points of failures that have experienced repetitive flooding.
- Identify single points of failure of interdependency infrastructure.
- Identify governing authorities across the state impacting transportation.
- Consolidate all known transportation nodes mapping data.
- Identification of future disruptions.
- Establish on-the-fly routing during disasters.
- Support all the universities in the state by providing a list of research priorities to enhance the resilience of the transportation sector.
The SCTC utilizes a committee structure closely related to its stated tasks. The Executive Committee is focused on accomplishing task 4 through reviewing other transportation agencies’ best practices related to resilience, reviewing critical transportation resilience plans, and engaging the Volpe Transportation Unit within USDOT for grant assistance related to innovative technologies such as high capacity/shallow draft barges. The Executive Committee also led the effort to increase the council’s participation.
The GIS Committee is focused on tasks 1, 2, 3, 5, and 6 and worked with LSU’s Stevenson Disaster Management Institute (SDMI) to complete tasks 1 and 2. The council created a spatial inventory of the state’s multimodal transportation network with shapefiles in geodatabase formats. This inventory includes both the arcs of the network, the roads, rails, and waterways, as well as the nodes, the associated infrastructure components necessary to ensure the flow of freight, such as points of freight hand-offs at warehouses and distributions centers, intermodal ramps, and transload facilities, ports, and airports. The GIS Committee then incorporated qualitative feedback via its partnerships to identify the known single point of failure across all modal networks.
The Technology and Innovation Committee is responsible for tasks 7 and 8. It is working to build upon, and advance work done by the University of Lafayette Informatics Research Institute on evacuation fuel demand modeling to establish on-the-fly routing for freight carriers during disasters. In particular, the effort utilized the Volpe Transportation Center’s Freight and Fuel Transportation Optimization Tool (FTOT) to analyze the sugar supply chain.
The SCTC is currently conducting a scenario planning exercise with businesses to identify problems and make recommendations to improve resilience in the face of asymmetric risk. The scenario involves the loss of the Sunshine Bridge in St. James Parish, which carries Louisiana Highway 70 traffic over the Mississippi River, and subsequent rerouting plans and any associated primary and secondary impacts stemming from its closure. The results will be presented in the council’s next report to the Louisiana Legislature and the DOTD.
A Critical Assessment of the Success or Challenges of the Approach
The SCTC’s membership consists of transportation experts and leaders from state and federal agencies, various stakeholder associations, and academic institutions. It is administered by the Capital Region Planning Commission (CRPC) in Baton Rouge (see Figure 24). In November 2017, Drew Ratcliff assumed the role of Administrator for the SCTC. He worked as the Regional Disaster Recovery Manager at CRPC under an EDA and Office of Community Development Disaster Recovery Unit. During the March and August floods, he also worked alongside the ERSF in FEMA’s Recovery Support Function. Mr. Ratcliff’s familiarity with the NDRF process and experience with the floods of 2016 and private sector shipping of hazardous bulk liquids by truck, rail, and ship proved immensely valuable. This experience informed his council leadership, facilitating its research and stakeholder engagement activities and identifying and securing federal, state, and local resources.
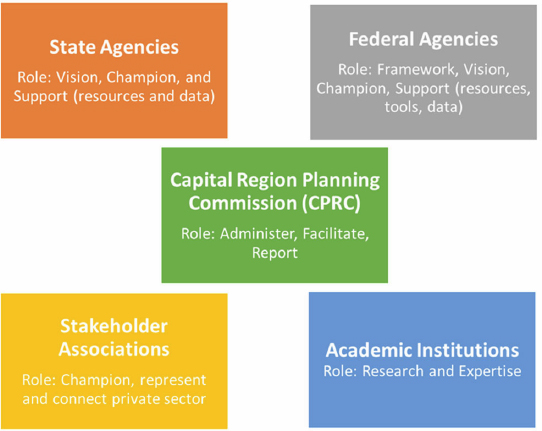
A public-private partnership involving multiple government agencies focused on post-disaster recovery and network resilience during an NDRF-sponsored session. State agencies provided the initial leadership and championing required for the council to gain traction via interest and participation. State agencies also provided support through resources, such as meeting space, freight data, freight stakeholder relationships, and knowledge related to available programs and grants. State agencies on the SCTC include:
- Louisiana Department of Transportation and Development (DOTD),
- Department of Economic Development (LED),
- Governor’s Office of Homeland Security and Emergency Preparedness (GOHSEP),
- Office of Community Development-Disaster Recovery Unit (OCD-DRU),
- Louisiana Association of Planning and Development Districts, and
- Louisiana Board of Regents.
Federal agencies provided the initial framework for the council under the NDRF and its ERSF and facilitated the meeting that produced the vision. Like the state agencies, they also offer support in the way of resources, data, and tools such as the Volpe Center’s FTOT used to model
infrastructure impacts from future storm surges. Federal agencies on the council include USDOT, USACE, FEMA, U.S. EDA, and the Cybersecurity and Infrastructure Security Agency (CISA).
The stakeholder associations listed below champion the SCTC when inviting shippers and carriers to provide qualitative input and data and represent their interests.
- Ports Association of Louisiana
- Louisiana Motor Transport Association
- Louisiana Railroads Association
- Big River Coalition
- American Waterways Operators
- International Air Cargo Association
- Committee of 100 for Economic Development
- Louisiana Association of Business and Industry
- Louisiana Chemical Association
Several academic institutions participate in the council. These institutions bring additional resources to bear, including research and modeling capabilities. In addition, universities raise the profile of the SCTC and provide additional grant opportunities to help deliver action plans. The university partners within the SCTC include:
- Louisiana Tech University,
- Louisiana State University Stevenson Disaster Management Institute (SDMI),
- University of Louisiana Lafayette (ULL),
- Informatics Research Institute,
- National Incident Management Systems and Advanced Technologies Institute, and
- University of New Orleans.
An Analysis of the Replicability and Practicality of the Approach for Other Agencies
While the SCTC was an outgrowth of an NDRF Recovery Function, the fact that it is situated within the “Preparedness” phase of the disaster timeline points to its appropriateness for any freight-related transportation planning efforts in regions with recurring disruptive events such as hurricanes, flooding, forest fires, and landslides or those reasonably expecting a disruptive event, such as an earthquake. The geospatial inventorying process coupled with qualitative input to identify known single points of failure can be duplicated for many types of disruptions. Currently, GIS and stakeholder engagement, through Freight Advisory Committees and other forms, are regularly deployed by transportation agencies. The same can be said for scenario planning with the widespread introduction to transportation agencies dating back to the MIT Center for Transportation and Logistics’ Scenario Planning Toolkit.
Work by state departments of transportation to engage the private sector via Freight Advisory Committees (FACs) and other methods provide a ready-to-use roster of potential participants to acquire the needed qualitative input. The ongoing engagement also provides existing project champions and leadership that can garner the interest and participation of the affected freight stakeholders or customers, the shipper, and carriers utilizing the multimodal transportation system to move the economy’s raw materials, intermediate goods, and finished products.
The models used by the SCTC, Volpe’s FTOT, and the ADCIRC, may not be appropriate for other resilience planning efforts, but having academic institutions actively participating will likely bring the needed research and modeling expertise to match modeling needs appropriately.
The need for knowledgeable staff with available time to administer and facilitate the members’ efforts should not be overlooked. However, public agencies at the state and local levels may not have the staff resources to dedicate the attention needed to move the action items forward. The SCTC continuously leverages its broad roster of stakeholder perspectives to identify public and private sector funding opportunities. In particular, the council obtained grants from the National Center for Disaster Philanthropy and FHWA’s Resilience and Durability to Extreme Weather Pilot Program to cover the administrative costs as well as the analysis and research aligned with the GIS and Technology and Innovation Committee’s work plan. The successful example set forth by the SCTC highlights the sample activities associated with “Risk, Reduction, and Readiness.” These activities include:
- Planning recovery strategies and actions,
- Reducing risk,
- Building community capacity and resilience,
- Testing disaster preparedness,
- Building partnerships, and
- Planning for business continuity.
Key Takeaways
The SCTC case study provides transportation practitioners with many key takeaways. FEMA’s NDRF delivers a proven process for implementing risk reduction and readiness efforts. While the SCTC was an outgrowth of NDRF Recovery Function, the fact that it is situated within the “Preparedness” phase of the disaster timeline points to its appropriateness for any freight-related transportation planning efforts in regions with recurring disruptive events such as hurricanes, flooding, forest fires, and landslides or those reasonably expecting a disruptive event, like an earthquake.
Second, funding for staff to perform administrative, coordination, implementation, and outreach activities are vital to accomplishing the tasks set forth. Federal priorities and support will ebb and flow, and public agencies at the state and local levels may not have the necessary staff to move the action items forward. Therefore, ensuring knowledgeable and effective administrative staff should not be overlooked.
Third, project champions are needed to support public agencies’ efforts and bring shippers, carriers, and private sector associations on as active participants. The SCTC was championed by the Louisiana Legislature, the Assistant Secretary of the DOTD and its Freight Advisory Council, the CEO of the Committee of 100, and the Director of the LSU Stephenson Disaster Management Institute, among others. Work by state departments of transportation to engage the private sector via Freight Advisory Committees (FACs) and other methods provide a ready-to-use roster of potential participants to acquire the needed qualitative input.
Lastly, officially including academic institutions in the effort brings multiple benefits. It raised the SCTC’s profile in the private sector and provided additional grant opportunities. Academic institutions also brought additional resources, including research and modeling capabilities. While the models used by the SCTC (Volpe’s FTOT and the ADCIRC) may not match the needs of other resilience planning efforts, actively participating universities will likely bring the needed research and modeling expertise to fit modeling needs appropriately.
3A.7: Washington Department of Transportation’s Bridge Seismic Retrofit Program
Summary
Millions witnessed the World Series Earthquake on October 17, 1989. The earthquake struck California’s Central Coast area, killing 63 people, injuring nearly 4,000, and leaving more than a million people without power. The World Series Earthquake was estimated to have cost over $6 billion in property damage, with several critical pieces of infrastructure, like the Bay Bridge, left in ruins. While the state of Washington was unaffected by this California catastrophe, it became a wake-up call for another state prone to earthquakes. As a result of witnessing the destruction in California, WSDOT initiated a Bridge Seismic Retrofit in 1990 to address the seismic vulnerability of the state’s highway bridges. This case study examines the program’s history and where it stands today.
The Washington State case study offers several instructive lessons. First, setting priorities is crucial. WSDOT’s programming efforts identified many high-cost retrofits, including the I-5 corridor through downtown Seattle. However, as the initially preferred corridor through downtown Seattle proved unfeasible, WSDOT was flexible and not tied to any specific corridor. This flexibility allows it to reconfigure its lifeline route to a parallel corridor that is more cost-effective.
In 2007, the program identified 895 bridges requiring a retrofit, with just 217 retrofits completed, with spending to retrofit bridges in high-risk zones totaling $100 million. It was estimated that an additional $501 million in future funding would be required to complete the remaining bridges.
Secondly, sometimes preparation is a marathon, not a sprint. A state auditor’s report that examined a similar program in California found that the complexity of large-scale transportation projects like a bridge retrofit program requires appropriate oversight and risk management. During the fall of 2020, WSDOT estimated that it had expended $170 million on the bridge retrofit program to date. In NCHRP Report 608: GASB 34—Methods for Condition Assessment and Preservation, WSDOT representatives noted that condition targets for bridges are “set independent of the budgets” (Parsons Brinckerhoff et al. 2008). WSDOT representatives went on to say that due to the lack of historical data, linking condition targets to expenditures is difficult.
Keywords: earthquake, highways, DOTs, network resilience
Description of the Resilience Approach Taken
On October 17th, 1989, the Loma Prieta Earthquake (a.k.a. World Series Earthquake) shook California’s Central Coast. Sixty miles north of the quake epicenter, the Oakland Athletics and San Francisco Giants were getting ready to play game three of the 1989 World Series in Candlestick Park in San Francisco. The World Series Earthquake registered a magnitude of 6.9 and, caused 63 deaths, 3,757 injuries, and left approximately 1.4 million people without power. The quake also generated an estimated $6 billion worth of property damage, including significant damage to the Bay Bridge, the Cypress Street Viaduct of I-880, SR-17, and Oakland International Airport’s runway.
While the Loma Prieta Earthquake occurred well south of Washington State, the state is located near the convergence of the North American and Juan de Fuca plates that experience an average of 1,000 earthquakes annually (see Figure 25). The most recent Washington State earthquake causing significant damage was the Nisqually earthquake in 2001 which resulted in the loss of one life, 320 injuries, and more than $2 billion in damages.
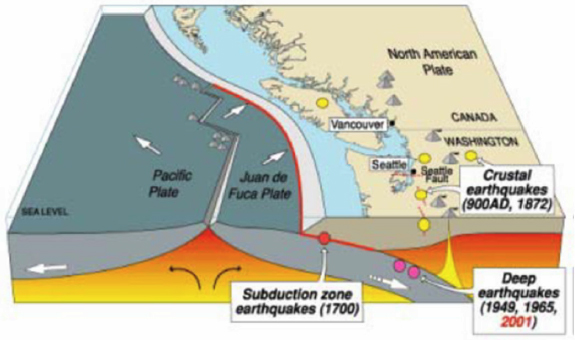
The Loma Prieta Earthquake was a call to action for the Washington State Department of Transportation (WSDOT). In 1990, WSDOT initiated a Bridge Seismic Retrofit to address the seismic vulnerability of the state’s highway bridges. For WSDOT, the retrofit program was necessary to plan for when not, if, a significant earthquake hits Washington State.
WSDOT is responsible for nearly 3,000 state-owned bridges constructed with concrete (35%), prestressed concrete (41%), steel (23 %), or timber (1%). While the average age of its bridge inventory is 39 years, many were constructed as part of the national interstate program that began in the 1950s, which includes Interstates 5, 90, and 405. These interstates are the three primary interstate routes in the Puget Sound region which is home to roughly 4.2 million people (Puget Sound Regional Council). In 1983, the American Association of State Highway and Transportation Officials (AASHTO) updated its design guidelines for bridges related to seismic activity. WSDOT developed a bridge seismic retrofit program in 1990 to address bridges that did not meet current seismic response design standards.
The program’s objectives are to minimize the risk of a bridge collapsing, prioritize projects to reduce the loss of life and disruption to commerce, accept moderate damage, and optimize funding by focusing on seismic superstructure retrofit needs with lower costs and higher benefits first, and then addressing the substructures. The program’s initial study included the following tasks:
- Assess the effectiveness of previous bridge superstructure seismic retrofit methods.
- Estimate the costs of the previously identified retrofit methods.
- Develop a procedure for systemically prioritizing bridges based on their importance as lifeline routes and vulnerability to collapse.
- Build a database to help manage and track the program.
WSDOT has divided the state into three seismic zones based on the risk of peak ground accelerations (PGS) using United States Geological Survey (USGS) data shown in Figure 26. “Zone C” represents the highest risk areas of the state with PGA greater than 0.20 times the force of gravity. In contrast, “Zone B” represents the moderate risk areas with an area of PGA between 0.10 and 0.20 times the force of gravity, the bridges within “Zone C” were evaluated in 1990, followed by the bridges located within “Zone B” in 1994 to meet the program’s objectives. Bridges in “Zone A” were removed from the program unassessed.

The 1990 study made several conclusions:
- A comparative analysis of bridge damage from the 1971 San Fernando Earthquake and the 1989 Loma Prieta Earthquake showed that California’s bridges performed better in 1989 than in 1971. This improved performance was attributed to California’s superstructure retrofitting program.
- The Retrofit Program should only consider retrofitting the superstructures and substructures due to potential overloading and failure of foundations if the superstructure is retrofitted.
- Research and model refinements were recommended to “develop practical and economical methods of column and foundation retrofitting” and enhance the prioritization methodology by incorporating new information.4
__________________
4https://www.wsdot.wa.gov/research/reports/fullreports/217.1.pdf
As of 2007, the program had identified a total of 895 bridges requiring a retrofit and had completed the retrofit for 217, had 19 in progress, and had partially completed 153, leaving 506 bridges remaining yet to begin. Program spending to retrofit bridges in high-risk zones had totaled $100 million, with an anticipated need of $501 million in future funding to complete the remaining bridges. It is estimated that the program’s total spending has increased to $170 million as of fall 2020.
A Critical Assessment of the Success or Challenges of the Approach
Setting priorities is an essential task for agencies undertaking such an extensive program. WSDOT’s programming efforts identified several high-cost retrofits, particularly the I-5 corridor through downtown Seattle. The elevated corridor was built in the 1960s with prestressed hollow core piles, which do not provide the ductility needed for high seismic loading. Mostly, the use of hollow-core concrete piles in areas with high seismic risk has been discontinued, with no proven method to retrofit. To account for the feasibility issues associated with the I-5 corridor retrofit, the lifeline route through Seattle now uses I-405, a newer highway with only a single hollow core bridge (see Figure 27).
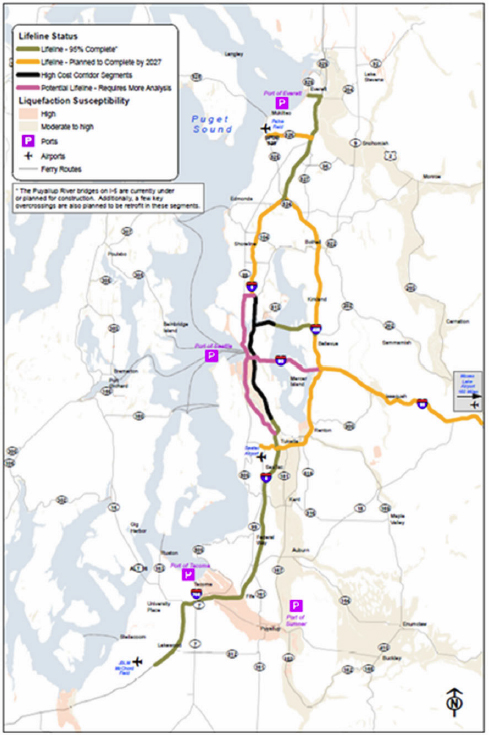
An Analysis of the Replicability and Practicality of the Approach for Other Agencies
The fact that WSDOT’s effort falls within the “Preparedness” phase of the resilience timeline points to its appropriateness for any transportation planning efforts in regions with recurring disruptive events such as hurricanes, flooding, forest fires, and landslides or those reasonably expecting a disruptive event to occur like an earthquake. While WSDOT was focused on hardening assets in preparation for an earthquake, state DOTs looking to identify their most vital assets for moving people and goods to improve the resilience of those assets can follow WSDOT’s inventorying and retrofitting process.
Key Takeaways
WSDOT has shown flexibility as it has built out the lifeline route retrofits. As the initially preferred corridor through downtown Seattle proved unfeasible, WSDOT was able to reconfigure its lifeline route to a parallel corridor that was more cost-effective.
Preparation is often a marathon, not a sprint. A state auditor’s report that examined a similar program in California found that the complexity of large-scale transportation projects like the bridge retrofit program requires appropriate oversight and risk management. The
report recommended the creation of a legislative oversight committee for projects exceeding $500 million.
In NCHRP Report 608, WSDOT representatives noted that bridge condition targets are set independently of the budgets. They went on to say that linking condition targets to expenditures is difficult due to the lack of historical data.
3A.8: Pedestrian Flow-Path Modeling to Support Tsunami Evacuation and Disaster Relief Planning in the U.S. Pacific Northwest
Summary
Tsunamis threaten coastal areas prone to earthquakes and can cause significant loss of life and property damage. Therefore, successful evacuations are necessary to minimize the loss of lives. Previous research on pedestrian-evacuation modeling has focused on identifying areas and populations vulnerable to tsunami risks. Limited research is available on identifying the paths and capacity of assembly areas for at-risk populations with sufficient time to evacuate. This research used a geospatial evacuation modeling approach to estimate evacuation pathways and basins, population type and demand at assembly areas, and potential obstacles to effective evacuations.
The coastal communities of Aberdeen, Hoquiam, and Cosmopolis, located in southwestern Grays Harbor County in Washington State, were selected to demonstrate this approach. First geospatial path distance models were used to map the most efficient paths for pedestrians evacuating from a tsunami-hazard zone to high ground. This information was used to identify evacuation basins (or neighborhoods) that share common evacuation pathways to safety, reflecting minimum travel speeds. Then the number of people traveling along evacuation pathways and arriving at predetermined assembly areas was determined to assess potential shelter demand. The demographic characteristics of evacuees were used to determine the need for additional support. Then the paths inaccessible due to ground failure or bridge failure were determined.
The modeling results for the study region included hazard zones, evacuation pathways and basins, and estimated minimum travel speeds. The model also estimated the number and type of people at assembly areas and the obstacles along the evacuation pathways. The results highlight the communities with no readily accessible assembly area. Model results also suggest that the ground failures due to earthquakes could obstruct access to some assembly areas and cause the evacuees to take routes to alternate assembly areas.
Emergency response managers in relief planning can use model results. Travel speed maps can provide information on minimum travel speeds and the direction in which the evacuees need to move. Modeled evacuation pathways and basins linked with population data can assist with developing realistic response and relief support. Overall, evacuation modeling can identify opportunities for outreach, response planning, and mitigation strategies and enhance the likelihood of successful evacuations.
Keywords: sea-level rise, earthquakes, preparedness, risk management
Description of Resilience Approach Taken
This case study developed a new pedestrian-evacuation modeling application to help evacuation and relief planning during tsunamis. Other hazards can cause additional damage in these earthquake-prone coastal areas, such as surface rupture, liquefaction, and landslides. Successful evacuation in such sites has therefore become very important.
Previous research on pedestrian-evacuation modeling under tsunami hazards has largely focused on identifying areas and populations subjected to tsunami risks. There is limited research on identifying the paths and capacity of assembly areas for at-risk populations to provide sufficient time to evacuate. This research aimed to develop a modeling approach to successfully evacuate at-risk individuals in areas where evacuations are likely. The study used a geospatial evacuation modeling approach to 1) determine minimum pedestrian travel speeds to safety, the most efficient paths, and collective evacuation basins, 2) estimate the total number of people and their demographic description at predetermined assembly areas, and 3) identify which paths may be compromised due to earthquake-induced ground failure.
This research outlines a modeling methodology and discusses the implications and applications of the analysis for evacuation outreach and response planning, mitigation, and long-term land use planning to increase community resilience.
Case Study Description/Methodology
This case study developed a new pedestrian-evacuation modeling application to help evacuation and relief planning during tsunamis. The coastal communities of Aberdeen, Hoquiam, and Cosmopolis, located in southwestern Grays Harbor County in Washington State, were selected to demonstrate this approach. First geospatial path distance models were used to map the most efficient paths for pedestrians evacuating from a tsunami-hazard zone to high ground. This information was used to identify evacuation basins (or neighborhoods) that share common evacuation pathways to safety, reflecting minimum travel speeds. Then the number of people traveling along evacuation pathways and arriving at predetermined assembly areas was determined to assess potential shelter demand. The demographic characteristics of evacuees were used to determine the need for additional support. Then the paths inaccessible due to ground failure or bridge failure were determined. These methods are further described below.
Pedestrian-Evacuation Modeling
ESRI’s ArcGIS software was used to calculate the most efficient paths on foot to safety from every location in a hazard, using a least-cost-distance (LCD) model. Previous studies and publications identified the tsunami-hazard zones. Distances were calculated between cells of varying elevations and then multiplied by travel costs to estimate the amount of time to travel. The travel directions were estimated based on routes with minimum travel time, which were used to calculate overall travel times along an evacuation route for maximum speed. Also, travel was limited to the area’s road networks, even though pedestrian travel can happen across most land cover types. Maps of minimum travel times to safety were generated based on distance, slope, and maximum travel speed of the area. Top travel speeds considered were 0.89 meter/second (m/s) for impaired adults, 1.10 m/s for a slow walking speed, 1.52 m/s for a fast-walking speed, 1.79 m/s for a slow running speed, and 3.85 m/s for a fast-running speed.
Residential population locations were estimated using 2010 Census data. Business locations were estimated from the 2012 Business database that provided business by type and number of employees.
Evacuation Pathways and Basins
Evacuation pathways were determined by a method similar to water flow modeling. The Digital Elevation Model (DEM) was used to determine the steepest slope from a cell, the pixel in a DEM, to each of its eight adjacent cells. This model can indicate the direction evacuees would need to travel from each cell toward safe zones.
Estimating the Number of Survivors at Assembly Areas
Population data were used to produce weighted evacuation flow. The number of people likely to reach each assembly area and the population breakdown by factors such as age or other demographic characteristics were estimated.
Physical Barriers to Evacuation
Potential evacuation impacts from earthquake-related ground failures were estimated by integrating the evacuation pathways with an analysis of earthquake-induced landslides for the study region. This analysis was done to identify alternate routes in case evacuation routes are blocked. It was assumed that all bridges could fail as the study did not consider the structural integrity of any individual bridge for evacuation potential.
Summary of Results
Evacuation Potential
Results suggest that most of the study area could be evacuated in less than 20–25 minutes at a fast walk. If evacuating immediately at the start of an earthquake, 97.5% of all at-risk residents and 99.8% of employees may have sufficient time to evacuate. The percentage of successful excavations drops if the individuals wait for the ground shaking to end. The results also show minimum travel speeds required by population categories such as residents, employees, people at community businesses, dependent care facilities, and public venues.
Evacuation Flowlines and Basins
Thirteen evacuation basins and multiple evacuation corridors were identified for the study region. The population values were used as weights for evacuation flow accumulation. This analysis helps understand population demand at assembly areas and the number of evacuees that could not access assembly areas due to ground failures.
Population Demand at Assembly Areas
The population demand at predetermined assembly locations was summarized along with the population types and evacuation locations described in the sections above. This information is useful in determining which businesses or sites are likely to generate higher volumes of evacuees at a given time during a day, week, or year. Census-block information provided insights into the characteristics of residents that may be at various assembly areas.
Evacuation Obstacles
The results indicate that most individuals should be able to reach assembly areas assuming there were no landslide-hazard zones directly overlapping evacuation routes. Some evacuation pathways to assembly areas may have been compromised because of medium to high landslide hazards on bluffs adjacent to their routes. Other obstacles included bridge failures due to earthquakes. Alternative routes were identified for any bridge failure, and the area’s additional clearance time was estimated.
Critical Assessment of Success or Challenges of Approach
This case study provides information about evacuation pathways, basins, and the spatial distribution of survivors for a three-county region in the state of Washington. This analysis will assist emergency response managers in executing better outreach, evacuation route planning, and planning for post-disaster relief. The model resulting from this research also provides information that could be used to assess potential locations of critical facilities during a tsunami evacuation. Travel speed maps and evacuation pathways can guide the at-risk population on how fast and in which direction evacuees would need to move based on their evacuation decisions.
Understanding evacuee demographics relative to minimum travel speeds is helpful as there may be individuals for whom traveling at the recommended minimum speeds would not be possible. This information could be used to understand where evacuations may be successful for some but not all individuals, assisting the response managers in deciding target locations for evacuation training and considering alternative safety locations. Determining impediments along evacuation routes will inform evacuation limitations. Knowing the sites for potential bridge failures will help city planners and engineers prioritize bridge repair or replacement. Knowing the number of evacuees and their demographics can help emergency managers develop practical assembly areas and coordinate with public health officials for relief planning.
The methods in this research would also support efforts to mitigate the impacts of current development and guide future land use planning. Identifying major pathways and impediments may assist in developing appropriate mitigation strategies. Mitigation strategies could include landscape maintenance and improved lighting for better visibility, rerouting bike or walking paths, paving existing trails, and building steps in steep areas. Some more comprehensive mitigation strategies could include constructing bridges, new trails, road widening, and infrastructure strengthening for resilience. In addition to identifying short-term mitigation strategies, long-range comprehensive land use planning could be evaluated, including new residential or commercial development plans.
Replicability of the Approach for Other Agencies
Evacuation-modeling methods and results discussed in this research have applications to tsunami evacuation outreach, training, response, mitigation, and long-term land use planning to enhance community resilience. Other states and agencies can evaluate evacuation feasibility and use the research in evacuation planning and mitigation. The agencies adopting this approach need to understand research assumptions and limitations before adopting the methodology. For example, the methods presented here used existing road networks for pedestrian movement. At the same time, non-motorized travel can occur across a range of land
cover types such as public fields and parking lots. Modeled optimal paths may not align with the predetermined evacuation corridors. In such cases, revisions may not be required to the modeling assumptions if the predetermined corridors were decided based on earlier discussions within the community.
Research in several areas would be required to understand evacuation procedures, response challenges, and relief planning for local tsunami threats to build on methods presented in this case study. The model could include identifying choke points along evacuation corridors. A choke point analysis should consider varying travel speed assumptions for the different population groups attempting to use similar evacuation corridors. One area of additional research would be to understand the preferred evacuation routes since individuals may take alternate routes for various reasons, instead of the optimal routes used in this study.
The current research assumes that evacuations are possible for most individuals based on the proximity of high ground; however, it does not consider people’s perceptions and behaviors that would influence their decision-making process. Understanding their perception and behavior and incorporating these factors into the evacuation modeling could provide more realistic estimates of successful evacuation efforts and assist in developing appropriate measures to improve the community’s evacuation potential.
Key Takeaways
The key takeaways from this study are as follows:
- This methodology provides techniques for successfully evacuating pedestrians where evacuations are possible.
- The population demand and demographics provide insights about shelter needs and additional necessary relief support for specific groups, like the elderly, children, and tourists. Combined with the evacuation pathways and minimum speed information from the approach can help emergency response managers to improve outreach, evacuation route planning, and planning for post-disaster relief.
- Even though multiple aspects of evacuation planning are considered, this study includes limiting assumptions such as using existing road networks for evacuation pathways and not considering people’s perceptions that would influence evacuation decision-making.
- Adopting this methodology requires consideration of study assumptions and specifics of any regions being analyzed.
3A.9: Typhoon Emergency Response Modeling
Summary
During extreme weather events, many road segments become flooded, leading to heavy congestion, and causing commuters to get stranded for several hours. This case study was conducted to evaluate the measures that could be implemented to reduce severe congestion during a typhoon.
The challenge is that it is not always possible to identify which road segments might be flooded. Therefore, a stochastic model was developed that assigns a failure probability to each road
segment based on climate model outputs for the region. The travel time reliability between any given origin-destination pair can be determined using this model. The area selected for this case study was the Tokai region in Japan, where large typhoons often occur. The resulting disruptions can add as much as four hours to the homebound commutes of many travelers.
The model was applied to the road network of the Tokai region. The two measures identified that could reduce severe congestion are strengthening heavily used roads and implementing commuter demand management. The commuter demand management program involved informing potential commuters and asking them to delay their trips. The two strategies were tested using the regional travel demand model and performing traffic assignment. Model results include travel time reliability between origin-destination pairs under the two strategies. It was found that strengthening heavily used roads would significantly relieve congestion more than delaying the trip departure time. A combination of both strategies would achieve the best results.
The case study provides a potential methodology to test similar measures identified for a particular region. All metropolitan areas in the United States have travel demand models available, and most state DOTs also maintain statewide models. Availability of past and predicted climate data and knowledge about roadway vulnerability could take the research presented here to the next step by building a predictive model that could identify facilities likely to be impacted. Strategies identified in this study, among others, could be tested using travel demand and operational models available for a given region.
Keywords: flooding, highways, DOTs, response, network resilience, typhoon
Description of Resilience Approach Taken
Reliable transportation systems are needed to ensure safe, affordable, and efficient service for its users and keep freight and the economy moving. Flooding can severely disrupt transportation networks directly and indirectly. Physical infrastructure damage incurs repair costs and frequent delays for commuters until the facility is restored. Road capacity decreases, and travel time increases for commuters. Commuters often take detours to avoid flooded roads or facilities blocked by fallen objects, resulting in additional congestion. The risk of crash occurrence increases as vehicles are driven through flooded roadways, resulting in increased injuries and mortality. In large metropolitan areas, transit services might get suspended or delayed impacting access to jobs and creating sudden increases in traffic congestion. Resulting congestion also increases air quality emissions affecting public health, and business activities might be interrupted and delayed, causing economic losses.
This case in this study intended to develop measures that could be implemented to reduce congestion during typhoons. The methodology was divided into two sections 1) determining travel time reliability and 2) evaluating measures against congestion during typhoons. The two strategies identified and evaluated were 1) infrastructure management and 2) travel demand management.
A stochastic model was adopted from previous research to estimate travel conditions and travel time reliability during an extreme weather event. The failure probability of each link was
calculated using past and projected climate data. A travel demand model was used, and hourly traffic assignments were conducted to calculate the reliability of any origin-destination (OD) pair. Fifty model iterations were executed, and under each iteration, the link capacities were adjusted based on their failure probability. If the failure probability went below a certain threshold, the link was assumed to be inoperable.
The results from traffic assignment included link traffic volume, travel time, congestion level, speed, and other traffic characteristics. Results of the traffic assignment were used to estimate the travel time reliability between each OD pair. In general, travel time reliability is defined as the probability that travel time incurred by daily traffic incidents does not significantly exceed normal conditions. In the current study, travel time reliability was defined as the probability that the ratio of the OD travel time between affected and normal conditions is less than a specific, pre-defined level of service. The resulting roadway failures from the traffic assignment simulation were used to calculate the travel time reliability between a given origin and destination. Travel time reliability was then used as a criterion to evaluate measures against congestion.
A case study was conducted to evaluate the measures, using the origin-destination pair of Central Nagoya to Tajimi, where severe traffic congestion occurred between these two areas during past typhoons. Three scenarios were developed:
- Do nothing,
- Measure 1: Infrastructure management by strengthening the structure of important roads, and
- Measure 2: Travel demand management by delaying the departure of commuters by one or two hours.
The “do nothing” scenario served as the baseline when no measure was taken under extreme conditions. Under Measure 1, National Route 19, the most critical route between the two cities, was strengthened. From a modeling standpoint, it was assumed in this scenario that none of the links on this route would fail. Under Measure 2, it was assumed that the commuters were advised to delay their usual departure by waiting at their home, office, school, or designated shelter. This scenario was modeled for only four hours in the peak, and the demand (trips) was shifted to off-peak hours. This strategy was evaluated with multiple scenarios in hours of delay (one or two hours) and the proportion of commuters who delay their trips (0%, 50%, 80%, and 100%).
Travel times were calculated for the origin-destination pairs under different scenarios and compared with the “do nothing” scenario. The results indicate that strengthening the infrastructure is substantially more effective than travel demand management. However, it was found that the most effective measure was both strengthening National Route 19 and delaying departures by two hours, with at least 40% of commuters delaying their trips.
Critical Assessment of Success or Challenges of Approach
In the past, most studies on roadway operation under extreme conditions focused on reliability and vulnerability analysis of the roadway network. Reliability analysis was used to evaluate the performance of a roadway network, considering various uncertainties like fluctuations by
season, time of day, or day of the week, as well as uncertainties due to incidents that reduce capacity, such as traffic incidents, bad weather, and natural disasters. Various reliability measures related to terminals, travel times, and capacities have been studied. Previous reliability studies did not focus on roadway characteristics. However, vulnerability studies focused on identifying the critical elements of a roadway network as its structure can significantly impact travel demand.
Available vulnerability studies are helpful in various aspects. These studies address topics such as identifying critical locations in a network based on the impacts of their failure on the reduction in network connectivity, the capability of a transportation network to function when the network is degraded, and the loss in accessibility when one or more elements of a network fail. However, existing vulnerability studies are limited since few studies accounts for the simultaneous failure of multiple road segments, and many neglect road capacity decreases after a disaster. The probability of failure on a roadway link has been considered, but damage to the links was determined randomly using Monte Carlo simulation.
This case is more realistic as it applied climate data to calculate the failure probability of each link in a torrential rain scenario. It included uncertainty, multiple failures of the links, and decreased road capacity in estimating demand in its approach. Even though the study focused on two types of measures to deal with congestion during typhoons, multiple strategies could be modeled and tested. The infrastructure management strategies can include building using water blockades to strengthen roadways. Travel demand management strategies are often low-cost, high-return strategies and can include shifting demand away from the peak periods, providing temporary accommodations to commuters until the peak period has passed, or providing inexpensive accommodations to commuters who do not necessarily have to make a given trip. These strategies would require effective communication with area commuters so that people do not underestimate the risk of driving on flooded roads. Partnerships with hotels and ridesharing companies would help reduce traffic on area roadways during peak hours.
Replicability of the Approach for Other Agencies
Agencies need to consider the cost of analysis and implementation when finalizing measures and understand any limitations before adopting the Tokai study approach. Climate data were used to develop the stochastic model and identify roadway segments that would fail. In the Tokai study, failures due to flash floods were considered though no runoff modeling was used. In the absence of such data, agencies may need to consider other data available for their region that can be used to develop a similar model. Agencies can also combine knowledge of planned projects, especially on preservation, to better estimate the vulnerability of roadway segments. Thorough regionally-specific research should be conducted to help identify the relevant factors to build such a model. Agencies also need to assess available traffic models, the level of detail, the enhancements required to ensure all critical roadway facilities are captured and the model is validated closely to replicate existing travel patterns. With a wide variety of data available, agencies can use big data and machine learning techniques in model building. Agencies also need to determine the computation time, cost, and necessary resources for developing and implementing such a model.
Key Takeaways
The key takeaways from this study are as follows:
- The methodology used in the case study is more realistic as it uses climate data to calculate the failure probability of network links rather than using a random Monte Carlo simulation.
- Other agencies can more readily adopt the methodology if climate data and travel demand models are readily available.
- Strengthening heavily used roads would have more impact than travel demand management among the two strategies tested. However, travel demand management strategies are generally low-cost, high-return, and a combination of both approaches would provide the best results.
3A.10: Asset-Based Risk Management
Summary
The assessment of risks to transportation assets and the development of strategies to mitigate those risks is an integral part of any resilience approach. The case study evaluates two agency approaches to evaluating the implementation of an asset-based risk management program: the Utah Department of Transportation (UDOT) and the Waka Kotahi New Zealand Transport Authority (NZTA). UDOT was primarily concerned with assessing the threat probability of an event, and the NZTA was primarily concerned with evaluating the consequences a disruptive event may have on transportation and downstream assets. The NZTA used the concepts of interdependencies and cascading effects as a proxy for consequence. As part of this effort, the NZTA developed four interdependency typologies (digital, physical, geographic, and organizational) to help understand an asset’s relationship to other “lifeline” assets. The NZTA approach also highlighted the different levels (strategic and tactical) where the concepts of interdependencies can be used. Concerning replicability, the UDOT approach presents a practical approach that can be replicated in other DOTs and transportation agencies. The NZTA approach was primarily a research effort, and the concepts developed can be helpful to DOTs considering an asset-based risk management program.
Key Words: risk management, interdependencies, threat probability, cascading effects
Description of Resilience Approach Taken
This case study evaluates two approaches to evaluating and implementing asset-based risk management processes. The agencies assessed were the UDOT and the NZTA. While the two approaches had many similar elements, they focused on different aspects of the risk management process. For this reason, the approaches represent a range of possible methods for implementing risk management processes. When taken together, the two approaches present varying degrees of complexity, replicability, and focus.
The ISO 31000 standard defines risk as “the effect of uncertainty on objectives.” It explains that “risk is usually expressed in terms of risk sources, potential events, their consequences, and their likelihood” (ISO, 2018, section 3.1). Such a definition allows for the development of risk
management approaches that can be tailored to a given context while keeping the underlying concept of uncertainty intact. “Context,” in this case, can include the type of events an area faces, the condition and robustness of the transportation network, and the relative sophistication of area agencies, among other factors.
Sources of risk, or hazards, have generally been broken down into three categories: natural, technological, and social/political (Hughes & Healy, 2014). However, with the current COVID-19 pandemic, adding health as a hazard or risk type can be useful. Hazard categories can be further broken down and classified as shock events, which are sudden and generally short-term events such as earthquakes, and stress events that take longer to manifest, like climate change.
Traditionally, risk management processes have sought to identify hazard types, estimate their likelihood of occurrence, assess the consequence of asset failure, and develop mitigation strategies. It’s becoming evident that identifying all hazard types and calculating their probability is an increasingly difficult task, given increased uncertainty. As a response, many areas and agencies are also beginning to focus on systems resilience. Notable differences between traditional, risk-based approaches and resilience approaches include:
- A risk-based approach looks to mitigate failure through probability and scenario-based analysis of known hazards. A resilience approach looks to minimize the consequences of failure by investigating scenarios with unidentified causes.
- A risk-based approach involves incrementally modifying existing designs in response to emerging hazards. A resilience approach involves adapting to changing conditions and potentially allowing controlled failure (a “safe-to-fail” design) at a sub-system level to reduce the possibility of a broader loss of function within the larger system. (Park et al., 2013; Snowden, 2011).
Three generally accepted components of quantifying risk include consequence, vulnerability, and threat. Consequence measures the magnitude of a disruptive event, vulnerability measures how much damage will likely occur, and threat measures the likelihood of an event. The measure of the criticality of an asset serves as a proxy for consequence. Methods of evaluating criticality can vary widely, from a simple measure of roadway volumes to estimations of an asset’s interdependencies with other systems and the potential for downstream or cascading effects. Similarly, measuring threat can take on varying degrees of complexity; for example, using historical data from authoritative sources like FEMA, or employing complex predictive models. The risk definition developed by FHWA is Risk = Consequence x Threat. The Risk Analysis and Management for Critical Asset Protection (RAMCAP) definition developed by ASME Innovative Technologies Institute is Risk = Consequence x Vulnerability x Threat, where vulnerability measures the probability, an event will cause a predetermined damage estimate to an asset.
UDOT Risk Management Approach
UDOT embarked on a series of pilot studies in 2017 to evaluate the business case for implementing a formal asset-based risk management process within its Transportation Performance Management Division. UDOT has a long-standing risk assessment and asset hardening practice within its Structures Division. The question UDOT asked was, should the department implement a formal risk and resilience practice for its other major assets like roadways and culverts?
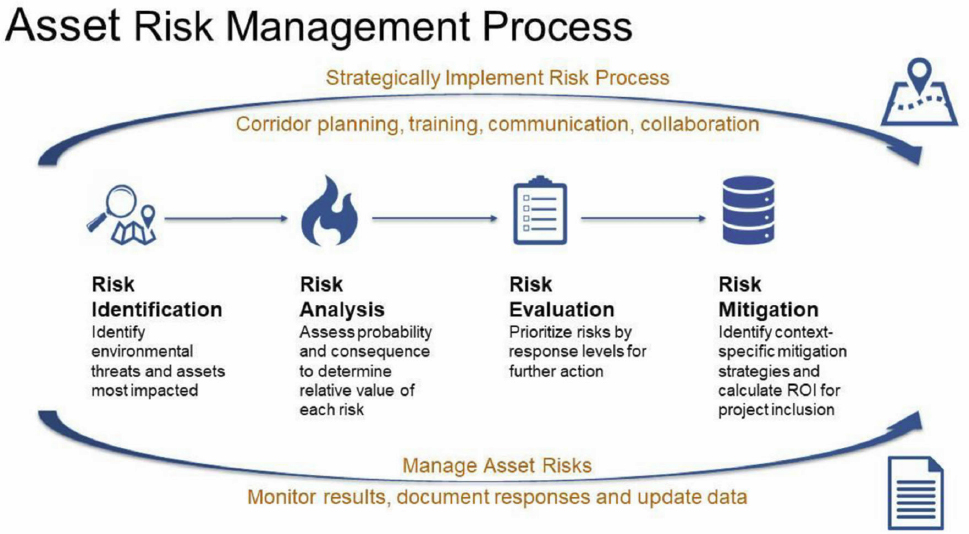
The Department’s senior leadership team initiated the first pilot funded with internal resources. The second pilot was funded in partnership with FHWA, and the final report was completed in June 2020.5 A critical consideration taken from discussions with UDOT staff participating in these pilots was that any new process should be incorporated into existing asset management and planning workflows. The goals of a new asset-based risk management program were to support the Department’s strategic objectives, provide more transparency in decision-making processes and encourage thoughtful analyses when making organizational decisions. The combined efforts evaluated qualitative sources of information, like the institutional knowledge of region maintenance staff, and quantitative data, when available. UDOT’s approach consisted of four steps- Risk Identification, Risk Analysis, Risk Evaluation, and Risk Mitigation (see Figure 28).
Step 1 - Risk Identification: Step one reviewed a range of asset types for consideration in the new risk management program. UDOT’s Transportation Performance Management Division classifies assets into three tiers. Tier 1 assets include pavement, bridge, ATMS, and traffic signals, and these assets are managed as part of the Department’s performance management system. Tier 2 assets include culverts, walls, signs, and barriers and are managed by condition and risk but outside the formal performance management system. Tier 3 assets include cattle guards and fencing and are managed reactively.
The Department reviewed a range of event types, including earthquake, wind, debris flow, rockfall, sinkholes, flood, avalanche, liquefaction, landslide, fire, winter weather, load, and lighting. UDOT selected flooding, rockfall, avalanche, debris flow, and earthquakes. However, earthquakes are only considered concerning bridges. UDOT currently assesses earthquake probability, by magnitude, along three major fault lines, and it uses this information to harden
__________________
5https://drive.google.com/file/d/1lCjChiEnEBqT8gAcaonIhJ8DRacwy0Lt/view
the design and construction of its structures. The study team selected flooding, rockfall, avalanche, and debris flows for inclusion in the new asset-based risk management program. Fires are a major threat in Utah, but the working group did not include fire as a formal threat, using debris flows generated by rainfall on fire-scarred hillsides as a proxy.
Step 2- Compute the Threat Value: The UDOT pilot considered the RAMCAP formula described above. However, it was argued that a measure of vulnerability is only relevant at the failure probability, which corresponds to a probability of one. The equation reverts back to the FHWA formula at a probability of one. The project team defined consequence as the total cost of an asset failure, where Total Cost = Owner Cost + User Cost. The rationale was that it would support the prioritization of competing hardening alternatives. Asset replacement costs are based on planning-level estimates to replace the assets and are intended for comparison and prioritization purposes when evaluating multiple hardening investment options. They are not design-based cost estimates. Owner cost consists of the initial costs to restore traffic operations post-event and the costs incurred to replace the asset. User costs include the costs imposed on system users during the initial shutdown and the costs associated with subsequent asset shutdowns required to replace the asset. The pilots developed asset-specific models for assessing owner and user costs which can be found in the document’s appendices.6
Each event type was calculated as annual threat probability (flood, rockfall, avalanche, earthquake, and debris flow). Flood risk probability was assessed using FEMA flood risk data based on 100 and 500-year flood zones. Rockfall risk probability was based on a rating system developed by Utah State University. Avalanche risk probability was calculated using data from the Utah Avalanche Center, which provided point locations from known avalanches over the preceding ten years. Earthquake risk was only assessed for bridges, as mentioned above. UDOT’s Structures Division has a robust method for evaluating earthquake risk, centered on three major Utah fault lines, the East Cache, Hurricane, and Wasatch faults. Probabilities were assigned based on a study conducted by the U.S. Geological Survey (USGS) on Utah, Idaho, and Wyoming earthquake probabilities. Debris flow probabilities were based on a custom model developed for the entire state of Utah, following procedures outlined in a document developed by the USGS. It included the following data sets: watershed catchment flow lines, precipitation history, soil data, forest cover, slop and watershed ruggedness, and wildfire risk.7
Step 3 - Identify Criticality: Initially, the project team used facility AADT, truck volumes, distance to maintenance sheds, economic value, and redundancy to develop a criticality measure. The final factors carried forward to implementation include AADT and truck volumes, and UDOT will include roadway redundancy in later interactions of their approach.
__________________
6https://drive.google.com/file/d/1lCjChiEnEBqT8gAcaonIhJ8DRacwy0Lt/view
7https://ugspub.nr.utah.gov/publications/misc_pubs/mp-16-3/mp-16-3.pdf; https://www.usgs.gov/core-sciencesystems/ngp/national-hydrography/nhdplus-high-resolution#WhatIsIt; https://hdsc.nws.noaa.gov/hdsc/pfds/pfds_gis.html;https://www.nrcs.usda.gov/wps/portal/nrcs/detail/soils/survey/geo/?cid=nrcseprd1464625;https://www.mrlc.gov/national-land-cover-database-nlcd-2016; https://wildfirerisk.utah.gov/.
Step 4 - Prioritize Risks: As indicated previously, UDOT used the formula Risk = Consequence x Threat. UDOT then developed a Risk Priority Map to catalog the information for use in subsequent analyses.
Implementation: UDOT is currently rolling out its asset-based risk management program. A major element of this effort is how the process fits within the Solutions Development Process (corridor planning process). There is a desire to assess risks and develop mitigation strategies for assets not part of current or planned corridor studies, so the Transportation Performance Management Division is working through how those efforts are completed and coordinated with subsequent corridor studies. At the same time, the Department is continuing to evaluate techniques for assessing and measuring system redundancy and additional improvements to the process.
Waka Kotahi New Zealand Transport Agency (NZTA) Approach
The value of New Zealand’s Road and rail network is estimated at NZ$80 billion (National Infrastructure Unit, 2015) and is considered vital for moving people and goods. At an intuitive level, if economic vitality and community cohesion are considered, the value of the transportation network is exponentially higher. NZTA is focused on understanding the interdependencies of its infrastructure systems and the risk of cascading effects caused by asset failures from disruptive events, human-made or natural. The World Global Economic Forum’s Global Risks Report of 2019 stated that the world’s three highest risks are extreme weather events, natural disasters, and the failure of climate adaptation and mitigation. The NZTA report also added that there is growing evidence that the use of historical trends to assess the probability of extreme events fails to predict their occurrence fully.
A core assumption of the NZTA effort is that economic and community vitality rely more and more on transportation networks at local, regional, national, and international scales. Significantly, there is also a growing understanding of the interdependent nature of these transportation networks and how they affect other vital infrastructures. Building resilience requires understanding these complex relationships to develop a strategic approach to managing risk. Figure 29 shows the systems-to-systems interrelationships between different infrastructure types, and Figure 30 illustrates the downstream dependencies of a transportation asset.
NZTA undertook this research effort to understand better critical infrastructure interdependencies and the methods used to assess them. The research was aimed at 1) building on the existing body of knowledge about the relationships between transportation networks and other infrastructure systems, 2) identifying and reviewing existing methods, tools, and platforms to assess interdependencies, 3) developing a methodology to assess interdependencies between transportation networks and wider infrastructure systems and use
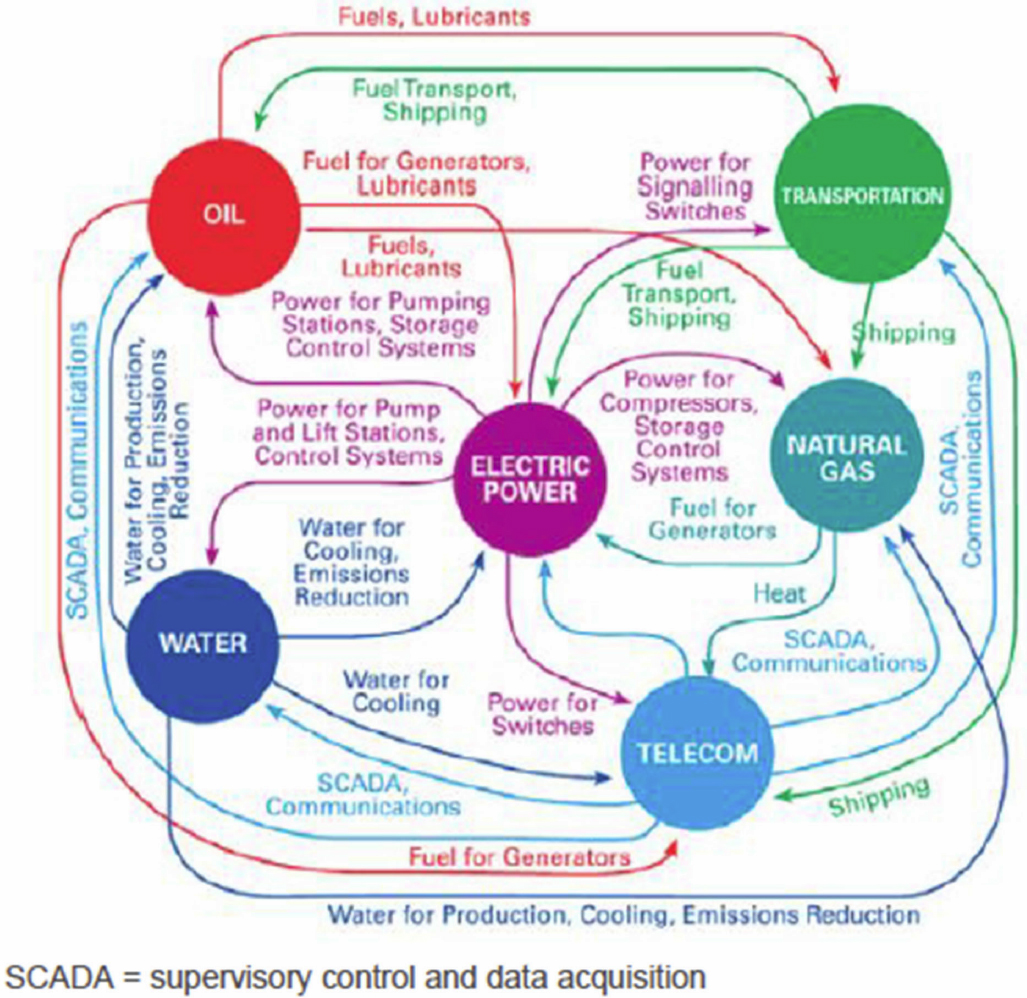
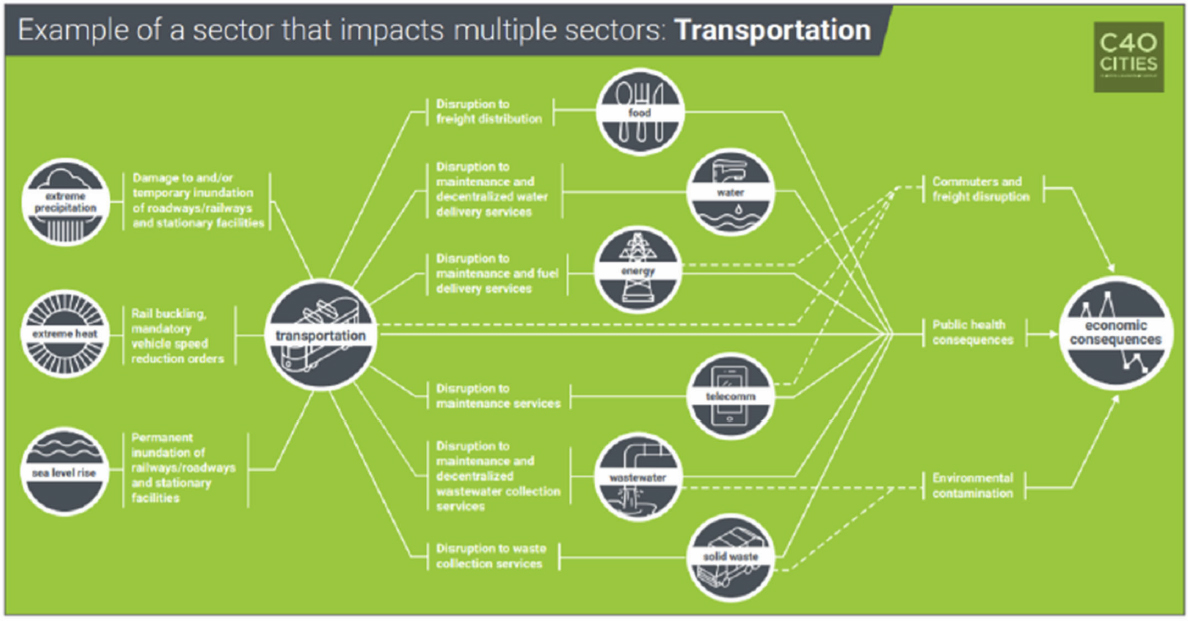
pilot studies to assess those methodologies, and 4) identifying a range of potential risk treatment options to manage interdependencies.
The research effort consisted of five phases visualized in Figure 31:
- Phase 1a: Literature review and gap analysis
- Phase 1b: Methods and techniques review
- Phase 2: Develop of preferred methodology
- Phase 3: Pilot study
- Phase 4: Development of risk treatment toolbox and investment decision-making
- Phase 5: Conclusions, summary, and next steps8
While NZTA recognized the importance of calculating risk probabilities, the agency was primarily concerned with understanding and measuring the consequences of critical asset failure. The New Zealand Lifelines Council defines critical assets as those that “are especially significant to societal well-being and that therefore merit priority attention by utilities in emergency response.” Critical assets can also be defined as those with a high consequence of failure (NAMS Group, 2006). The Lifelines Council categorized critical assets into three tiers. Tier 1 assets are of national significance, Tier 2 assets are of regional significance, and Tier 3 assets are of local significance. The NZTA effort used the following characteristics to describe the criticality of transportation assets from a transportation network perspective:
- Movement of people and goods based on AADT, heavy commercial vehicles, buses, and active modes,
- Economic and social routes that link places providing connectivity to ports, airports, tourism, and hospitals,
- Access to lifeline utilities, routes that provide access to essential facilities such as water supply and power generation, and
- Access to essential services, including gas stations, police, fire, and emergency operations.
__________________
8Phase 1a, 1b and Phase 2 are the subject of the effort outlined in this case study.
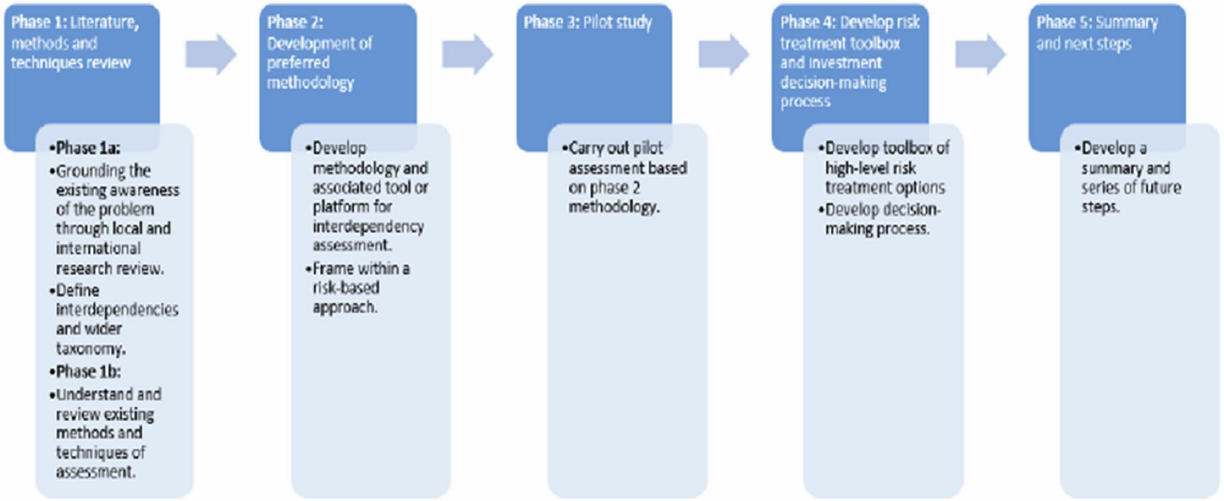
The research effort initially distinguished between dependencies and interdependencies, the difference being the direction of interactions between the two systems. A one-way relationship indicates a dependent relationship, and a bidirectional one depicts an interdependency. The research effort then went on to use the terms interchangeably. The NZTA team categorized four interdependency typologies to categorize the complex relationship between different infrastructure types and different infrastructure systems. The four typologies are:
- Physical: A transfer of resources, the element of one becoming the input of another; shared physical dependency between two elements and a third; elements serve a hazard reduction function,
- Digital: A cyber transfer of information; a shared dependency of two elements on the transfer of information from a third-party source,
- Geographic: Elements are located in the same place or within proximity, and
- Organizational: Elements are linked through a financial or logical mechanism; they are organizationally related by shared ownership, governance, or oversight; elements are mutually dependent on the services of a third-party organization.
NZTA then defined three dimensions to help characterize the typologies:
- Order: Relating to the number of cascades in a downstream direction,
- Directionality: Either unidirectional or bidirectional, and
- Strength: Referring to the level of impact on a downstream infrastructure.
The NZTA team reviewed several models on infrastructure interdependencies to determine if any are appropriate for assessing the interdependencies of the transportation sector. The models included:
- Circle Tool (Deltares, 2018),
- XDI Platform (XDI Pty LTD, 2019, 2020),
- Infrastructure Interdependency Model (Zom & Shamseldin, 2015; Zorn et ca., 2017, 2018, 2020),
- MERIT- (Buxton, R., 2013), and
- DOMINO- (Polytechnique Montreal).
None of the models were found to capture all the interdependence typologies; thus, a hybrid model will be needed and developed in a subsequent phase.

The research report recommends a framework that consists of a core interdependency module, with optional modules that could be added in subsequent phases to enhance functionality (see Figure 32).
The core module links geospatial data, evaluates interdependencies, and links to criticality. The other modules would be added in the future to provide additional functionality. At a macro level, the core module utilizes asset network data. It also allows users to create linkages between interdependent networks and evaluate their interdependencies to develop a modified criticality score based on the connections between transportation networks and lifeline utilities. The study recommended combining the physical and digital typologies because they act in a similar linear fashion. The geographic typology would stand alone, and the team suggested forgoing the organizational typology until future updates are made. The process for assessing digital and physical interdependencies includes the following three steps 1) identify interdependent relationships and develop an informal network, 2) calculate dependency ratings and a modified criticality score, and 3) extend the modified criticality along the road network.
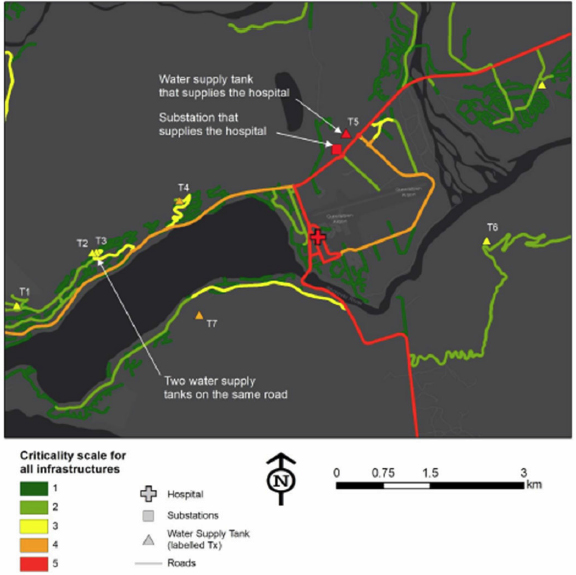
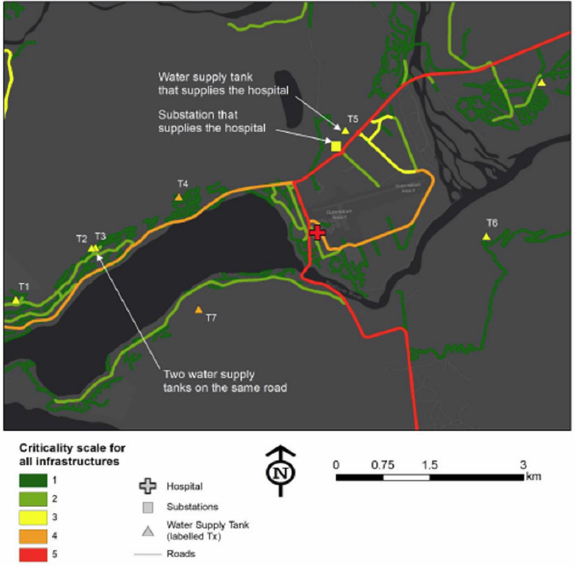
The process for assessing geographic interdependencies includes 1) establishing the corridor and identifying geographically co-located infrastructure, 2) determining a geographic interdependency rating, and 3) determining a modified corridor criticality score. The NZTA project team conducted several pilots to evaluate the proposed processes. Figure 33 represents the modified criticality asset scope when considering downstream impacts, and Figure 34 illustrates the criticality score for assets without considering downstream effects.
Next Steps: The study recommended the following next steps:
- Pilot the proposed methodology with key stakeholders,
- Conduct further work on the protocols and procedures for data collection, sharing, and maintenance,
- Further evaluate whether the proposed process can fit with existing interdependency models,
- Develop a user interface, and
- Link to communities and socially vulnerable population estimates in current transportation system plans to develop a place-based, customer, and community perspective.
Critical Assessment of Success or Challenges of Approach
The resilience-based risk management approaches of UDOT and the NZTA took different paths, each focusing on different aspects of the risk equation. These different perspectives offer a holistic view of how one might incorporate resilience into existing workflows or enhance an existing resilience practice. As previously noted, the basic formula for assessing transportation network risk is Risk = Consequence x Threat. UDOT focused on calculating the probabilities while giving cursory treatment to quantifying consequence/criticality. The NZTA team, on the other hand, focused their efforts on understanding consequence/criticality while only taking a cursory look at calculating threat probabilities.
UDOT decided early that its new risk management process would be incorporated into existing workflows. Before the risk pilots, UDOT had spent considerable effort connecting their planning, performance management, programming, and project development workflows into an integrated systems approach. At the core of this effort was the development of an intermediate planning process called the Solutions Development Process. This process is intended to advance needs established in the long-range planning process into comprehensive, contextually based corridor/area solutions. Risk and resilience became a core contextual component of this process. From this aspect, the pilot and subsequent implementation of the non-bridge risk management process was considered a success. However, the two biggest challenges of the UDOT approach were 1) when to conduct detailed calculations of threat probabilities and 2) how best to consider transportation network redundancy in the rural areas of the state. The recommendation set the issue of rural network redundancy aside for subsequent implementation phases.
Regarding quantifying the probability of threats, staff pushed back on evaluating risk probabilities for the entirety of the Department’s portfolio of non-bridge assets. Data availability was an issue, but they did not feel the return would be sufficient for the effort required to run the numbers for each applicable risk type and each asset. The project team ultimately decided on a two-step approach: 1) qualitatively assess the threat to individual assets by using the institutional knowledge of staff, and if a more detailed answer was necessary for investment decisions, 2) quantify the risk threat using available data and the techniques outlined in the pilot studies. UDOT has implemented the process and is rolling it out to the Department’s regions. Staff members expressed that they believe it will take time to fully flesh out the pilot’s recommendations and are planning a continual improvement process. In this regard, the approach was a success, and the challenges faced are valuable lessons for other agencies.
The NZTA process differed from the UDOT process in that NZTA’s intention was to conduct research that could inform future risk and resilience policy direction. Their exploration of interdependency and cascading effects revealed two particularly salient points; one regarding the quantification of criticality and the other concerning the strategic consideration of what should be considered when an agency embarks on implementing a risk and resilience process. Regarding the quantification of criticality, the development of interdependency typologies helps dissect the complexity of infrastructure relationships so that the actual consequence of an asset’s failure can be assessed. Concerning strategic considerations, a discussion of interdependencies and cascading effects can help agencies and private sector stakeholders
responsible for various elements of the resilience cycle develop a systemic perspective of resilience. Discussions about interdependencies and cascading effects among the various stakeholders in the resilience cycle can facilitate better anticipating and planning for cascading, systems-to-systems effects.
Replicability of The Approaches for Other Agencies
Generally, elements of both agencies’ approaches can be replicated by DOTs and other transportation agencies. The UDOT approach consists of practical, incremental steps that other DOTs and transportation agencies can adopt and learn from in building consensus and establishing the business case for implementing an asset-based risk management program. The UDOT approach also has relatively light human and financial resource requirements. Also, the incremental approach to implementation seems to have caused little disruption to existing workflows. On the contrary, the UDOT approach shows that an asset-based risk management approach can practically be incorporated into existing agency workflows.
One challenge faced in the process was the quantification of network redundancy. The consultant team recommended basing the redundancy score on the proximity to other route nodes. This question was still unresolved following the pilots and remains under evaluation by UDOT. Another challenge was the quantification of risk/threat. The consultant team presented a comprehensive approach for quantifying risk/threat, but the staff determined the approach was too burdensome for global application. UDOT is moving forward with its asset-based risk management program, and its experiences can be used to help other agencies.
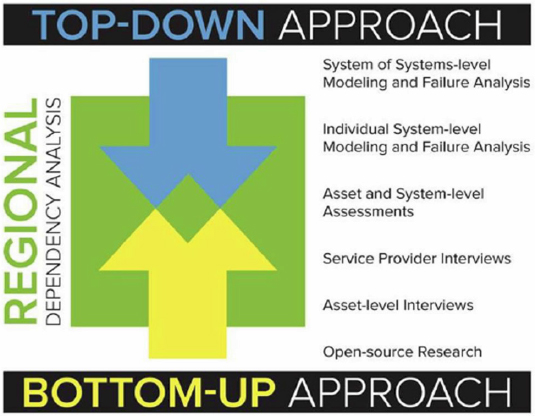
The NZTA approach was more research-oriented, and its primary purpose was to inform future policy decisions. At a practical level, the NZTA approach developed straightforward interdependency concepts to assess the criticality of an asset. These concepts are valuable to U.S. DOTs by informing strategic and tactical approaches to implementing resilience and asset-based risk management programs (see Figure 35). These concepts also present a blueprint for developing additional methods of quantifying interdependencies and cascading effects.
In terms of challenges, exploring existing interdependency models and proposed model modifications in the NZTA recommendations would likely pose hurdles for most state DOTs and their agency partners. It is important to note that the NZTA process is a multiphase process, and there will likely be improvements to early interdependency quantification methods.
Key Takeaways
- The concepts of interdependencies and cascading effects are useful at the tactical and strategic levels. At the strategic level, these concepts can help agencies better understand the interrelationships of systems and coordinate with other resilience cycle actors to improve planning, response and recovery efforts, and overall resilience. At the tactical level, the concepts of interdependencies can help quantify the relative importance of assets to other assets, which helps quantify risk and improve mitigation measures.
- Even in more progressive, innovative organizations, changing established workflows can be demanding and generally requires a systematic and incremental approach that builds a business case for and establishes buy-in to the proposed changes.
- There is a distinction between mitigation and resilience-based approaches, and both should be considered in tandem when implementing resilience in transportation networks.
- There are trade-offs between qualitative and quantitative assessments of risk/threat, and it is necessary to evaluate critically when best to use one or the other.
3B.1: COVID-19 Food Supply Chain Disruption in the U.S. Midwest
Summary
Coronavirus Disease 2019 (COVID-19) is an often-severe respiratory illness that spreads person-to-person, primarily via short-range aerosol transmission (i.e., inhaling infectious particles). The first case of COVID-19 in the United States was confirmed in January 2020 (Spread of COVID-19 Within the United States, 2020). After the outbreak of COVID-19, demand for many items, particularly grocery and healthcare items, increased rapidly (Mohammad Behnam et al., 2020). At the same time, the demand for last-mile delivery increased due to lockdown and social distancing measures (Gray, 2020). Meeting this demand surge required more truck drivers; however, the shortage of truck drivers was an ongoing challenge even before the pandemic (B. M. Singh, 2020). Analyzing transportation disruptions in the Midwest during the pandemic is informative because of its strategic location and concentration of essential transportation hubs. For example, Illinois is one of the largest U.S. freight hubs, and trucks carry over half of that freight (Illinois State Freight Plan, 2018). Therefore, the disruptions caused by the exacerbation in the shortage of drivers can be seen more evidently in this region.
This case study explores supply chain disruptions after the outbreak of COVID-19 in the Midwest, emphasizing the role of transportation infrastructure. COVID-19 impacted the supply chain due to disruptions in supply sources, transportation delays, and demand uncertainty. Indiana, a manufacturing state, faced issues in importing parts from China. Inside Indiana Business reported that in 2019, Indiana imported $7.7 billion in goods from China. The imported goods include motor vehicles, furniture parts, pharmaceutical components, and orthopedic products (Wes Mills, 2020). Even if suppliers are available, some industries producing non-essential items have to shut down because of decreased demand for their products (DePass, 2020). Food and healthcare supplies experienced enormous surges in precautionary buying (The effect of precautionary buying, 2020). Precautionary buying is a consumer behavior resulting from fear of a shortage of certain products during a crisis, leading them to buy considerably more than is sufficient for their immediate needs. Precautionary buying causes challenges by significantly altering the availability of certain essential products, leaving an alarming number of customers without access to them. Another dramatic challenge to the supply chain during COVID-19 has been the demand surge for last-mile delivery as people endured lockdown measures and have increasingly opted for more socially distant alternatives (Gray, 2020). However, the shortage of available truck drivers has increased the wait times for delivery (Commendatore, 2020).
In the food industry, supply chain disruptions were significant in milk and meat distribution (Good, 2020; Trapani, 2020). The Midwest is the primary provider of meat in the United States. According to U.S. Department of Agriculture data, in May 2020, cattle slaughter decreased by 37% compared to the last year’s data while capacity decreased from 10% to 15%. The reason for the decrease in capacity was the closure of meat packing plants due to the rapid spread of COVID-19 among their workers (Good, 2020). The data indicates that in the meat industry, disruption at the packaging and distribution level of the supply chain was greater than at the production level. This bottleneck was observed in meat plants in Wisconsin, Illinois, Iowa, Minnesota, and Indiana (Meat Industry in Midwest, 2020). At the distribution level of the
supply chain, the lack of truck drivers and containers resulted in significant transportation delays (Gray, 2020).
This case study provides an initial overview of the transportation infrastructures before the pandemic and identifies its vulnerabilities. Next, it summarizes the events during the pandemic that contributed to transportation disruptions. Finally, the lessons learned from the study are delineated.
Keywords: response, risk assessment, multimodal, supply chain resilience, pandemic
Overview of Transportation Infrastructure Context Prior to COVID-19
Evaluating disruption in the transportation system in the Midwest during the pandemic requires understanding the complexity of infrastructure, the scale of the affected supply chain, the vulnerabilities of the businesses impacted, and the characteristics of the community before the pandemic.
Complexity of Existing Infrastructure
Quality of life and economic growth depend on a resilient transportation system. Transportation infrastructure consists of roadways, railroads, waterways, airports, pipelines, and intermodal facilities. Transportation modes support inbound, outbound, within, and overhead transportation flows. In the inbound freight flows, the freight’s origin is another state or nation destined for the current state. The outbound freight flows comprise commodities originating in the current state while destined for another state or country. Within freight flows are those originating and destined for locations within the current state. Overhead freight flows pass through the current state, with both origin and destination outside the current state. Midwestern states have different flow characteristics. For instance, in Wisconsin, overhead flow outweighs other types of flows. In Illinois and Indiana, within flow is more significant than other flow types.
In the Midwest, trucks carry the highest proportion of commodities with the highest cost value relative to other modes (Illinois State Freight Plan, 2018; Wisconsin State Freight Plan, 2018). A common challenge in midwestern transportation infrastructure is that truck flow exceeds the highways’ capacity and causes congestion. One solution proposed by state DOTs is to shift freights from highways to railroads. This shift can be better accomplished with increased support for multimodal transportation. Shippers can ship commodities by truck to the point that rail is accessible. Another solution proposed in Iowa is consolidating small truck shipments by improving cross-docking because it was observed that a significant volume of domestic trucks carries small loads (Iowa Freight Strategy, 2016).
Scale of Affected Supply Chains
Disruptions caused by shortages and closures led to delays throughout the supply chain system occurring at all levels, including suppliers, manufacturers, shippers, retailers, and customers.
Vulnerabilities of Businesses and Community Characteristics
The Midwest is the primary supplier of meat in the United States. Iowa, Nebraska, and Minnesota are the top hog, cattle, and turkey producers, respectively (The United States Meat
Industry at a Glance, 2017). Iowa transports food to a wide variety of locations, including ports that prepare cargo for international destinations. Transportation delays resulting from COVID-19 often cause spoilage in perishable products such as meat. The lack of workers and containers required for intermodal transportation has led to significant delays at ports worldwide (COVID-19 Impact on Iowa’s Supply Chain, 2020). In a recent publication, Dr. Novakovic, professor of Agricultural Economics at Cornell University, summarized these effects resulting from the lack of transportation resilience in food distribution. “Transportation disruptions could quickly scale to an industry problem. For fresh products a transportation delay could result in product spoilage or at least enough of a degradation in quality to have a price effect. I think it’s the transportation system where we are most vulnerable to labor disruptions that have widespread consequences to the food system” (Novakovic, 2020).
Indiana, a leading manufacturing state, faced issues importing vehicle parts and pharmaceutical products from China. The reason for the delay was the shutdown of relevant industries in China. Additionally, delays in the international port system, as previously described, worsened the situation.
Summary of Relevant COVID-19 Events
Table 2 displays the timeline of supply chain disruptions following the outbreak of COVID-19. One of the primary disruptions that affected Midwestern industry was the closure of meat processing plants in February 2020. This event negatively impacted the economy of the region because the Midwest is one of the primary meat suppliers in the United States. Iowa State University economists estimated more than $2 billion was lost in the pork industry, $700 million in beef, $800 million in corn, and more than $200 million in soybeans (COVID-19 Impact on Iowa’s Supply Chain, 2020). In March 2020, a slowdown in the importation of pharmaceutical products and vehicle parts from China caused significant disruption in Indiana manufacturing plants. In addition to these supply and manufacturing disruptions, the lack of containers caused delays in intermodal transportation (Wes Mills, 2020). In April 2020, Iowa faced a lack of PPE due to increased customer demand (Eller, 2020). In May 2020, a disruption in the milk supply chain occurred in Ohio. Although milk was available, farmers could not get the milk to market due to the lack of workers for packaging and labeling. The lack of packaging and labeling capacity was a particularly difficult challenge for dairy producers because there are strict packaging and labeling requirements for dairy products in the United States (P.J. Huffstutter, 2020).
Table 2: TIMELINE OF SUPPLY CHAIN DISRUPTION AFTER COVID-19 OUTBREAK
| Event | Geographical Location | Supply Chain Level/Industry Impacted | Month (2020) | Source |
|---|---|---|---|---|
| Lack of trucks and truck drivers | U.S. | Transportation among all levels of the supply chain, specifically last-mile delivery | Persistent and pre-existing | (B. M. Singh, 2020) |
| Shipping problems in businesses due to worker absences | U.S. | Transportation among all levels of the supply chain, especially ports and last-mile delivery | February-Present | (DePass, 2020) |
| Meat processing plant closures; slow operations in meat packing plants for maintaining social distancing; personnel reduction due to the prevalence of COVID-19 among workers in meat and poultry processing plants | Iowa | Meat and poultry supply chain; supplier and distributor | February - Now | (Iowa Assists Pork Producers, 2020) |
| Slowdown of imports from China (e.g., pharmaceutical products, orthopedic inputs, motor vehicle and furniture parts); shipping container shortage | Indiana | Transportation; supplier and manufacturer | March | (Wes Mills, 2020) |
| Rest stops and parking closures; COVID-19 Emergency Declarations do not apply to trucks having mixed loads of emergency relief and other commodities | Illinois and Michigan | Trucking and transportation; shipping | March | (American Trucking Association, 2020) |
| Increased demand for PPE; lack of timely orders, and depleted warehouses | Iowa | PPE supply chain; distributor and retailer | April | (Eller, 2020) |
| Decreased number of trucks for transporting products to the market; wasted the dumped milk due to delay in packaging | Ohio | Dairy product supply chain - Transportation | May | (Trapani, 2020) |
| Lower availability of livestock feed; increased cost of input supplies; limited working hours; meat processing plant closures; animal euthanasia; different equipment and packaging requirements for shipping meat to grocery stores instead of restaurants; restaurant closures | Ohio | Meat and poultry supply chain; supplier and distributor | May | (Farm, Food, and Agribusiness COVID-19 Impact Survey, 2020) |
| Meat packing plant closures; livestock euthanasia; product spoilage due to delay in transportation; failure to discharge “non-essential” cargo due to national lockdown | Iowa | Supplier- Transportation | June | (COVID-19 Impact on Iowa’s Supply Chain, 2020) |
The primary impact affecting supply chain response was customer demand surge related to precautionary buying of critical items such as PPE and groceries. Moreover, increased demand for last-mile delivery also increased simultaneously with a decrease in the number of available workers in the packaging and freight industries. The number of poultry and meat processing
workers rapidly declined when 4,913 out of 130,000 employees tested positive for COVID-19 (Gibbins et al., 2020). A similar rapid decline in available truck drivers is linked to the closures of Departments of Motor Vehicles (DMVs) in 27 states. These closures postponed licensing processes and shut down commercial driver training classes (B. M. Singh, 2020). The temporary closure of many rest areas and truck parking facilities further exacerbated these issues (American Trucking Association, 2020). Survey results of supply chain managers from nine midwestern states indicated that two-thirds of the managers experienced transportation delays after COVID-19. Survey results also revealed that 54.3% of those surveyed reported significantly elevated worker absences during the pandemic (DePass, 2020). Further complications resulted as various industries experienced facility shutdowns, causing a shortage of raw materials and essential parts. Figure 36 illustrates the overall flow of the supply chain system and how multiple disruptions impacted different levels after the outbreak of COVID-19.
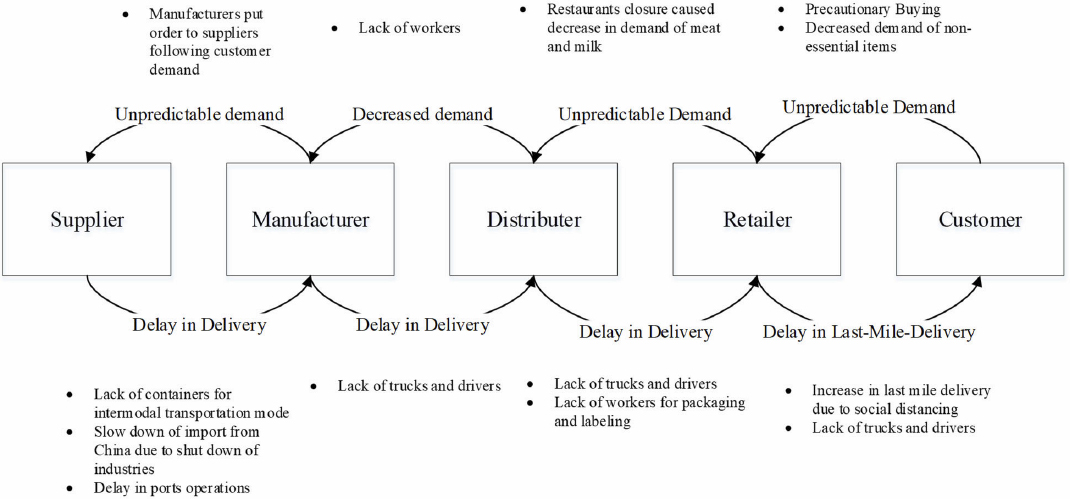
Learned Key Takeaways
The COVID-19 pandemic has extensively impacted the production, transportation, and supply of perishable products. The impact has been particularly challenging in the U.S. Midwest where the production of dairy products, meat, and other non-perishable items has suffered from the disruptions created by the pandemic. The pandemic produced a steep customer demand surge due to precautionary buying of critical items such as PPE and groceries. Combined with the decrease in the number of available workers in packaging industry and transportation networks. This case study has highlighted the vulnerabilities of transportation network operation and, more specifically, the vulnerabilities of the supply chains in the Midwest.
3B.2: Howard Street Tunnel Fire, Baltimore, MD
Summary
The Howard Street Tunnel Fire is an example of a chokepoint within the freight network that caused disruptions in the supply chain along the East Coast when a derailment caused a fire to break out in the tunnel, closing the rail route for over a week. This case study looks at the response to the incident and recommends mitigation actions to reduce network disruptions of this type in the future.
The Howard Street Tunnel on the Baltimore Belt Line is a crucial link in what has become the principal rail freight line from Baltimore to Philadelphia and beyond. This segment of the CSXT network is considered a chokepoint for freight train service from the Port of Baltimore to East Coast and Midwest markets.
On July 18, 2001, a 60-car CSXT freight train derailed in the Howard Street Tunnel, sparking a fire that burned for six days and blocked traffic for much longer. The Howard Street Tunnel Fire called attention to the Baltimore Belt Line and the use of the tunnel as a through-route for East Coast freight, both as a risk to the surrounding structures and as a link in the overall freight transportation network. CSXT has implemented various improvements to increase the integrity of the link, and alternative routes were explored with a $1-3 billion price tag.
In 2016, a $425 million design was proposed to enhance the tunnel to meet double-stack train heights. This option recommended creating the necessary additional clearance of 1.5 ft in the tunnel by trimming and notching the arched ceiling and lowering the tunnel floor by replacing the current wooden ties with steel crossties.
In 2019, after many attempts to receive federal funding to help improve the tunnel, the state of Maryland was successfully awarded a $125 million Infrastructure for Rebuilding America (INFRA) grant for the project.
Although the fire department was able to respond to the emergency, delays wasted considerable time, including an approximate 1-hour delay in initially notifying emergency responders of the derailment. Sharing the details of the incident between the private asset owner and the public agencies suffered from significant compartmentalization. The delay in appointing a public information officer and placing them at the scene also slowed communication links between the public, media, incident command, emergency offices, CSXT, and city, state, and federal officials.
Improved coordination and information sharing between the city, the railroad, and local responders could have potentially prevented or limited damage, disruption, and other losses that occurred to the tunnel, surrounding infrastructure, and business activity in the downtown area.
Recommendations include increasing multiagency (public-private) joint training exercises to improve a coordinated response and communication during an event of this type, sharing engineering and maintenance drawings of the respective public and private assets, and ensuring the roles, responsibilities, and communication protocols are in place before an incident.
Keywords: response, redundancy, flood, fire, railway
Description of the Context of the Disruptive Event
Case Study Focus
- Modal single point of failure
- Multiagency communication/cord
- Long-term recovery
Type, Size, and Duration of the Disruption
Modal Network Closures
Complexity of the Network Affected
- Multistate Freight Rail Network
- Downtown Baltimore Transit and Street Network
- Utility Network – Water, Electricity, Communication Networks, Phone, Fiber / Internet Services
Overview of the Context in Which the Event Occurred
On July 18, 2001, 11 cars of a 60-car train, including tankers containing toxic acids, derailed inside the 1.7-mile CSX Howard Street Tunnel that runs under the city of Baltimore’s central business district. A tanker carrying tripropylene was punctured, and the chemical caught fire. A 40-inch water main directly above the tunnel also ruptured, sending water into the tunnel, collapsing several city streets, and flooding nearby buildings. The incident shut down entire sections of the city as well as rail transport, communications, and utility services (see Figure 37).
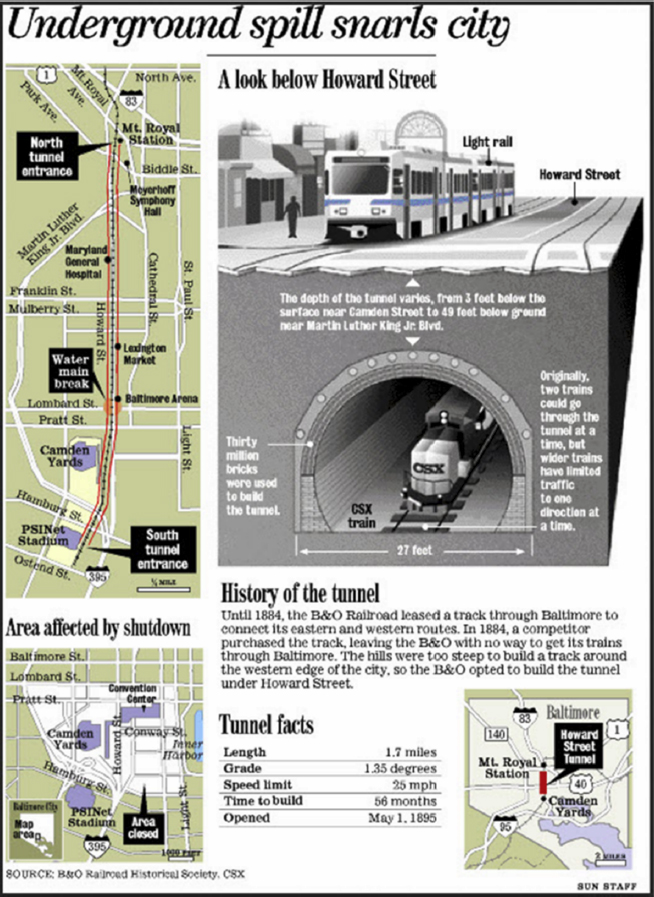
Key observations:
- The case illustrates how compromise of a rail facility can have cascading effects on both passenger and freight access, affecting workforce and supply chain dynamics in a while community.
- The case demonstrates the national capacity and routing implications of a localized disruption. This event caused CSX to have to reroute freight traffic via Cleveland, OH. It was estimated based upon media publication that the at the time of the event the tunnel carried 28 - 32 trains per day.
According to a November 2005 report to Congress:
“The tunnel closing caused major disruption to CSXT freight traffic, Maryland Rail Commuter (MARC) commuter trains, and to Central Light Rail Line trains and bus lines that traversed Howard Street. To avoid the Howard Street Tunnel, CSXT had to send freight trains west to Cleveland, north to Albany, New York, and then south to Baltimore, incurring a three- to four-day delay. Some CSXT trains were rerouted via the busy NS line through Manassas, Virginia, Hagerstown, Maryland, and Harrisburg, Pennsylvania. At one point during the fire, eight CSXT trains that would have used the tunnel were detoured through Cumberland, Maryland, and Youngstown, Ohio; five through Hagerstown and Harrisburg; five through Cleveland and Albany, New York; and 12 trains were stopping in various yards.”
(FRA, 2005)
The incident forced thousands of downtown workers to be evacuated from their workplaces for multiple days until there were assurances that the area was safe from fire and flooding. The event impacted Maryland Transit (MARC) passenger rail service for days, and bus routes had to be arranged to move passengers to and from the BWI Amtrak/MARC station. MARC service was not restored until five days later.
Due to street closures around the intersection of Howard and Lombard Streets, where the water main break occurred, heavy congestion resulted on most of the surrounding roadways, including the I-395 spur into Baltimore. It took six days for all but the blocks immediately surrounding the water main break to be reopened to vehicle traffic.
Although the fire was extinguished in the tunnel, the area remained dangerous for an extended time. Three weeks after the event, maintenance hole covers along West Pratt Street were blown into the air because of underground explosions caused by residual chemicals leaking into the sewers after the derailment and subsequent fire.
The 2005 Report to Congress on the accident reported the following effects of the event:
- Officials canceled three Baltimore Orioles games, resulting in a $5 million loss to the organization.
- Howard Street was closed for five days, along with 14 other cross streets.
- A two-block length of Howard Street remained closed for six more weeks.
- MTA Maryland rerouted 23 bus lines, and MARC Train service to Camden Station was suspended.
- The fire and burst water-main damaged power cables and left 1,200 Baltimore buildings without electricity.
- Severed fiber-optic lines congested traffic regionally and nationally because the fiber-optic cable through the tunnel is a primary line for the extraordinarily busy Northeast Corridor.
- The Inner Harbor was closed to boat traffic.
- A water main break near the tunnel caused the collapse of part of a major thoroughfare, resulting in power outages.
- A severed fiber-optic cable in the tunnel was a critical East Coast internet communication link belonging to WorldCom. The break slowed internet service around the U.S. for several hours.
- Water from the water main break caused further damage to the communication lines. According to the report, WorldCom had to install a fully redundant network bypass around the incident, accomplished in 36 hours, allowing the resumption of East Coast and transatlantic internet communications.
- MTA shut down light rail service through the city for over seven weeks, with shuttle buses running between the North Avenue and Patapsco stations and later between North Avenue and Camden.
- The intersection at Howard and Lombard Streets, one of the busiest in the city, was not reopened until September 5, almost two months later.
Impacts on Network Performance and Supply Chain Responses
Primary
Derailment of a CSX train in the Howard Street Tunnel caused a tunnel fire. NTSB could not determine the cause of the accident, in their report they stated “the most likely scenario that could have resulted in the derailment involved an obstruction between a car wheel and the rail, in combination with changes in track geometry.”
Secondary
The heat from the fire caused a water main to break, triggering flooding in the tunnel and forcing the city to shut off water service to the area as well as the light rail line above the freight tunnel. With the tunnel’s integrity in question, the city also had to shut down surrounding streets and evacuate nearby buildings.
Tertiary
Rail freight routes through the tunnel were closed for over five days during the fire and flooding, causing further traffic congestion on the roads. The closure of the rail tunnel disrupted rail service to the Port of Baltimore, requiring cargo to be transported by truck on the local highways and adding more vehicles to the already clogged roadways. The unavailability of rail transport also increased the transportation costs of these goods.
Range of Impacts
Damage/Cost
The damage shut down the city for days, postponing baseball games, costing businesses millions of dollars, and forcing the city to pay overtime for emergency crews and cleanup.
In July 2004, the city of Baltimore sued CSXT, charging that the company was responsible for the incident and seeking $10 million in damages.
Operational Effects
The tunnel closure required CSXT to reroute freight rail around Baltimore via Cleveland, OH. The lack of passenger and freight rail interoperability near Baltimore is detrimental to resilience when there is such an incident. The CSXT and NEC routes for through traffic are entirely separate. In an emergency, there is no way to reroute CSXT traffic via NEC lines or vice versa.
Long Lasting Institutional Effects
The Howard Street Tunnel Fire resulted in multiple lawsuits, creating additional strain on the relationship between the city and CSXT, and complicated the path toward the modernization of the tunnel. Since there is no structure deficit to the tunnel, the Port of Baltimore’s desire to attract more cargo, and the efficiency of double-stack trains, CSX was not willing to participate in the funding of a new tunnel to support Port expansion.
The Port of Baltimore’s competitiveness and interconnectivity are vital to Maryland’s economy. According to the Maryland Port Administration, the port generates $1.5 billion in business revenue annually. The port’s activities also support over 112,000 Maryland workers, 16,000 directly, 17,000 indirectly, and more than 79,000 benefiting from port-related business. The port annually puts $2 billion in the pockets of Maryland’s workforce. Due to capacity, speed, and loading constraints, all rail freight movements between the northeast and southwest parts of the Port of Baltimore are difficult and costly to accomplish. Furthermore, due to clearance limitations, the northeast part of the port cannot route many types of shipments west via the CSXT, and the southwest part has similar constraints. This lack of interconnectivity and routing flexibility detracts from the port’s efficiency and attractiveness.
Long-Term Funding for Tunnel Replacement
A new replacement freight tunnel’s economic benefits would accrue from the clearance and congestion relief on the only rail freight route in the I-95 corridor. The city and state applied for federal funding multiple times before success in 2019.
Over the past decade, there have been discussions about replacing or renovating the tunnel so that double-stack trains can cross Baltimore. As of the time of this study, the ports are on the eastside of Baltimore, and the way west is by way of going thru Baltimore, on either the CSX or the Northeast Corridor, both of which have to go through the Howard Street Tunnel built at the turn of the 1900s before large loads were being carried by the railroads. As of December 2019, it was announced that CSX and Maryland have secured a $100+ million shortfall for the estimated $466M project, so plans are underway to raise the ceiling by 18 inches (just in the area of the ceiling where the double-stack trains will be) and lower the floor and use metal ties to help lower it a few more inches.
Lessons Learned
Emergency preparedness plans were found to be lacking. The city emergency response documents do not have procedures for dealing with the discharge of hazardous materials. Baltimore was explicitly urged to update and revise their emergency preparedness documents to include information on the discharge of hazardous materials in tunnels. The Public Information Officer’s notification and arrival on-site was delayed because of unclear definitions of each stakeholder’s communication roles and responsibilities, despite the fire department having participated in recent training
This incident demonstrated the importance of disaster preparedness and the benefit of conducting field exercises. Before the incident, the Baltimore City Officials had conducted drills on the city’s tunnels. Nevertheless, the drills were only to prepare them for a passenger train accident, but not a situation involving fire. However, this exercise had acquainted the fire personnel with the tunnel environment, which proved beneficial during the response to the derailment and immediate aftermath.
The poor communication between the city of Baltimore and CSXT concerning the tunnel, including maintenance and construction activities within and in the vicinity of the Howard Street Tunnel, delayed response activities. For example, a partially repaired void in the tunnel’s arch that “neither CSX nor the city of Baltimore knew of or had documentation about when the void was first discovered or who had initiated the repair.” The NTSB urged Baltimore and CSXT to “enhance exchange of information” on critical infrastructure and potential interactions of these assets during an incident.
In the NTSB report, CSX was urged to “maintain historical documentation of inspection and maintenance activities affecting the Howard Street Tunnel.”
References to Examples of Emergency Response Plans of different types of Agencies
Examples of Training Drills including
- Discussion Guides
- Tabletop Exercise Templates
- Example Scenarios for Training Activities
- After-Action Report Templates
Recommendation of stakeholder inclusion in these discussions and training drills to broaden expertise and understanding.
The following matrix is a mapping of stakeholders and actors in the event, their requirements, vulnerabilities, and roles for use of a resilience toolkit and outcomes that may be sensitive to equipping such actors in such events.
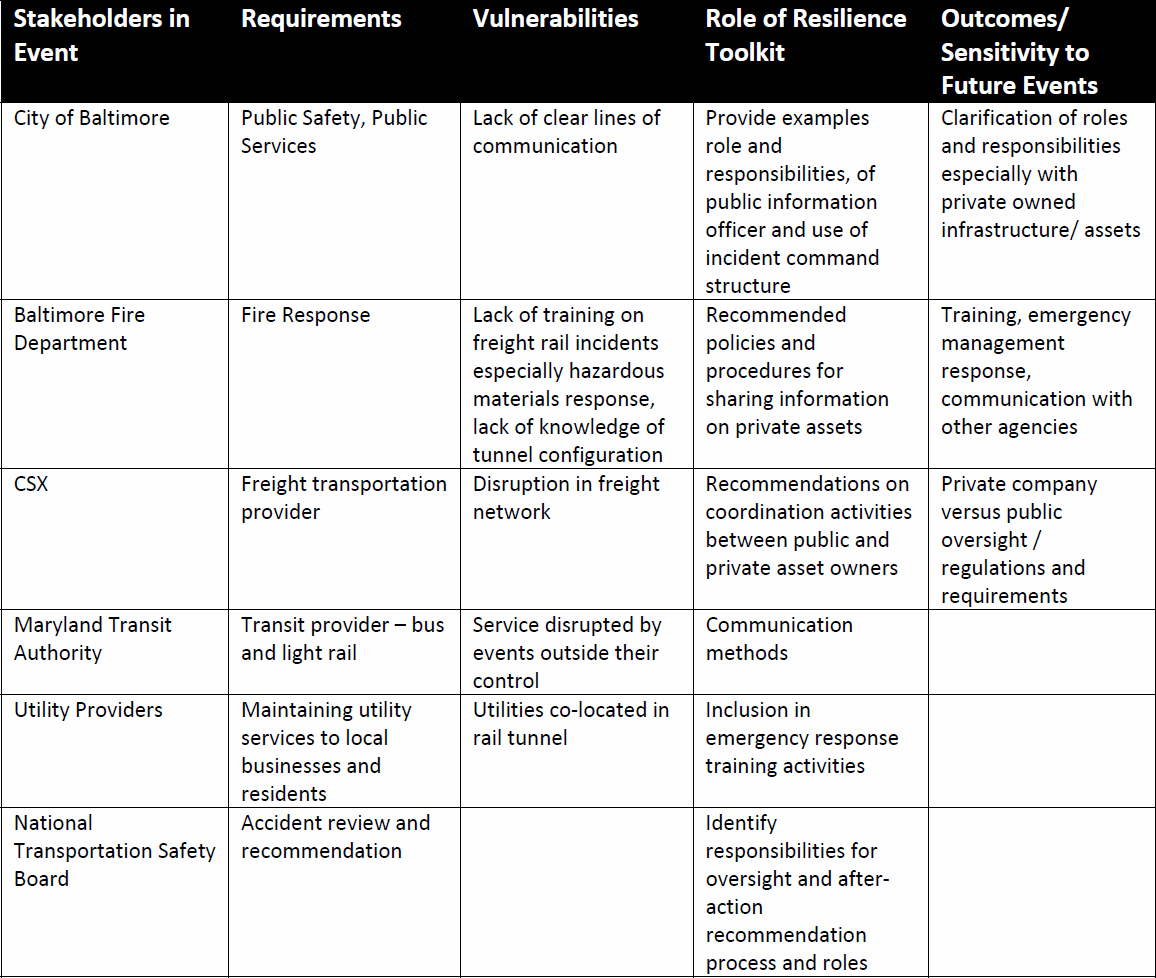
Exhibit 1: Matrix of Stakeholders and their Roles and Vulnerabilities During the Event
Key Takeaways
The delays and wastage of time witnessed during the incident was as a result of limited sharing information and consultations among the various institutions involved in the incident. In addition, there may have been some tactical and human errors made during the incident. For instance, concerns were raised about the private-public information sharing precisely compartmental data among the city, CSX Transportation, the incident command, Emergency Office, the federal government, state, and the media during the initial hours of the incident. Questions surfaced regarding the one-hour delay between the derailment and the initial alarm that alerted firefighters to the disaster. There was also a delay in appointing a public information officer to be at the scene of the incident. The City Fire Department conducted a highly technical response to contain and put out the fire. As time elapsed, it became clear to the city officials that the incident needed extended effort to resolve, but some resources, and time required to resolve the crisis was undetermined. This was a multi-day response
effort that involved over 150 firefighters from both the city and county. Recovery took multiple weeks and months to return the transportation network to pre-event conditions.
This incident shows the importance of disaster preparedness and the benefit of conducting field exercises. Before the incident, the Baltimore City Official had conducted drills on the city’s tunnels. Nevertheless, the drills were only to prepare them for a case of a passenger train accident, but not in a situation involving a hazardous materials spill and fire. This previous drill provided fire department personnel with knowledge of the tunnel and the surrounding area which proved helpful in the response efforts.
This train derailment put emphasizes on the benefit of constantly revising laws and regulations related to hazardous materials being transported through the city and how an event such as this can cause harmful, corrosive, and combustible lubricants and acids to leak into the sewer system causing delayed effects to the nearby infrastructure.
This case study shows the significance of sharing information and strategy consultation among the various institutions involved in combating a specific disaster, and it offers some approaches on how to mitigate risks as well as provide a more coordinated and effective response. It also showed that emergency training although not the exact scenario was helpful in reducing losses.
Need for information sharing, critical infrastructure security and resilience of transportation networks.
Specifically:
- Current “As builts” and maintenance records need to be available to the first responders during an event to enable a quick and safe response.
- Information about train manifest identifying hazardous materials.
- Emergency Drills that practice the Emergency Response Plan and potential incident scenarios involving the transportation system with a formalize after-action report on gaps in both the drill as well as the Plan with an action plan to address these gaps.
- Communication equipment that allows all responders and asset owners to communicate efficiently over one channel to ensure a timely and effective response.
3B.3: Puerto Rico After Hurricanes Irma and Maria
Summary
In 2017, hurricanes, Harvey, Irma, and Maria, struck the United States. The widespread devastation brought by the 2017 Atlantic Hurricane Season affected 28 million people, destroyed infrastructure, caused lifeline shortages in Puerto Rico, the U.S. Virgin Islands, Florida, and Texas (FEMA, 2018). Throughout the pass of these major hurricanes, damage totaled about $250 billion (FEMA, 2018). The purpose of this case study is to examine the results of incorporating response and recovery approaches in Puerto Rico in the wake of consecutive hurricanes to reduce transportation network disruptions in the future.
Over the course of few months from August to November, the Federal Emergency Management Agency (FEMA) assigned 17,000 people to response operations. The evaluation by FEMA included data
collected through interviews, direct observation, and using state, regional, and national plans. This data was used to develop a hurricane season chronology and analysis for validation purposes of the FEMA’s report.
FEMA defined five areas of resilience focus: 1) scaling a response for concurrent complex incidents, 2) staffing for concurrent complex incidents, 3) sustained whole community logistic operations, 4) responding during long-run infrastructure outages, and 5) mass care to initial housing operations. In the first area, FEMA relocated staff from unaffected regions to National Response Coordination Center (NRCC) to offer support and improve operations. Also, accelerating and providing alternative procedures for the process of receiving Public Assistance Grant Program funds. Finally, FEMA developed plans for estimating demand for temporary shelters and restoring electricity.
In the second area, the required number of staff was estimated, and more employees were hired. In addition, the certification process for workforce was simplified to increase the number of qualified personnel during the crisis. In the third area, FEMA shipped commodities to Puerto Rico and the U.S. Virgin Islands from Caribbean Distribution Center warehouse, but the disrupted supply chains and transportation network caused major challenges in the delivery of critical supplies to these isolated locations. Therefore, FEMA took an active role in planning logistical operations in transporting and distributing commodities. For instance, FEMA established a warehouse in Jacksonville, Florida for receiving donations for the impacted people in Puerto Rico. Furthermore, to overcome the delivery challenges such as blocked roads, FEMA cooperated with federal incident support bases to transport food and clean water.
In the fourth area, the focus was on improving situational awareness and communications through conducting field assessment, air reconnaissance, providing satellite phones, engaging mayors, and crowdsourcing information. FEMA also requested the deployment of the U.S. Army Corps of Engineers for generators installation to prepare for prolonged power outages. Finally, in the fifth area, FEMA offered housing assistance for survivors such as providing congregate sheltering and facilitating the transition from shelters to houses. FEMA modified the housing inspection procedures to decrease the number of required inspections resulting in saving money and time.
While federal agencies made efforts to mitigate risk within available resource levels and streamline disaster recovery assistance, several challenges were faced that are addressed in the following sections. At the end, recommendations are provided for enhancing the resilience in supply chains.
Keywords: FEMA, response, recovery, risk management, supply chain delays
Description of Context of Disruptive Event
The size and complexity of the transportation networks involved
- 16,700 miles of transportation network including roads and bridges
- Seaports
- Airports
- Power network
The composition and breadth of affected supply chains
- 20 percent of Puerto Rico’s bridges were damaged
- 29 bridges collapsed completely
- 40 approach slabs were damaged
- Hurricanes Irma and Maria caused more than $575 million in damage to federally eligible roads and bridges
- Failure of the Island’s power grid
- Disruption in manufacturing
- Disruption in medical supply chains
- Disruptions to sea and air travel
- Destruction of the communications network
The diversity and vulnerability of the associated businesses and populations
- 2,756 people were relocated to shelters on preparation for Hurricane Maria’s landfall
- 1,569,769 customers were without electricity after Hurricane Maria
- People affected by unemployment, unpaid missed days of work, and lost income from small businesses
- Thousands of businesses closed or had limited operations such as the pharma manufacturing industry
The spatial, industry and other characteristics of the community and its economy before the disruptive event occurred
- Total value of construction in infrastructure has dropped 40% since year 2000
- Bridges were structurally deficient
- Electric grid was in poor condition and experienced frequent outages
The highway system experienced degradation due to adverse weather conditions and lack of maintenance
Description of Event Itself and its Key Occurrences
Before the formation of Hurricane Irma, the most powerful storm ever recorded in the Atlantic Ocean, the meteorologists detected an atmospheric disturbance flowing off the West African coast in Atlantic Ocean moving toward the Caribbean. On September 6, the eye of Hurricane Irma hit Puerto Rico and killed three people as a Category 5 storm. The storm remained at the intensity of Category 5 for three days. On September 17, the National Weather Service forecasted another hurricane approaching Puerto Rico. Hurricane Maria made landfall in Puerto Rico on September 20. President Trump issued a state of emergency for Puerto Rico on September 21.
Over the course of three weeks, these storms destroyed critical infrastructure and disrupted supply chains, cut power to more than one million residents, and killed thousands of people. Exhibit 2 illustrates the timeline of Hurricanes Irma and Maria.
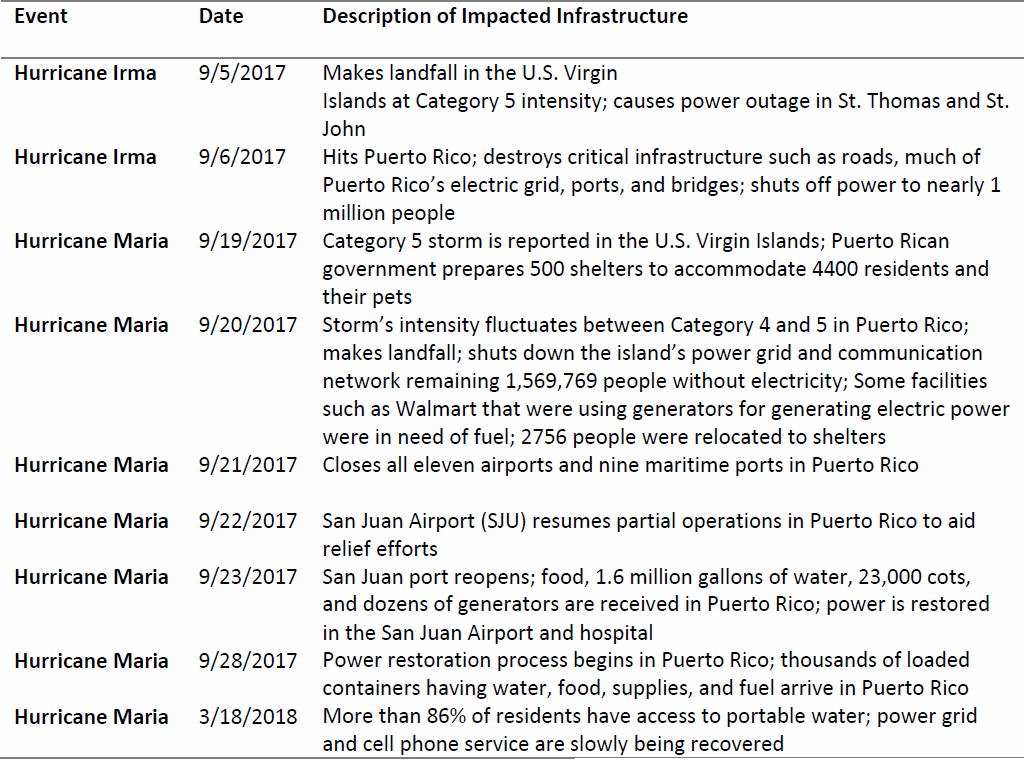
Exhibit 2: Timelines of Hurricanes Irma and Maria (Credit: Adapted from “Supply Chain Resilience and the 2017 Hurricane Season,” by Palin, P. J., Hanson, L. S., Barton, D., and Forehewing, A., 2018, CNA Analysis & Solutions, October, 14-46.)
Primary impact of Hurricanes Irma and Maria
Puerto Rico’s critical infrastructure was severely damaged by Hurricanes Irma and Maria. The island’s power grid was destroyed by the hurricanes leaving 3.7 million inhabitants without power for days. All airports and seaports in Puerto Rico remained closed following the passage of the hurricanes. Roads and bridges were obstructed by approximately 6.2 million cubic yards debris due to Hurricane Maria.
Secondary impact of Hurricanes Irma and Maria
All 68 hospitals in Puerto Rico suffered damage and lost power for considerable time. This took a heavy and unprecedented toll on the healthcare system. Also, transportation barriers that limited people’s access to healthcare facilities, lack of clean water and medical supplies, and the presence of debris led to outbreak of infectious diseases and ultimately a health crisis in the island. Furthermore, as the power grid and communication towers were disrupted by the two hurricanes, the relief and emergency response were delayed.
Tertiary impact of Hurricanes Irma and Maria
The transportation network was affected by massive flooding after the hurricanes rolled through. The flooding caused excessive erosion on the state roads and collapsed bridges. Moreover, the loss of power and communication network disrupted air transportation. The maritime transport and supply chains were affected by accumulated debris in seaports that were calling for dredging.
Description of Lessons Learned
Poor bridge and roadway network conditions in Puerto Rico was the result of allowing heavier trucks on the roads compared to the U.S. mainland. Overweight trucks are a major cause of highway deterioration. In addition, lack of quality assurance standards, maintenance, and proper supervision in building much of island’s roads and bridges led to construction of non-standard bridges and highways. Moreover, Puerto Rico’s bridges are older (average age of 45 years) than other bridges in the U.S. mainland (average age of 43 years) making them more vulnerable to collapse.
Fragile coastal structures and ports infrastructure require incorporating maintenance programs, resilience plans, and investment to accommodate Puerto Rico’s maritime transportation which highly dependent on imports receiving at the ports.
FEMA’s disaster staffing shortages and loss of communication network hindered their response to Hurricanes Irma and Maria. Destroyed communication towers in Puerto Rico after the passage of hurricanes resulted in having limited situational awareness and identifying generator requirements and shortage in the island. Furthermore, FEMA faced challenges in their housing operations for transitioning the survivors from shelters due to difficult housing inspection procedures.
Key Takeaways
Even though the island of Puerto Rico is prone to disasters, local authorities did not have appropriate disaster preparedness and response plans in place. The state of the infrastructure in the island increased vulnerabilities, and exacerbated the impacts produced by the Hurricanes Irma and Maria. In terms of lack of resilience, some key takeaways can be elicited:
- Infrastructure maintenance is key to not only directly impacted pieces of infrastructure but also dependent critical infrastructure. This was evident in the case of healthcare operations. Power restoration in Puerto Rico was important for citizens and, potentially even more important, for the operations of healthcare facilities. Along the same lines, increasing capacity of seaports for accommodating larger cruise ships would increase the island’s resilience.
- Awareness of supply chains at local, state, and national levels to support faster response. An example of this was the impacts on the manufacturing industry produced. The shutdown of manufacturing facilities produced a saline bag shortage in the mainland United States.
- Provide real-time data for reducing congestion in roads and highways and evaluate the design conditions of the routes in order to reduce road degradation.
3B.4: Puerto Rico After Hurricanes – Equity
Summary
The widespread devastation brought by the 2017 Atlantic Hurricane Season affected 28 million people, destroyed the infrastructure, caused lifelines shortages in Puerto Rico, the U.S. Virgin Islands, Florida, and Texas (Zach, 2018). This case study builds on the findings of case study “3B.3: Puerto Rico After Hurricanes Irma and Maria” and expands the analysis with a focus on the equity of the response.
Questions have been raised about inequities in recovery from the disaster comparing Puerto Rico with other affected areas and states such as Texas and Florida. The purpose of this case study is to explore the underlying reasons behind inequities in slow recovery of Puerto Rico. Co-occurrence of three of the most destructive tropical cyclones in the history, absence of urgent international response, political and administrative challenges in Puerto Rico, and unequal follow-up of the federal government were found among the most important reasons why Puerto Rico’s recovery has been much slower than other affected areas.
Keywords: response, supply chain delays, FEMA,
Equity and Social Vulnerabilities
The concept of equity appears in the early 1970s as a response to the criticism over the classical utilitarian principle that pursued “the greatest good for the greatest number of people.” Such authors as Rawls (1971) and Nozick (1974) advocated for the necessity of using justice and fairness in the distribution of resources among individuals, or group of individuals. Equity is concerned with the impacts of such allocation of resources, both positive and negative. Since then, the question of whether decisions made represent an “equitable” distribution arises in fields with economic, development and social consequences. Further developments characterize equity in two dimensions: “horizontal” and “vertical” depending on the comparative abilities and needs of the groups in comparison. Horizontal equity (also known as fairness and egalitarianism) is concerned with the distribution of resources between individuals of similar ability and need. Vertical equity (also refer to as social justice and social inclusion) is concerned with the distribution of resources between individuals that exhibit different levels of ability and need.
Equity considerations are relevant in planning and implementing transportation projects, and –in particular— in the cycle of emergency management when seeking to increase resilience. Emergency response functions such as transportation of critical supplies and evacuation use the transportation network and directly affect the distribution of resources. Recovering functionality of the transportation network will have an impact on the affected communities in case of disruptions. The distribution of critical supplies and other resources, from an equity perspective, should be based on fulfilling the requirements of the survivors (Mostajabdaveh et al., 2019).
As important as identifying community needs in the aftermath of a disruption is to understand the baseline social vulnerabilities prior to the event. Social vulnerabilities consist of a wide range of socio-econometric, demographic, and environmental conditions that contribute to equity. These include but are not limited to race, education, income, occupation, age, disability, and language proficiency (Domingue & Emrich, 2019). Social vulnerabilities vary across different regions (Emrich et al., 2020) and, as some authors suggest, may have compounded effects. For instance, a region might be vulnerable because of race; another region might be vulnerable because of poverty and mobile house, while another region may contain population with all of the mentioned vulnerabilities.
In the United States, the Federal Emergency Management Agency (FEMA) distributes funding to the survivors in short-term and long-term after the disaster considering social vulnerabilities and physical damage of the affected population and region. For instance, Individual Assistance (IA) housing grants is a short-term funding distributed to uninsured and under-insured disaster survivors (Emrich et al., 2020). Grube et al. (2018) and Rufat et al. (2019) argued that social vulnerabilities are indicators of the number of applicants for IA, physical damage, and the fund amount. Another short-term funding is the Small Business Administration (SBA) for which applicant should have verification of disaster losses, satisfactory credit, and ability to repay loans (Lindsay & Webster, 2019). Emrich et al. (2020) used Pearson correlation to identify social vulnerability indicators. Then, they constructed multivariate regression models to evaluate social equity in resource allocation in the aftermath of floods. One of the conclusions of this study is neighborhoods with higher Black population received less SBA funding when compared with other locations. (Domingue & Emrich, 2019) evaluated administrative procedure of distributing funds by FEMA. The authors developed structural equity at the county level. Using a multinomial logistic regression, they identified the relationship between FEMA fund distribution and social vulnerability indicators. The result of their analysis reveals that FEMA was successful with spending higher funding in high-damaged counties. However, more attention is required in the recovery phase of the counties with high social vulnerability in order to obtain equitable disaster response and recovery. Results of these studies indicate that to provide an equitable response, relief agencies need to focus on both physical damage and social vulnerabilities of the survivors.
Description of Context of Disruptive Event
Co-occurrence of Three of the Most Destructive Tropical Cyclones in the History
According to the National Hurricane Center (NHC) that keeps a list of the costliest tropical cyclones to strike the United States since 1900, the three hurricanes of 2017 – Harvey, Irma and Maria are in the top five costliest cyclones in the History of the United States. The unexpected co-occurrence of these unprecedented natural disasters explains, in part, the inadequate preparation for humanitarian response.
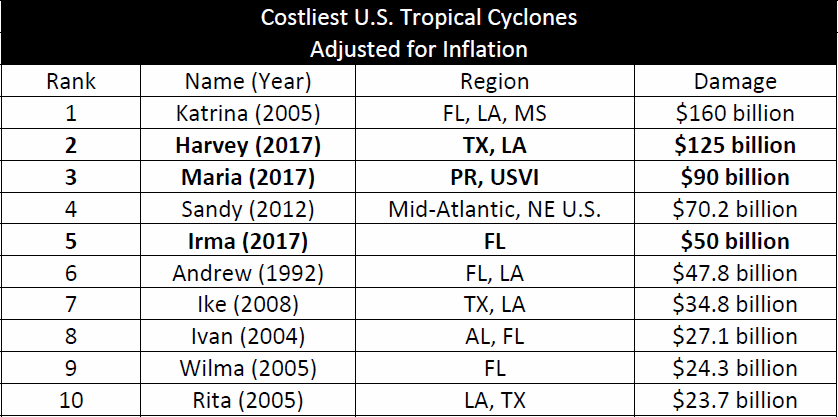
Exhibit 3: Costliest U.S. Tropical Cyclones
According to Zorrilla (2017) in an article published by the New England Journal of Medicine, Puerto Rico’s infrastructure, including the health care infrastructure, had already been in crisis from Hurricane Irma 2 weeks earlier and consequently caused a partial collapse of the power system following Hurricane Maria. Zorrilla (2017) emphasizes that although everyone in Puerto Rico was impacted by the disaster to some degree, “the poor and vulnerable were disproportionately affected.” Naturally in such critical times, underserved people are more vulnerable to damage and destruction.
Description of Event Itself and its Key Occurrences
Overview of the Federal Response to Hurricane Maria in Puerto Rico
According to the Department of Homeland Security, on September 17, a few days prior to landfall in Puerto Rico, the U.S. Geological Survey prepared their water-level measuring instruments in Puerto Rico to enhance the flood forecast and assessment. The next day, President Trump declared state of emergency for Puerto Rico and the U.S. Verigin Islands. This opened channels for federal assistance to reach affected regions. On September 19, FEMA’s Urban Search and Rescue teams arrived at Puerto Rico. Also, a Disaster Medical Assistance team supported by the Department of Health and Human Services (DHHS) was assigned to Puerto Rico. On September 20 when the hurricane made landfall in Puerto Rico, major disaster declarations were issued by President Trum. Moreover, the National Disaster Medical System Definitive Care Reimbursement Program was activated by DHHS covering healthcare costs of patients forced evacuation from hospitals due to the hurricane. On September 21 one day after landfall, more than 3,500 federal staff were deploying relief operations in Puerto Rico. More than 274,000 meals, 25 generators, and cots were provided by FEMA’s Puerto Rico Distribution Center. Furthermore, 700 National Guard personnel are sent to Puerto Rico. More than 7,000 federal staff were responding to the emergency along with federal ships, aircrafts, and helicopters over the island performing rescue operations. Military ships transported more than one million meals and liters of water and thousands of gallons of fuel to the island.
Over the next few days, 100 patients were transferred to U.S. main land for receiving medical services, 32 points of commodity distribution centers were established, 14 DoD flights carried food and water supplies, several generators were installed in major facilities, the Federal Highway Administration provided $40 million fund for Puerto Rico’s highways maintenance, and more than 10,000 federal staff were deployed for performing recovery operations in Puerto Rico (Overview of Federal Efforts to Prepare for and Respond to Hurricane Maria | Homeland Security, 2017). Since 2017, FEMA has provided $6 billion program funding for 1558 projects in Puerto Rico in which $5.1 billion were assigned to emergency work projects (PUERTO RICO DISASTER RECOVERY FEMA Actions Needed to Strengthen Project Cost Estimation and Awareness of Program Guidance Report to Congressional Requesters United States Government Accountability Office, 2020). Considering the population of Puerto Rico in 2017 (3.325 million), the federal investment per capita would be $1804.5 approximately.
Impacts on Infrastructure and Death Toll
Hurricane Maria collapsed critical infrastructure in Puerto Rico. Part of the island’s critical infrastructure consists of 16,700 miles of roads and bridges, eleven airports, nine maritime ports, and the entire power network were affected by the hurricane. Up to 20 percent pf Puerto Rico’s bridges were severely damaged in which 29 bridges collapsed completely (American Society of Civil Engineers Puerto Rico Section, 2019). Also, all airports and seaports in Puerto Rico remained closed for days until San Juan Airport was partially opened with disaster relief operations (Palin et al., 2018). In addition to immediate damage to roads and transportation network, the entire power grid system of the island was left in ruin. As a result, hospitals and other major facilities were running on generators as power sources failed and more than one million people were without electricity for days or longer (Palin et al., 2018).
Puerto Rico’s death toll from Hurricane Maria remained uncertain for months and even years. According to Amnesty International, one year after Hurricane Maria hit Puerto Rico, the local officials raised the death counts from its initial estimate of 64 (Puerto Rico a year after Hurricane Maria | Amnesty International, n.d.). The independent studies and research conducted at The George Washington University lifted the veil on unpublished 2,975 excess mortality counts (The George Washington University, 2018). Also, a New York Times analysis shows a higher number of deaths estimating as many as 4,600 people after Hurricane Maria (Fink, 2018). Some deaths were directly related to the hurricanes while others were indirectly resulted from lack of accessibility to proper healthcare services. Underreporting the death toll of Maria raised concerns about the accuracy and clarity of data and statistics which is critical in ensuring the appropriate emergency response in the wake of disaster.
Barriers and Difficulties to International Response
In times of unpresented crisis, a quick response from international community is of high importance to avoid more damage and cost. Although U.S. has been present in helping many nations facing disaster throughout years, the international community was limited to Puerto Rico facing destructive force in a short period of time in 2017. Lack of transparency by the government of Puerto Rico and the lack of confidence in the numbers provided (Reverón-Collazo, 2018) might have caused misunderstanding of the magnitude of the disaster by members of international community. For example, according to a study supported by Harvard and published in the New England Journal of Medicine, “the number of
excess deaths related to Hurricane Maria in Puerto Rico is more than 70 times the official estimate” (Kishore et al., 2018). Such examples amplified the unreliability in data and statistics leading to inequities in international humanitarian response to Puerto Rico.
While so much of literature has investigated domestic factors in humanitarian response to Puerto Rico after Hurricane Maria, little attention has been paid to the underlying reasons of the absence of the international response and aid. Despite the call by the UN to emergency response to Puerto Rico in 2017 (OHCHR | Puerto Rico: Human rights concerns mount in absence of adequate emergency response, n.d.) the response proved to be inadequate.
Reverón-Collazo (n.d.) identifies two underlying factors regarding absence of international response to the disaster: political reasons and bureaucratic hurdles. Regarding political reasons, Reverón-Collazo exemplifies the offer made by the Cuban government to provide medical personnel with tent hospitals and electric which remained unanswered by the U.S. Government. Another example is the U.S. refusal to accept donation of 50,000 gallons of diesel from CITGO coming from Venezuela. Bureaucratic hurdles played a role as well. For example, the FDA did not allow food from Mexico enter Puerto Rico because it was not FDA approved (Reverón-Collazo, n.d.)
Reverón-Collazo urged the United States and the current government of Puerto Rico to call upon the international community to support rebuilding efforts in Puerto Rico. He further states:
“The duties identified by the United Nations International Law Commission on protection of persons in the event of natural disasters include a duty to cooperation and to seek external assistance… Because of Puerto Rico’s colonial status, we have been systematically excluded from important discussions that would have provided vital information for a sustainable development planning to eradicate poverty and inequality. We have not participated in any of the major UN conferences and summits which have laid a solid foundation for sustainable development and have helped to shape the new Agenda.” (Reverend-Collazo, n.d., pp. 3-5)
According to Charity Navigator, which is a non-profit charity assessment organization, the following is a list of confirmed highly rated organizations that have provided aid and relief to individuals and families affected in Puerto Rico (Ongoing Recovery in Puerto Rico: Charity Navigator, n.d.).
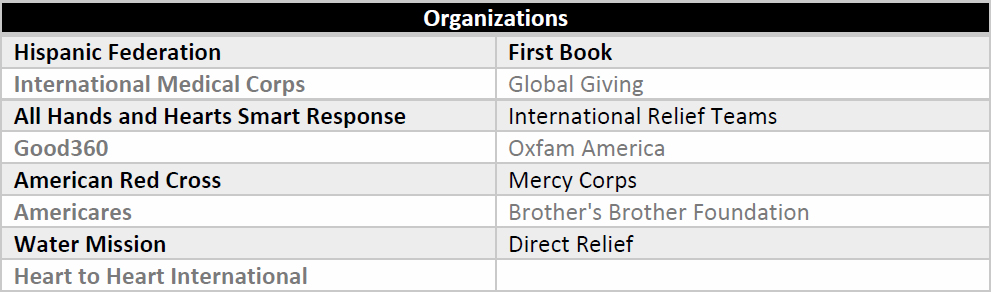
Exhibit 4: Organizations that Have Provided Aid and Relief to Puerto Rico
There is no trace of aid form many wealthy nations such as European countries in literature. When comparing this to the recent catastrophe in Lebanon which received immediate response from more than 35 countries around the world (Lakhani, 2020) or the instant reaction from 20 countries to Indonesia after the earthquake and tsunami in 2018 (Ungku & Kapoor, 2018), or the aid by the European Union and several other countries after the 2018 Kerala floods in India (EU announces Euro 1.9 lakh to Indian Red Cross Society for Kerala flood relief | India News, The Indian Express, 2018). There are several other examples as well where international response and aid to Hurricane Maria in Puerto Rico can be observed in comparison with even less catastrophic similar disasters in other countries.
Contrasting Responses: IRMA, HARVEY, AND MARIA
In addition to Hurricane Maria, in August and September 2017, two other devastating hurricanes, Harvey and Irma, struck the United States. Harvey was a Category 4 hurricane that formed on August 17, lasted for a week, and made landfall on Texas and Louisiana (NOAA & NHC, 2018). Harvey caused widespread flooding in Houston, Texas, which resulted in approximately 336,000 residents without electricity. Moreover, the flood water contained hazards to the environment and human health (NOAA & NHC, 2018). Irma was a Category 5 hurricane that formed on August 30, mainly impacting northern Caribbean Islands and Key West in Florida. Irma caused electrical damage and approximately 2.5 billion dollars of agricultural damage in Florida (Representatives-Florida, 2018; Willison et al., 2019).
Before analyzing the response to each of the hurricanes, we compare the severity of each of them. Table 1 shows the category, estimated damage and mortality of each hurricane. Mortality is broken down as direct and indirect deaths. According to National Oceanographic and Atmospheric Administration (NOAA):
“Direct deaths occur as a direct result of the forces of the tropical cyclone. These would include individuals who drowned in storm surge, rough seas, rip currents and freshwater floods. Indirect deaths are defined as, deaths occurring from such factors as heart attacks, house fires, electrocutions from downed power lines, vehicle accidents on wet roads, etc. (Kaplan, 2017).”
The numbers in the table, however, is an estimated of indirect mortalities beyond what NOAA considers –more details later in this case study.
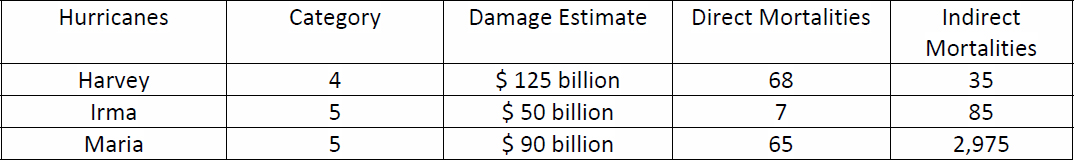
Exhibit 5: Severity, Damage and Mortality of Hurricanes Harvey, Irma, and Maria (Credit: Willison et al. 2019; NOAA & NHC, 2018)
Exhibit 5 indicates that the three hurricanes have similarities in terms of the category, estimated damage, and direct mortalities. Although Irma falls behind in direct mortalities, it surpasses Harvey in the count of indirect deaths. The indirect deaths caused by Hurricane Maria are overwhelmingly larger than the other two hurricanes combined: 24 times larger to be precise. Low socioeconomic
development and insufficient financial resources devoted to Puerto Rico in the response and recovery stages are some of the reasons of the long-term health issues and high number of deaths.
Once established the similarities in impact of the three hurricanes, it is relevant to study the allocation of funding and staff to disaster response operations. Exhibit 6 compares the response by federal government after 9 days for each hurricane. The table suggests that the federal government spent more resources and responded more quickly to Hurricanes Irma and Harvey compared to Hurricane Maria.
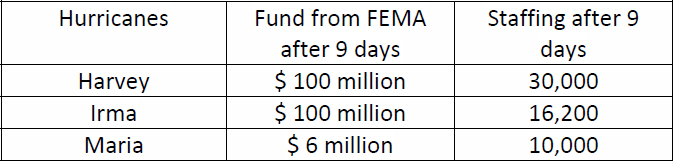
Exhibit 6: Funding and Staffing in Response to Hurricanes Harvey, Irma, and Maria
Transportation Network Resilience and Equity
Traditionally, transportation planning evaluated the mobility of the service using indicators such as traffic speed. (Litman, 2003) proposed the incorporation of accessibility in the transportation planning which refers to people’s ability to obtain the desired service. The factors contribute to the definition of accessibility are mobility, transportation network connectivity and affordability, and the geographic distribution of activities. While strategies to improve mobility include expanding roadway and parking facility, strategies to improve accessibility are improving various modes and managing transport demand. Accessibility in transportation leads to the definition of transportation equity. Later on, Litman (2005) discussed vertical equity with regards to mobility need and ability. This type of equity evaluates the degree to which a transportation system meets the needs of travelers with special mobility needs. In other words, transportation facilities and services should accommodate all users including those with disabilities and special needs. “Equity evaluation in transportation requires that people be categorized by demographic and geographic factors to evaluate their capabilities and identify those who are transport disadvantaged” (Litman, 2005).
The evaluation of transportation equity in response to Hurricane Maria needs to consider the transportation challenges in Puerto Rico (Geronimo, 2019). Since Puerto Rico is an island, logistical activities are complicated. For instance, supplies from outside of the disaster area cannot be transported by truck. Instead, boats or airplanes are required. Puerto Rico had severe transportation infrastructure deficiencies before Hurricane Maria. In fact, it was ranked as having one of the worst transportations infrastructures in the nation (Geronimo, 2019).
“Among states and territories, the island is ranked 51st in the road roughness index which is an indicator of road network conditions” (Chico, 2016; Geronimo, 2019).
Deficiencies in public transportation made Puerto Ricans dependent on car ownership (Geronimo, 2019). By the strike of the Hurricane Maria, thousands of people lost their cars due to flooding which reduces their mobility and the accessibility to the transportation system.
After Hurricane Maria, Luis Munoz Marin international airport was shut down for several days. Moreover, the storm affected the power system, radar system, communications infrastructure, and fuel systems (Lazo, 2017). These occurrences made relief logistics activities more complex. Although ports reopened in a short time after the hurricane, disruption in the supply chain (e.g., damages stores, lack of fuel) caused disruption in deliveries (Hernández & Mufson September 2017). Serious damage in roadways and bridges (with the estimate of $652 according to (PRHTA, 2018)) was another main reason of distribution disruption. As a result of transportation disruption, survivors used natural sources of waters including the nearby springs. Unfortunately, contaminated water killed 26 people (Sutter, 2018). This example shows how the weak transportation infrastructure, geographical location of Puerto Rico, and inequity in response from federal government resulted in indirect mortalities after the disaster.
Toward transportation resilience in Puerto Rico
Some authors such as Weilant et al. (2019) have discussed that absorptive capacity, restorative capacity, equitable access, and adaptive capacity are the requirements to develop a resilient transportation system. These factors help explore alternative options and strategies to incorporate resilience into long-term transportation planning. A disruption in the transportation network not only decreases economic productivity, but also affect peoples’ wellbeing, mobility, and accessibility.
Not surprisingly, after Hurricane Maria, the primary concern of Puerto Ricans has become repairing the roads and highways. The result of the survey conducted by Washington Post-Kaiser Family Foundation indicates 93 of the Puerto Ricans prioritize repairing transportation infrastructure to helping people find job, repairing damaged home and school, and repairing electrical grid (Hernández & Mufson September 2017). According to the Puerto Rico government, $19.9 billion will be all be allocated to disaster recovery (Geronimo, 2019). This government specifies the assignment of $138.8 million annually from the Federal Highway Administration and $20 million from federal transit administration (PRHTA, 2018). There are several plans related to improving Puerto Rico’s transportation infrastructure. Weilant et al. (2019) focused on five plans and discussed whether they considered equity. Most of the plans considered equity through indices such as age, race, income, English proficiency, education, auto ownership, poverty, and gender. Weilant et al. (2019) further discusses within the short time horizon there is the risk of rebuilding the vulnerable transportation infrastructure that is not functional in the long-term. In other words, rebuilding the infrastructure in the short term, does not guarantee the transportation resilience of Puerto Rico in long-term.
Key Takeaways
Unequitable federal government spending in disaster response
The fact that Hurricanes Irma and Harvey preceded Hurricane Maria can explain part of the drastic differences between the federal response to these emergencies. However, a deeper analysis is required. This case study illustrates that disaster impacts are one of many factors that should be considered if an equitable distribution of resources is desired. Social vulnerabilities, state of the critical infrastructure, and damage should be considered to estimate the needs and produce an equitable response. The federal government needs to differentiate its response and treatment of states and territories based on identifying inequities, available resources, and severity of the situation. Comparing the response to Hurricane Maria and other concurrent hurricanes indicates social vulnerabilities of
survivors in Puerto Rico was not fully considered. Puerto Rico health infrastructure was in crisis even before Hurricane Maria. Inequitable response to Puerto Rico resulted in long-term health problems. The use of statistical methods and prediction models to associate social vulnerabilities and equity in response to disaster is one of the alternatives to produce more equitable disaster response.
3B.5: SUPERSTORM SANDY AND RESPONSE BY PORT AUTHORITY OF NEW YORK AND NEW JERSEY (Covering October to November 2012 and since)
Summary
Superstorm Sandy, a hurricane over much of the Caribbean, was a unique weather event. It struck the coast of the northeast U.S. in October and November 2012. Sandy was one of the most destructive storms to strike the New York metropolitan area in the past 100 years.
Sandy had a major effect on the massive Port Authority of New York and New Jersey (PANYNJ). In the short run, Sandy required the closure of many PANYNJ facilities. It badly damaged the Holland Tunnel and the Port Authority Trans Hudson (PATH) rail system. PANYNJ undertook a program of over $500 million to repair the damage and improve facilities. Construction will continue well into the 2020s. Both the real-time damage from Sandy in 2012 and the schedule for capital repairs are summarized in tables in below.
PANYNJ established a sustainability policy in 2008 and 2009, well before the damage from Sandy. However, Sandy has been a major influence on the development and implementation of that policy. Notable developments include:
- Climate Resilience Design Guidelines (Port Authority,2018)
- Council on Port Performance – An industry group, convened by PANYNJ, to address a variety of operational and resilience issues (Port Authority,2020a)
- A dedicated Resilience & Sustainability Unit
- Use of Benefit-Cost Analysis (BCA)
In principle, other agencies and major facilities could adopt resilience programs and policies similar to those of PANYNJ. However, the practical barriers to doing so are considerable, and different institutions may take widely differing approaches.
Keywords: Performance-based metric, Climate change, Waterway, Supply chain resilience, Sea-level rise
Resilience Approach Taken
Summary of Events
Hurricane Sandy started by creating great destruction in the Caribbean in late October 2012. It was responsible for numerous deaths in Jamaica, Haiti, Dominican Republic, Cuba and Puerto Rico. Additionally, its effects on the U.S. mainland and the New York metropolitan area were unusual, and of historical scope. After moving through the Bahamas, Sandy proceeded northward and slightly east within the Atlantic Ocean. It did not directly strike any of the states of the Southeast U.S.
Sandy first made U.S. landfall near Atlantic City, New Jersey. Although it was not officially classified a hurricane at that time, its hurricane-force winds and massive size made it the most destructive hurricane/storm to strike the U.S. during 2012. Besides enormous destruction in New Jersey and the New York metropolitan area, Sandy was destructive to New England, Canada and parts of the Midwest.
The Port Authority of New York and New Jersey (PANYNJ) is one of the nation’s major transportation agencies. Besides several seaport facilities, PANYNJ operates five airports, the Lincoln and Holland tunnels, the George Washington Bridge and three other bridges connecting New York and New Jersey. It also operates the PATH (Port Authority Trans-Hudson) underground transit system connecting New Jersey to New York City, and three major bus depots.
Most of the serious damage from Superstorm Sandy to PANYNJ facilities occurred to the Holland Tunnel and the PATH system, including two rail tunnels under the Hudson River. The flooding of underground PATH stations and tunnels had been rare and has not occurred since. Kennedy Airport in Queens, NY sits near the Atlantic coast. It suffered substantial, but not permanent, damage when salt water flooded the airport grounds. A basic timeline for the short-term damage Sandy made to PANYNJ operations and facilities is shown immediately below:
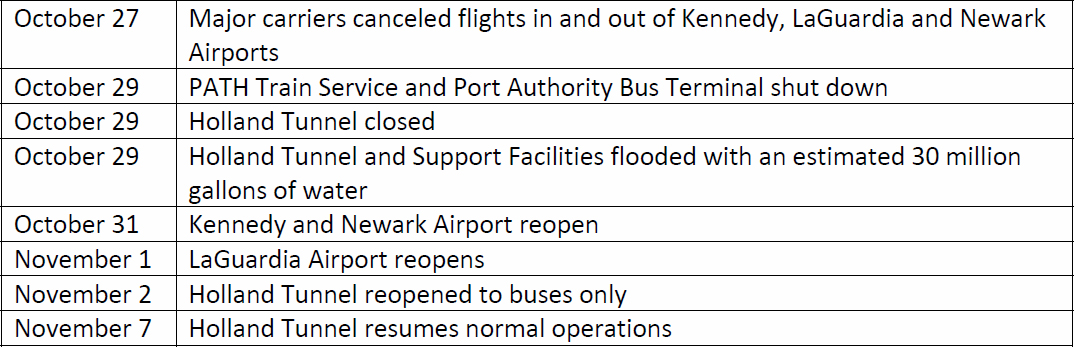
Exhibit 7: Real-Time Reports of Damage and Disruption to PANYNJ Facilities
Response of PANYNJ
In the wake of Superstorm Sandy, PANYNJ adopted Climate Resilience Design Guidelines), which were updated in 2018 (Port Authority, 2018. They are scheduled to be updated again in 2021. CRDG recognize the serious danger of sea-level rise. New York-specific projections of sea-level rise run as high as 49 inches by the year 2100. The new guidelines are expected to consider hazards from heat and extreme precipitation, in addition to revising the approach to sea-level rise and flooding.
Under the guidelines, resilient designs are required to elevate, relocate, protect or accommodate critical assets that may be flooded in future climate emergencies. Examples of critical assets include electrical equipment, the electric grid and cargo. In some cases, saltwater flooding may do greater damage than freshwater flooding. Storm surge can be a major cause of flooding.
The design guidelines also allow for future use of Benefit-Cost Analysis (BCA) to improve cost effectiveness of flood mitigation designs. PANYNJ already employs BCA as an analytic tool for selected major projects. As long as the risk of catastrophic flooding or other climate-related damage can be
quantified and monetized, BCA can be a valuable tool for incorporating resilience considerations into capital programs.
The Council on Port Performance (CPP) was established in 2014. It is an industry group convened by PANYNJ to deal with a variety of issues, including operational problems with cargo transfer and technology implementation (Port Authority,2020a). Although CPP primarily addresses operational issues, it also works on climactic, economic and pandemic-related resilience. The work of this council has underlined the need to maintain resilience throughout the supply chain. If any link in the chain is not fully functional, this will likely result in delays, back-ups and other problems at major seaports.
The Resilience & Sustainability unit is located within PANYNJ’s Engineering Department; it is headed by a Chief for Resilience and Sustainability. This unit helps all facilities and functions to implement the resilience program; key areas include construction, real estate and insurance.
As shown below, PANYNJ is still working on capital improvements in response to Sandy. Not included in the timeline, but authorized by the PANYNJ Board, is a project to install tide gates at Kennedy airport. The tide gates will prevent flooding of the airport’s lowest locations.
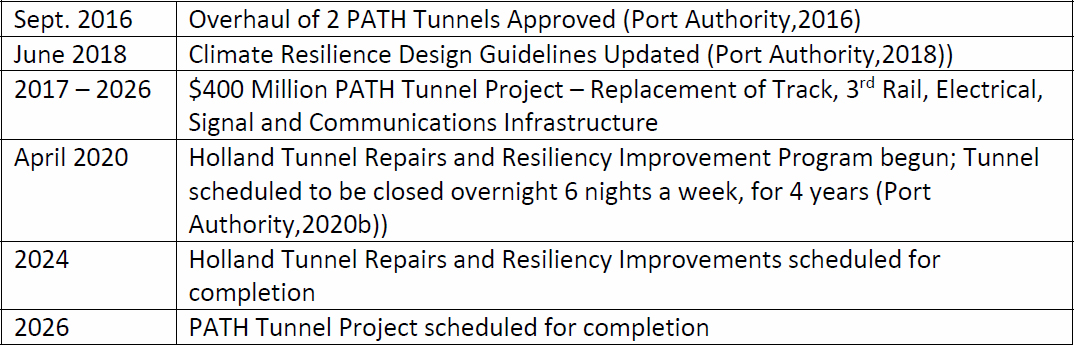
Exhibit 8: Repairs, Resilience Improvements and Policy Documents for PANYNJ Facilities, 2012-2026
Likelihood of Another Superstorm Sandy
The catastrophic and unusual damage wrought by Sandy has raised concerns about another storm with similar or worse consequences. In the years following Sandy, oceanographers have estimated the frequency with which comparable storms may be expected to hit the New York metropolitan area. Very few storms in the 300-year record have been comparable to this storm, and one researcher estimated that Sandy was a 26- year storm, based on current conditions. However, with consensus that climate change will generate warmer sea-surface temperatures, comparable storms may occur once every 100 years or even once every 50 years. Naturally, there is additional jeopardy that a comparable storm may do its greatest damage to the Washington DC, Boston MA or other Northeast metropolitan area.
Critical Assessment
Difficulty of Quantitatively Assessing Program Effectiveness
PANYNJ has taken a number of steps to improve resilience in the years since the Superstorm Sandy disaster. In principle it is important to quantitatively assess the effectiveness of these measures, and current and future
levels of threat from catastrophic storms and other climate-related threats. However, it would be a major policy analysis project in itself to do so.
In theory, insurance premiums could provide some measure of current levels of threat. However, researchers’ ability to employ this metric are limited. First, insurance contracts for PANYNJ and other major transportation agencies are generally not available for public inspection. Second, since premiums for hurricane and related insurance are rising anyway, it is difficult to separate the effects of agency programs from other trends determining premiums.
Remarkable Features of the Program
PANYNJ has a major program to address resilience. It has had significant effects on the seaport, the PATH rail line, the Holland highway tunnel and Kennedy airport. Two of the most remarkable features are the use of sea-level rise (SLR) predictions and benefit-cost analysis (BCA).
The SLR predictions extend to the year 2100. They include mid-range projections, the 25th, 50th and 75th percentiles, as estimated by the New York City Panel on Climate Change (NPCC). The 50th percentile for 2100 is an SLR of 36 inches above the 2015 level, with the 75th percentile about 49 inches. With provisions for freeboard, which requires an additional margin for error, some critical long-term facilities will have a Design Flood Elevation (DFE) of 60 or 72 inches above current sea level. Other projections from NPCC, such as forecasts of average temperatures for the rest of the century, are referred to in the design guidelines Appendix.
Any prediction of sea-level rise going out many decades is highly uncertain. The provision of ranges and percentiles by the NPCC is an attempt to adjust for that uncertainty. But the critical outcome is that PANYNJ is incorporating allowance for substantial SLR in its design guidelines. Spurred on by Superstorm Sandy, PANYNJ is taking unprecedented measures.
Likewise, BCA is a potential game-changing tool in resilience planning. BCA is not systematically required under the current guidelines. But it is provided for, and it is currently used for selected projects. BCA is a resource-intensive analytic tool, and it suffers from well-known limitations. But by balancing expected gains (i.e., avoided losses) from major resilience projects against the financial and other costs of those projects, BCA often provides the most objective answer to the inevitable question “How much is enough?”
Lessons Learned
Superstorm Sandy was an unprecedented weather event which shattered meteorological records. It is understandable that it was difficult to anticipate and prepare for this event. However, the actions of the PANYNJ show that it has learned the main lesson of Sandy, and it is much better prepared should a similar event take place.
The Port Authority’s further development of its Climate Resilience Design Guidelines changes engineering standards to improve climate resilience. More specifically, the use of SLR forecasts and BCA to develop PANYNJ policy are major innovations. As global climate models improve, more sophisticated tools to assess port policy and projects may be developed.
Replicability of the Approach for Other Agencies
The advances of PANYNJ after Sandy are replicable by other agencies in principle. These advances include a large capital program to improve resilience, the use of available estimates of sea-level rise, and development of BCR capacity to assess major projects and policies. However, there are an abundance of practical problems to be addressed before many other agencies can follow in PANYNJ’s footsteps. These problems include lack of funding, potentially massive criticism and bad publicity, no matter which specific forecasts are employed, and the danger of manipulation and misuse of the output of forecasts and analytic tools such as BCR.
In terms of adaptation specifically by other ports, the potential is greatest for large U.S. ports located in states which have made climate change and resilience high priorities. Thus, possibilities include the ports of Los Angeles and Long Beach, which have a tradition of working together closely, Seattle and Tacoma, also cooperating institutions, and Oakland and Philadelphia. Policy makers, analysts and advocates looking for major advances among the ports might concentrate on these and similar ports.
Another route to implementation, for ports or other major transportation agencies, is direct federal or state intervention. Although top leadership in the executive branch is changing, a divided Congress is still a strong possibility. The need for resilience advocates to secure the support of a few Republican senators for climate resilience policies endorsed by the President and House of Representatives may be a major obstacle. State action in coastal or left leaning states, possibly including Florida, may be more likely in the next few years. However, it seems unlikely that any major agency or policy-making entity will simply adopt the PANYNJ approach and design guidelines without modification.
Key Takeaways
- Within PANYNJ, several facilities, including the Holland Tunnel and the PATH rapid transit system, sustained serious damage from Superstorm Sandy
- In the wake of Sandy, PANYNJ has taken several notable steps, including an extensive repair program extending into the 2020s
- To reduce future vulnerability to climate emergencies, PANYNJ has adopted Climate Resiliency Design Guidelines
- The guidelines incorporate projections of sea-level rise around the New York metropolitan area extending to the year 2100
- The guidelines provide for present and future use of BCA to assess the efficiency and economic value of planned resilience projects and policies
- PANYNJ’s program is in principle replicable by any number of seaports and other transportation agencies
- However, there are practical obstacles to implementation of such a program, and there may be great variation among different agencies
3AB.1: COVID-Port of Everett Disruption Response
Summary
The Port of Everett located in Everett, WA (Snohomish County) is the third largest port in Washington State. The Port of Everett serves as an extension of the aerospace manufacturing process and plays a critical role in the just-in-time-delivery schedule. It transports ALL the oversized parts for the 747, 767 (military and commercial), 777, K- C46 Tanker and the 777X airplane programs. It also serves as a backup facility to the 787 Dreamliner.
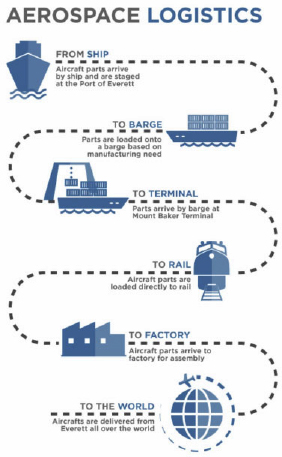
Exhibit 9: Port of Everett’s Aerospace Logistics Supply Chain
In order to safeguard their operational abilities to support the Boeing supply chain and to continues moves aerospace components quickly and securely through the transportation system, the Port must have a business continuity plan in place that can be implement during and post disruption.
Findings
The Port of Everett, as part of the joint Puget Sound Regional Maritime Transportation Disaster Recovery Exercise Program (Exercise Program), prepared and practiced Business Continuity and Resumption of Trade Planning (Continuity of Operations Plan (COOP)) in 2014. This plan has been reviewed and updated as needed each year. Although, the Plan did not specifically address pandemics, the Plan provides a framework for Port leadership to use a reference or guiding document that outlines actions and procedures can be adapted to the event at hand.
Key Lessons
- Having a Business Continuity Plan as a guideline simplifies the initial response.
- Clearly defined roles and responsibilities.
- Policies and Procedures in place that can be implemented quickly.
- Communication Plan both internal and external audiences (FAQ’s).
- Remote access to information/data, computer applications needed to continue day-to-day operations, including appropriate equipment and internet / phone connectivity.
- Knowledge of Revenue sources / priority functions required to return business to pre-event conditions.
- Staff trained on incident command, emergency and recovery procedures and processes.
- Communication networks in place. Continuous networking with stakeholders, local, regional, state and federal officials.
Keywords: Preparedness, Response, Maritime, Pandemic, Planning
Description of the Context of the Disruptive Event
Case Study Focus
- COVID response
- Role of established response plan- Business Continuity and Resumption of Trade Plan
- Business systems
Type, size and duration of the disruption
COVID/Pandemic
Complexity of the network affected:
Multistate Freight Network,
Boeing Airplane Production
Type of agency: - Local government
Overview of the context in which the event occurred.
Key observations:
- The size and complexity of transportation networks involved.
- The Port of Everett is the state’s first largest port by economic output and third largest container port in the state
- The Port District and boundaries formed in 1918, not a countywide port
- Represents nearly 110,000 people in the Port District
- Special Purpose District tasked with ‘economic development’ governed by three commissioners
- $102 million operating & capital budget in 2019
- The composition and breadth of affected supply chains.
- Multiple supply chains are affected, although the primary supply chain is the Boeing Production Line at their Everett, WA plant. This plant builds the 747, 767 (military and commercial), 777, KC46 Tanker and the 777X airplane programs. It also serves as a backup facility to the 787.
- The diversity and vulnerability of the associated businesses and populations.
- Port of Everett activities support more than 35,000 jobs in the region
- 60% or 3 out of 5 jobs in Snohomish County are tied to trade
- The spatial, industry and other characteristics of the community and its economy before the disruptive event occurred.
A Description of the Event Itself and Its Key Occurrences
A Snohomish County man sometimes erroneously referred to as “patient zero,” started feeling sick after he returned Jan. 15 from a visit to Wuhan, China — the pandemic’s birthplace. He was confirmed positive Jan. 20. Public health officials tested and isolated everyone they could identify who came into contact with him and found no other infections.
A second case emerged Feb. 28 and genetic analysis showed it was similar to the first, differing by only two mutations. At this point, researchers in the Seattle area estimated the virus had been spreading silently for six weeks. Later, an international group of scientists concluded that the Snohomish County
man who was the country’s first confirmed COVID-19 patient was probably not the source of the coronavirus outbreak in Washington state.
As researchers learn more about the pandemic’s roots, it is now thought that the virus entered the United States via multiple paths and at multiple times. But Washington still seems to be the place where it first took hold in this country and flared into a community outbreak.
In recent analysis, it is believed that it is more likely that quick action by Washington State public health officials succeeded in stamping out any spread from the first infection. The outbreak that eventually flared in late February and early March at the LifeCare nursing facility in Kirkland, King County, WA was probably the result of a separate introduction from China around Feb. 13, either directly or by way of British Columbia.
Although, researchers are still studying the initial entry of the virus into the United States. At least two Washington residents who were sick in December later tested positive for antibodies to the new coronavirus, though it is not clear when their infections occurred. The first recorded death in the United States occurred in Snohomish County on Feb. 26, but posthumous analyses in California confirmed two earlier fatalities, the first on Feb. 6.
COVID Response Progression
Government Action
- On February 29, 2020, Governor Inslee declared a State of Emergency for Washington State, closing schools in King, Pierce and Snohomish counties and banning events and gatherings over 250 people.
Port of Everett Action
- Port entered into a three-level operating model at Level 3: Normal Operations with Precautions.
- Established a cross-functional internal team for COVID response to ensure a balanced response to keep commerce and business moving with appropriate safety measures.
- Reviewed Emergency Plan and Business Continuity Response and Recovery to provide guidance for a pandemic response or other guidance that could be used during a pandemic.
- Immediate withdrawal of all permits for events over 250.
- Negotiated a union Letter of Understanding (LOU) to allow for flexible work hours.
- Reviewed Port’s business interruption insurance; and
- Reached out to AAPA to see if anyone had a pandemic plan Port could use for guidance.
Government Action
- On March 13, 2020, Governor Inslee ordered the closure of ALL schools in Washington State until April 27, 2020.
- On March 13, 2020, the President of the United States declared a National Emergency to free up federal funds to quickly respond to the pandemic.
Port of Everett Action
- Created a financial tracking number for COVID expenses
- Focused on ensuring ISO 100 and ISO 700 FEMA training was complete
- Began work on the federal and state level for advocating for relief funding
- Procured IT equipment to support off-site working
- Started a COVID communication portal on our website
Government Action
- On March 16, 2020, Governor Inslee order restaurants to limit in-person dining, and bars, entertainment and indoor recreational facilities were ordered closed.
- On March 20, 2020, the mayor of Everett issued a directive for residents and businesses to stay home.
Port of Everett Action
- Finalized our Infectious Disease Response Plan with staffing levels for each business function based on the level of infectious disease impact
- Declared an Emergency, moved port operations to Level 2(Modified) operations
- Started evaluating budget impacts; deferred capital projects; hiring freeze; other cost cutting measures –with a goal of no staff financial impacts
Government Action
- On March 22, 2020, the President of the United States declared Washington state a disaster area.
- On March 23, 2020, Governor Inslee issues Stay Home, Stay Healthy Order to non-essential businesses for 2 weeks.
- On April 2, 2020, Governor Inslee extended a Stay Home, Stay Healthy Order to close all nonessential businesses until May 4, 2020.
Port of Everett Action
- Moved to Level 1: Emergency Operations on March 23
- Established a robust communications program
- Confirmed Essential versus Non-Essential staff requirements and followed the Stay Home Stay Healthy Order
- Developed and implemented a Commercial Tenant Rent Relief Policy; set guidance for marina slip holders.
Government Action
- On May 4, 2020 Governor Inslee signed Proclamation 20-25.3 and outlined the “Safe Start” plan, a phased approach to reopen Washington’s economy. Under the plan, businesses and activities will reopen in phases with adequate social distancing measures & health standards in place. Businesses may also need to meet additional requirements developed specifically for their industry.
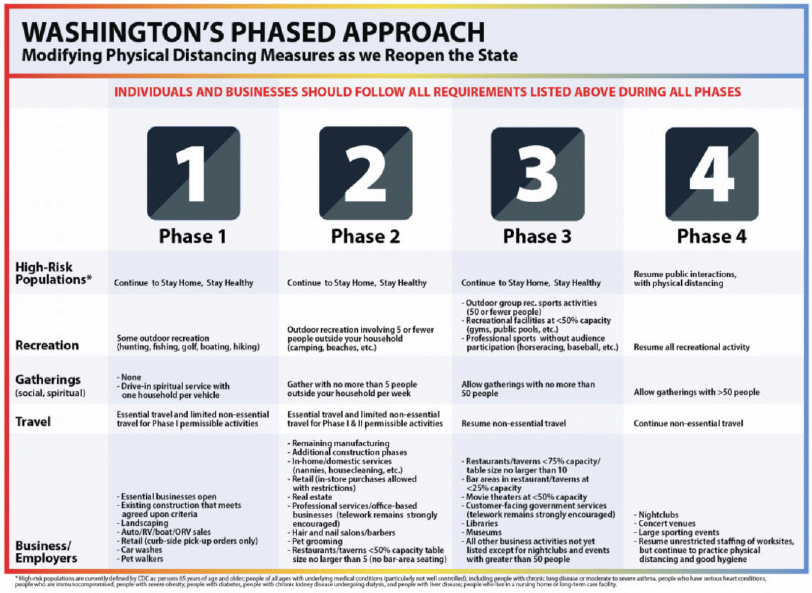
Exhibit 10: Washington State’s Phased COVID-19 Approach (Credit: State of Washington)
Port of Everett Action
- Ports were deemed an essential business, and the Port followed their Business Continuity Plan to align with the Governor’s Order under Phase 1 of the Safe Start Plan
Government Action
On Friday, May 29, 2020, Governor Inslee announced a new proclamation, which replaces his emergency stay-at-home order that expired Monday June 1,2020. It allows counties to move to a “modified Phase 1” — allowing some elements reopening — or Phase 2 if they have fewer than 25 new confirmed cases per 100,000 people in a 14-day period in addition to an array of other public health criteria. Previously counties needed fewer than 10 new confirmed cases per 100,000 people. Under this new approach, counties have more flexibility to demonstrate that they have the capability to stay on top of the virus.
Phase 2 allows more businesses to reopen with restrictions. Restaurants could open at 50% capacity. Retailers that weren’t considered essential under Inslee’s “Stay Home, Stay Healthy” order can resume in-store sales, but the shop will be limited to 15% of the building occupancy and indoor services limited to 30 minutes.
Inslee’s new directive also requires workers in Washington to wear facial coverings unless they do not interact with others on the job. The requirement begins Monday, June 8. Employers must provide the needed materials to their employees. Face coverings are not required to be worn by customers, but health officials strongly encourage people to wear masks.
After at least three weeks in Phase 2, counties can apply for Phase 3, which expands group gatherings to 50 or less, including sports activities, and allows restaurants to increase capacity to 75%. Gyms and movie theaters could reopen at half capacity, but nightclubs and entertainment venues must remain closed during this phase.
Most public interactions resume in the final phase, with bars, restaurants and entertainment and sporting venues returning to their regular capacity.
- Snohomish County leaders passed a resolution Friday, May 29th seeking the OK for the county to enter Phase 2 of the state’s four-phase “Safe Start” reopening plan. County officials then submitted the more than 40-page request for a variance on June 1 to the state Secretary of Health. This Plan was approved on June 5, 2020. At that point, Snohomish County was experiencing 25.3 new confirmed cases per 100,000 residents during that week, down from 26.1 new confirmed cases per 100,000 residents the week prior, according to data released from by the Snohomish Health District.
- At that point, the state had allowed 27 of the state’s 39 counties to advance to Phase 2.
As of July 1, the Governor put the “Safe Start” reopen process on hold due to the number of COVID cases within the Washington State. At this point the focus is reducing new COVID cases so that schools can return to in school learning.
Port of Everett Action
- No change-until Snohomish County is able to enter Phase 3. At that time, the Port Commission can return to in-person meetings with limited attendance. Currently the Commission is meeting virtually over Zoom.
Impacts affecting network performance/Supply chain responses
Primary
The Governor’s order on February 29, 2020, declaring a State of Emergency for Washington State put the Port on notice of a pending spread of a pandemic event that would affect their maritime terminals, marinas and other port-related businesses including port personal daily duties.
Secondary
The Port immediately reviewed the Emergency Plan and Business Continuity Response and Recovery Plan and stood up an internal COVID response group to monitor the event and make recommendations as to next steps. The Port followed the stay-at-home order based upon Port staff’s duties and provided telecommuting equipment to employees as needed
Tertiary
All businesses and shipping activities at the Port of Everett and surrounding area slowed dramatically as the pandemic reduced economic activity during the stay-at-home order. This was especially true of the Boeing Aviation Supply Chain that flows through the Port. During the months of March to June, Boeing experienced outbreaks at their facilities, and closed all Boeing Assembly Plants and Activities in Washington State for more than two weeks.
On April 6, 2020, The Boeing Company announced it would keep its Washington state and South Carolina factories and plants closed indefinitely because of the coronavirus pandemic. The company previously said the facilities would close for two weeks but has extended the closure as the number of COVID-19 cases grow in Washington. According to the Seattle Times as of April 6th, Boeing had 133 confirmed cases among employees worldwide, 95 of whom are in Washington state. The closing brings fresh uncertainty to the status of the 737 Max, the production of which has been on hold since January 2020. Boeing also said it would close its North Charleston, South Carolina, plant on Wednesday, April 8. The facility is home to one of Boeing’s two 787 Dreamliner assembly lines, the other being Everett plant, WA.
Range of impacts
Damage/Cost
As of the end of June, the Port expects 2020 to be down from budget but overall tracking closely with budget on the bottom line. The reductions that the Port has made in 2020 are to not only help some of the downturns but more importantly, the downturns the Port knows are coming in 2021. The Port has stated that up until now, ports have not been eligible for any relief funding opportunities, including CARES funding. The Port has deferred around $26 million in capital investments and if the Port is able to get some stimulus dollars the Port can revive some of the initiatives that have been delayed
Cost of preparing the response plans was minimal as the plans were developed with internal Port staff
Considerable effort and expense went into the development of an eight county Puget Sound Regional Catastrophic Disaster Transportation Recovery Plan, adopted in February 2011. A major component of that plan is planning for transportation disruptions that may result from a major earthquake in the Central Puget Sound. One element of that regional planning effort included using port facilities and the Puget Sound waterway system as a means for moving goods within the region until the road and rail transportation sectors can return to full operations.
In 2014, four ports (Tacoma, Seattle, Olympia, and Everett) in the Puget Sound including Port of Everett combined efforts to prepare and practice disaster recovery under the Puget Sound Regional Maritime Transportation Disaster Recovery Exercise Program (Exercise Program). Prior to the Exercise Program, the Regional Catastrophic Disaster Transportation Recovery Plan had not been exercised by the maritime community. Given the level of risk identified in the region, and the untested nature of the region’s plans, the four ports obtained funding and organizing a regional effort to exercise the Puget Sound Regional Catastrophic Disaster Transportation Recovery Plan (PSMRT). The ports wanted to enhance the exercise experience and the residual value of the exercise program by integrating interactive modeling and both qualitative and quantitative measures into the exercises. The group was interested in identifying the interdependencies between Critical Infrastructure and Key Resources (CIKR) elements within individual ports, between ports and their surrounding communities, and within the Puget Sound region as a whole. In order to ensure that the nature of these interdependencies was clearly defined, the exercise program focused on the potential financial impact on the ports given disruption of their business lines, and the regional economic impacts in terms of reduced economic activity and job loss. With this information, each port and the region would be able to analyze and understand the integral roles the ports play in supporting the regional economy and the critical nature of their rapid recovery following a significant disaster. The Port of Everett participated in PSMRT
developed four independent tabletop exercises. These exercises were tailored to each of the four ports invited by the Port of Tacoma to participate in the program (Each exercise was designed to focus on Continuity of Operations concerns and the transition from restoration of function to recovery following a terrorist attack on local CIKR. Each of the four scenarios focused on an individual port’s unique plans, procedures, and CIKR. The exercises provided each of the ports with the opportunity to strengthen their recovery planning and working relationships with their immediate neighbors and business partners. Each port exercise was very well attended and received. The port attendees expressed concern over a perceived lack of understanding by senior port leadership of how important it is to have an up-to-date business continuity plan.
Operational Effects
- Emergency Operations Level 1:
- Port Executive Director issued Emergency Declaration for the Port of Everett
- Full operation of the International Seaport and modified operations at the Marina
- Closed all port offices to the public, but business operating per usual with phone or electronic communication
- All staff that could work from home must; operations teams at Seaport and Marina reduced to maintain social distancing via staggered schedules/starts/stops/lunch
- Kept security’s schedules unaltered
- Implemented DocuSign, electronic Commission meetings and electronic approvals
- Rent relief to commercial tenants upon application and approval
Long Lasting Institutional Effects
Because of COVID-19, the Port has modified spending and has not had to lay employees off. However, the Port does have ten vacant positions which is equivalent to $1 million annually.
The Port has three major lines of business with the Seaport being a significant transportation node. The Port’s shipping terminals operate eight shipping berths on approximately 100 acres of land, and specialize in over dimensional, high, wide and heavy cargoes. The seaport is a vital link for the aerospace industry, handling all of the oversized parts of the 747, 767, 777 and 777X airplane production lines.
COVID has hit international cargo movements and especially air travel. The reduction in air travel has put Boeing in a position to review its current production schedules and supply chains. Currently, Boeing is specifically reviewing the production supply chain for the 787 and looking at the potential of consolidating the two production lines into one production line in South Carolina. This consolidation will affect the cargo volumes coming into the Port in the future which will reduce labor hours, etc.
As an outfall in the reduce air travel and reduced worldwide demand for new airplane due primarily due to the COVID pandemic, Boeing Co announced in late July 2020 that it would slash production of its biggest twin-engine jets and delay its new 777X by up to a year.
Boeing also remains exposed to tensions between the United States and China, which has shelved plans to buy big U.S. jets. Boeing said it would cut 787 outputs to six a month in 2021 - down from a
previous goal of seven and the third such cut since a year ago when output touched a record 14 a month.
It also plans to cut combined output of the 777 mini-jumbo and its new 777X sister model to two a month in 2021 from a previous goal of three, while delaying the 777X entry to service by a year to 2022
As part of a wider industrial reassessment, the Company is looking at whether to consolidate 787 productions in one location as it cuts output. Currently, production on the 787 Dreamliner is split between Everett, Washington, and North Charleston, South Carolina. This analysis is expected to include an evaluation as to the future of the Everett hub because the largest 787-10 can only be built in South Carolina. Although, it is too early to predict the outcome of the study, Boeing hopes to be able to return to a production rate of 10-11 787s monthly at some point. The extended shutdown points to renewed uncertainty surrounding production of Boeing’s 737 Max plane, which is built in its Renton, Washington, factory. Manufacturing of the plane has been suspended since January 2020. While Boeing had maintained production of the plane at 42 units per month since its global grounding in March 2019, it has been unable to deliver the planes to customers due to the grounding. The company began to run out of storage space, with about 400 planes awaiting delivery.
Boeing previously said it expected the plane to resume flying by “mid-2020.” However, as the coronavirus crisis leads to a massive cut in capacity by airlines, it is unclear whether this timeline remains. Airlines have been re-evaluating their fleet and have adjusted their order books. An example of these fleet evaluations is Avolo, airplane lessor, canceling an order for 75 Max planes, worth about $3.8 billion at list price, which is a major blow to Boeing.
The reduction of international cargo has hurt Port terminal revenues, causing the Port to evaluate and postpone expenditures.
Lessons Learned
Assessment of lessons learned
Although the Port was not prepared for a worldwide pandemic, it did have emergency and response plans in place that provided guidance on steps to take, policies in place, and procedures to follow. The Port was proactive in their response as soon as the governor declared an emergency, the Port quickly stepped into the response mode. Using their prepared plans, Port staff methodically, reviewed the current situation and prepared for potential full shut down. Fortunately, ports in Washington are considered essential services, so the Port was able to remain open with limited services while many other agencies struggled in their response. The Port quickly realized that to open their facilities back to the public was going to require distancing and capital improvements. Using their internal procurement procedures and pre-approved vendors, the Port purchased personal protective equipment and barriers that quicky became backorder or not obtainable by slower moving agencies.
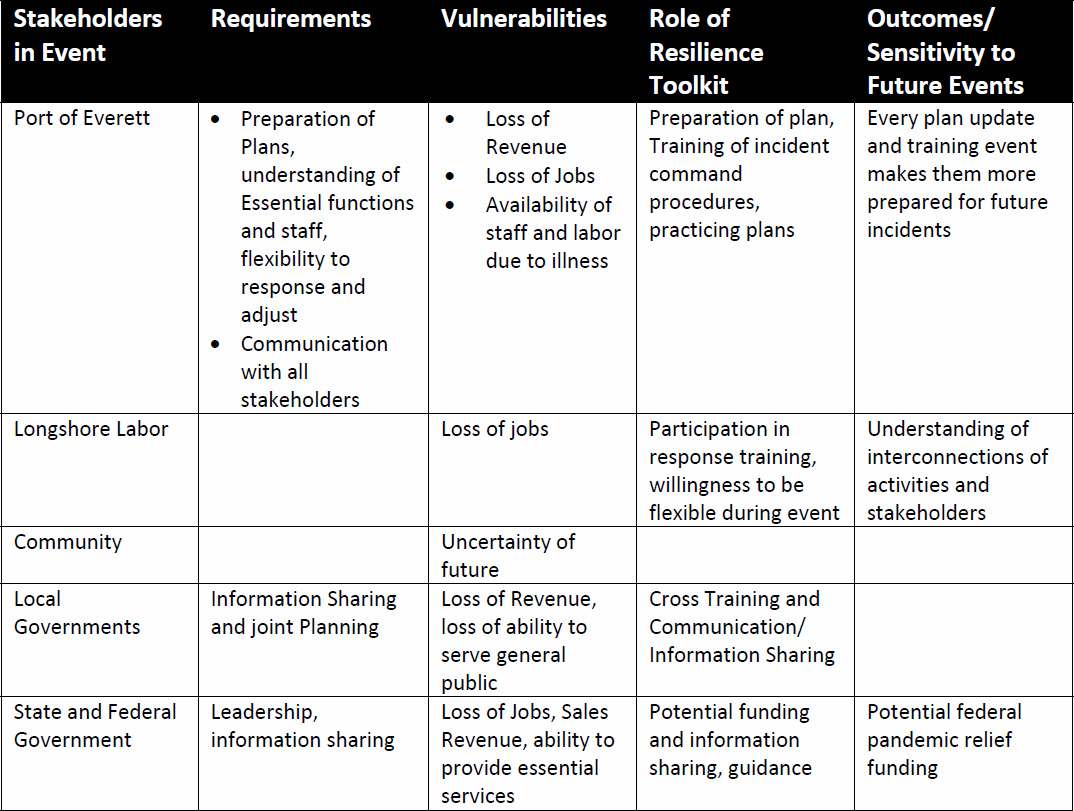
Exhibit 11: Matrix of Stakeholders and Actors in the Event, Their Requirements, Vulnerabilities, and Roles for Use of a Resilience Toolkit and Outcomes That May Be Sensitive to Equipping Such Actors in Such Events
Assessment of gaps in agency capacity to respond to disruption
Currently, it appears that the Port is cautiously responding to COVID and putting best practices into their facilities and daily activities. The staff continues to evaluate port spending and re-schedule capital improvement plans if needed. The Port will need to look at additional revenue diversification if Boeing relocates the Everett 787 assembly line to South Carolina. The Port will need to adjust their business practices as the state and nation moves through this pandemic and attempts to return to preCOVID normalcy.
Key Takeaways
Port quickly communicated to the public their responsibilities during the event. “As a critical function of our local, regional and national economy, the Port of Everett is committed to keeping freight moving and supporting our waterfront businesses, while prioritizing the health and safety of our workforce, their families and the greater community. By extending our telecommute policy and continuing to implement extensive social distancing measures to support our essential service functions, we can do our part to further slow the spread of COVID-19.” ~ Lisa Lefeber, CEO Port of Everett
Tools & methods used
- Continuity of Business Operations Plan (Continuity of Operations Plans [COOP]).
- The plan outlines policies and processes required to bring the marine terminals back online in case of natural or human-made disaster. Deals specifically with getting critical operations back online by order of priority.
- Activation of a cross-departmental Port working group to support the Port’s COVID-19 response and continuity of Port operations
- Implementation of the Port’s Infectious and Communicable Disease Preparedness Policy and Response Plan
- Support of flexible work options for Port employees (i.e., working remote, staggered schedules, etc.)
- Implementation of social distancing for internal and external encounters
- Recovery Priorities based upon Asset Revenue generation informed the decision-making process outlined potential Results of Financial Modeling of port assets was developed under a Port Security Grant and training developed in 2014 exercise.
3AB.2: Pre- and Post- Katrina Preparedness in New Orleans
Summary of Pre-Katrina Preparedness
Prior to Hurricane Katrina New Orleans and its surrounding parishes were accustomed to periodic hurricanes that overwhelmed levees, flooded the city, and wreaked havoc on the lives and livelihoods of residents. Typically, levees were rebuilt, debris was cleared, and private interests rebuilt damaged homes and buildings. Some improvements to the levee system were made prior to Katrina, but the system-wide project lacked funding and political will to complete a regional infrastructure project of such scale. Plans were in place prior to Katrina that were meant to improve outbound highway capacity for vehicle-based evacuation. Specifically, a contraflow program was established to double highway capacity for evacuation. Within the evacuation plan, however, there was an acknowledgment that hundreds of thousands of New Orleans residents would be unable to evacuate due to lack of access to private vehicles. The fact that this shortcoming was known but not dealt with is an obvious failure that has been widely chronicled in the disaster planning literature.
After Katrina and the resulting media scholarly response to the government’s inadequate planning, the city of New Orleans has taken steps to avoid a similar catastrophe. Namely, the NOLA Ready program is a concerted effort to promote awareness of plans for preparedness, sheltering in place, and evacuation. A clear improvement of the NOLA Ready program is its city-assisted evacuation plan. Through this plan, the city has designated 17 pickup points throughout the region, with some pick up points specifically intended for seniors and people with disabilities. In the case of another hurricane, the city will transport residents to shelters outside of the affected area and return them when conditions permit, all at no cost to fleeing residents. While this plan constitutes a vast improvement upon the previous evacuation plan that left carless and transit-dependent residents to fend for themselves, the estimated capacity of the program far underdelivers from previously established
demand. In order to indicate that New Orleans has learned from prior mistakes in disaster planning, the gap between potential demand for city-assisted evacuation and planned capacity should be eliminated.
Keywords: Preparedness, Highway, Network resilience, Flood
Description of Resilience Approach Taken
Pre-Katrina Preparedness:
The work that preceded Hurricane Katrina to prepare for what most concede as inevitable has since been extensively chronicled as inadequate. This is not to say, however, that the city and regional/state governments did nothing of note to prepare for hurricanes prior to the storm. As we will detail below, the majority of planning efforts were focused on facilitating highway travel away from the city and physically restraining flood waters with levees. Increased sophistication and scale of levees, along with intentional narratives that the city had been only moderately and temporarily affected by previous floods, contributed to a sense that the persistent problem of flooding had been largely engineered away. Below, we elaborate on the resilience activities that New Orleans and the region undertook prior to the advent of Katrina.
Levee Construction
Throughout a long history of disastrous hurricanes and diligent rebuilding, engineers and regional officials worked to establish stronger fortifications that could more effectively buffer the built environment of New Orleans from floodwaters. The onus of construction originally fell upon landowners, mandated to be built at the owner’s expense during the colonial period. As the country and region developed, so did its bureaucracy, with additional agencies assuming the charge of protecting coastal areas and ensuring their safety. Eventually, the Corps of Engineers developed a model of a 200-year storm, basing their projects on what would be required to protect the city from such a storm. To meet the needs of this projection, upgraded or replaced levees would be built one foot higher than their previous height. A systematic, region-wide infrastructure retrofitting program never took shape, however. Instead, improvement happened sporadically, with costs exceeding budgets and no sustainable funding mechanisms in place. By the time of Katrina, only parts of the levee system were entirely complete, with many parts only partially complete, leaving the system as a whole ill-prepared to handle what would come.
Forecasting and Communications
One clear resilience effort that can be observed in New Orleans, and throughout the U.S. and Western world, was the advancement in meteorology and communication technology. In the early 1900s, meteorologists could observe conditions that were ripe for producing hurricanes, but they had little ability to track or monitor storms at that point. Furthermore, communicating risks to residents was more challenging at that time, with print media the only reliable and ubiquitous medium for doing so. By the 1960s both weather predicting and communication technologies had advanced to the point where officials could warn residents of impending storms via radio and television broadcasting with some reliability. Today, storms can be tracked for days, and modern communication technology and media can provide ample notice to residents that evacuation is necessary. Reflecting these advances in
ability to predict destructive storms, in the five years leading up to Katrina, there were a number of prescient warnings that detailed the dangers New Orleans faced when the inevitable were to happen. These warnings came in the form of articles in popular magazines, local newspaper articles, in scientific papers, and in modeling/simulation exercises (Fischetti 2001; McQuaid and Schelefstein, 2002; Lundgren & McMakin, 2004; FEMA, 2004).
New Orleans Evacuation Plan
The New Orleans Evacuation Plan was a regional plan to evacuate New Orleans in the case of a major hurricane. It was developed by local and state transportation agencies as well as law enforcement agencies to facilitate a safe and expeditious evacuation of residents of New Orleans. The primary focus of the evacuation plan was accommodating the anticipated strain on the highway system of a short period of high demand on two northbound highways. To provide excess capacity, authorities planned to enact a contraflow plan, wherein all lanes of the highway would be dedicated to outbound traffic. Below, Exhibit 12 depicts the traffic management plan associated with the contraflow strategy.
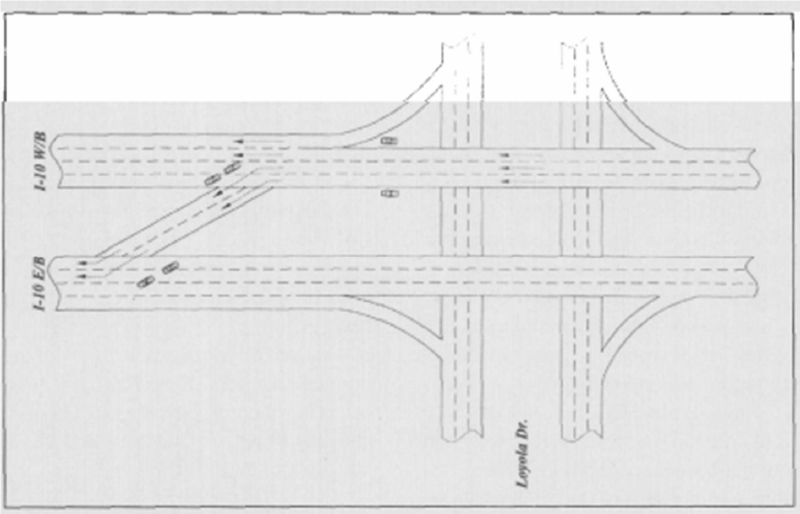
Exhibit 12: Contraflow Traffic Management Plan (Credit: Wolshon, 2002)
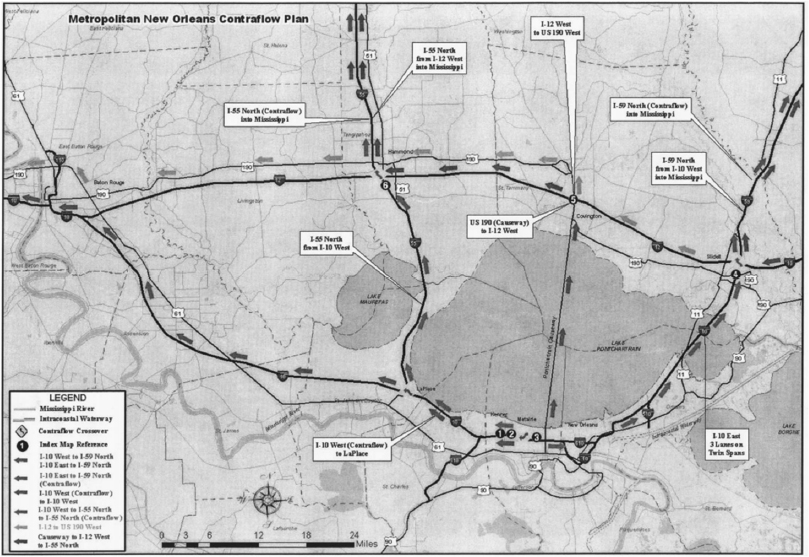
Exhibit 13: New Orleans Evacuation/Contra-flow Map (Credit: Wolshon et al., 2006)
Post-Katrina Preparedness:
Having been commonly cited (Frasmand, 2007; Cooper & Block, 2007; Nadesan, 2008) as the epitome of inadequate disaster planning, New Orleans has worked hard to avoid being caught ill-prepared for future natural disasters. The critiques made by the media, officials, and this research have been addressed, in large part, through updated disaster planning. In this section, we will discuss specific efforts to account for and learn from mistakes in preparing for past hurricanes. Specifically, we will discuss communication efforts and city-assisted evacuation plans. Our research indicates that New Orleans is now much better prepared to respond to a major hurricane, and their efforts incorporate equity and environmental justice approaches now in a way that was absent prior to Hurricane Katrina.
Hazard Communication
As will be discussed later in the report, issues of public trust have long plagued New Orleans officials in their efforts to communicate risk and impose mandatory evacuations. In an attempt to minimize this distrust and open effective lines of communication between disaster planning staff and residents of New Orleans, the city has enacted a communications plan that actively reaches the community through a variety of mediums. With a ubiquitous social media campaign, “NOLA Ready” has an extensive reach among all common outlets with nearly 100,000 followers between the multiple outlets. While the program was largely designed to relay information related to hurricanes and floods, it has also been used to present public health information associated with the ongoing coronavirus pandemic. This shows that building communications infrastructure for resilience is best when it can be easily adapted as a changing world mandates efforts be refocused. In addition to social media and a central website with a plethora of information, there has also been a significant endeavor to improve the accessibility and legibility of information for a general public with the use of infographics and interactive portals that present important and often complex information in an easily understood format. Each element of the updated plan can be found in infographic format with clickable hyperlinks
that take the public to areas of additional information. Presenting disaster plans in this manner allows residents to be more actively aware of the options available to them in case of emergency, potentially leading to less panic and confusion.
City-Assisted Evacuation
The pre-Katrina evacuation plan only prepared for personal vehicle travel, leaving those without access to this mode with few options. Today, however, New Orleans has a much more comprehensive set of options for those without access to automobiles. Through the NOLA Ready program, the city has outlined a comprehensive plan for facilitating the evacuation of residents that are reliant on public transportation. Utilizing reassigned public transit capacity, the “free and public option” is a city-assisted evacuation. According to public communications produced as part of the plan, this plan provides for an anticipated 35-40,000 residents to make use of public transport as means to access outside shelter locations, and then as a means to return home. Separate from the normal transit system, the NOLA Ready program has established pick up points (evacuspots) in 17 locations throughout the city, four particularly designated for seniors. Seniors and others with medical conditions will gather in indoor evacuspots to await transport to outside shelters. Additionally, in a paratransit-like system, people that foresee being unable to make their way to evacuspots can register to be picked up in situ. The city-assisted evacuation program is triggered when the mayor declares a mandatory evacuation, from which point there is an established timeline outlined on many infographics and materials provided by the NOLA Ready program. Shelters plan to provide food and refuge for evacuees until officials deem it safe for residents to return. Below, Exhibit 14 illustrates the timeline as presented by the NOLA Ready program.
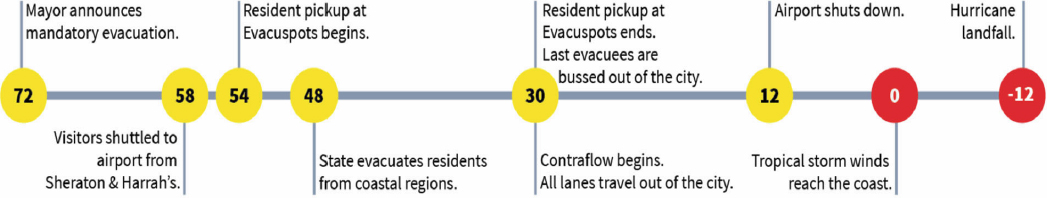
Exhibit 14: 72-hour Evacuation Timeline (Credit: NOLA Ready)
Although the effectiveness of the City-Assisted Evacuation program is yet to be seen, its existence alone is an improvement upon pre-Katrina evacuation planning. One concerning figure, however, is that the plan accounts for an estimated 35-40,000 evacuees. According to accounts that will be discussed later in this report, some 130,000 residents were unable to evacuate during Hurricane Katrina. This suggests that there is still a gap in the ability of the planned response to evacuate transit-dependent residents and the actual demand of this response by those in need.
Transit Dedicated Highway Capacity
An additional preparedness action that has been suggested in the literature, but not officially planned, is the dedication of highway capacity to transit vehicles in the case of an evacuation. Litman (2006) suggests that dedicating highway capacity to transit-exclusive purposes can act to both improve the equity of an evacuation program, but it can also help to increase the outbound capacity of the roadway
itself. Litman posits that a single highway lane can accommodate 2500 auto passengers per hour when cars are carrying a full load of passengers. However, that same lane can accommodate 15,000 passengers per hour with buses carrying about ⅔ capacity of passengers (an estimate of actual emergency capacity when also accounting for luggage and wheelchairs). Therefore, Litman claims that by dedicating a single lane of highway capacity to buses, the person-carrying capacity of a highway can be greatly increased. He goes on to estimate that a city with 1 million residents can reasonably evacuate its entire population in under 24 hours if it has two four-lane highways and half of the residents are transported by bus. With existing infrastructure, the New Orleans region’s highway capacity is greater than required by Litman’s proposed scenario. Light and heavy rail lines would perform even better for evacuation purposes, but such infrastructure would likely require additional uses to justify the capital expense.
Key Takeaways
The shortcomings of New Orleans and regional actors to adequately prepare for an inevitable shock to their system defines the concept of resilience in regional transportation planning. Resilience requires planning for stresses beyond what a region might have prior experience by providing additional capacity, resources, and adaptability to uncertain conditions. These are not qualities that are generally ascribed to New Orleans’ efforts prior to Katrina. After the shock and subsequent scrutiny and criticism, New Orleans has made progress to present plans that address many of the shortcomings of the Katrina planning and response. Most notably, the city has produced a widely covered NOLA Ready plan that clearly outlines how residents can prepare and respond to a disaster in the future. This plan has already shown elements of resilience in its ability to adapt, responding to the public health crisis of the coronavirus using communication infrastructure that was already in place. The city has also reacted to the equity concerns of pre-Katrina evacuation plans by establishing a city-assisted evacuation plan. This plan provides means for evacuation for up to 40,000 New Orleans residents via pick up points, evacuation centers, and eventually, safe shelters outside of flood-prone areas. This represents a vast improvement over pre-Katrina evacuation plans, but a gap between promised services and previously experienced demand is significant. Additional city-assisted evacuation capacity will need to be facilitated in order to avoid unnecessary suffering and equity-based criticism of the city’s plan.
3AB.2.1 Response to Hurricane Katrina
Summary of Katrina Response
We see that an unfortunate combination of errors led to a weakened response to Hurricane Katrina. An inadequate levee system was not properly updated after the previous storm, in large part because of ineffectual governance and mismanagement of public funds. The existing plans for evacuation only addressed vehicle travel and consideration of transit-dependent residents was nonexistent. A weakened national guard was limited in their capacity by the number of available guardsmen, the quality of equipment remaining, and handicapped communications systems. Around 20,000 residents were able to take shelter in the Superdome, and reports of poor management and unsafe conditions were ubiquitous in this setting as well. Finally, 130,000 other residents were unable or unwilling to
evacuate but also were not permitted into the overcrowded shelter. All told, nearly 2000 people lost their lives in the disaster and the city has yet to recover in terms of economic outcomes and population.
Keywords: Response, Highway, Network resilience, Flood
Description of Resilience Approach Taken
New Orleans Prior to Hurricane Katrina
The demographic growth that New Orleans experienced until 1960 shifted from that point forward. After 1960 the city began experiencing population loss, some of which was attributable to white flight to newly developed suburbs. As a result, the city shifted from a White majority in 1960 (62%), to a Black majority in 2000 (67%). These spatial and socioeconomic changes not only affected the demographic makeup of New Orleans, but it also required that additional infrastructure be built to protect the suburbs from the threats of flooding. The recovery efforts, Colten et al. (2008) claim, even contributed to further disadvantaging impoverished residents by cutting them off to the rest of the city with physical barriers used for holding back flood waters. The authors contend that these infrastructure improvements meant to curtail the threat of floods acted to exacerbate issues of segregation and access in the city.
Hurricane Katrina was not necessarily an anomalous event, as New Orleans has experienced countless devastating floods and hurricanes throughout its history. Notable events of the 20th century include the Great Mississippi Flood of 1927, the Hurricane of 1947, Hurricane Betsy, Hurricane Camile, and Hurricane Georges (Fearnley et al., 2009). Shocks from floods, hurricanes, and other disasters prior to Katrina were generally followed by swift recovery, owing largely to positive economic and demographic trends in the region that countervailed the consistent drag of disasters (Colten et al., 2008). Adding to the sentiment that New Orleans persisted relatively unaffected was an effort by local officials to boost claims that businesses and commercial activity quickly rebounded.
Hurricane Katrina
In August of 2005, the National Hurricane Center provided warning to New Orleans of the imminent landfall of catastrophic hurricane. As the hurricane grew nearer, the governor of Louisiana requested a federal emergency declaration, which activated the National Guard and additional state agencies. While other parishes declared evacuations August 27, 2005, the mayor of New Orleans waited until the 28th. To facilitate expedient highway-based evacuation, the contraflow plan was enacted, allowing outbound travelers to utilize the entire capacity of north-south oriented highways. For those that waited too long or did not have private vehicles to flee, the Superdome (a professional sports arena) was utilized as a mass refuge of last resort. These two strategies: added highway capacity and a mass refuge, were the main responses enacted by local officials in response to the hurricane.
More than one million evacuees had been able to flee New Orleans to shelter with friends, family, and in lodging facilities. To facilitate this exodus, transportation agencies enacted the contra-flow plan, which allowed for all traffic lanes (north and southbound) to be used for northbound evacuation. Staging facilities were created by the Red Cross and military to provide supplies for evacuees. 130,000 other residents, however, either voluntarily stayed behind to weather the storm or did not have the
means to evacuate. Those that remained sought refuge in the Superdome, which was considered the “shelter of last resort.” There are conflicting reports of how many people ended up in the Superdome, with upper estimates around 20,000. This figure also indicates that over 100,000 New Orleans residents were left to fend for themselves, with no official shelter provided. This number of unprotected residents represents a failure in response, but also in planning, as the amount of people unable or unwilling to evacuate was close to what the hurricane evacuation plan had originally predicted.
An additional problem that complicated the response to Katrina related to limited capacity of government agencies. First, the National Guard is an important stakeholder in responding to major disasters. Although the guard was called in to assist with disaster response, its effectiveness in this role has been widely questioned. The number of available guardsmen was diminished because of deployment overseas. The equipment available to the guard in Louisiana was also limited, with the most advanced equipment in Iraq. Communications were also compromised for the National Guard and other agencies responding to the crisis as landlines failed and more pressure was placed on cell systems. Because of this poor communication, the National Guard actually kept aid workers from entering the city during the response. Red Cross and other organizations were unable to enter the city for days. Poor management of public agencies also limited the government’s ability to respond to the disaster. In many cases, public servants abandoned their posts in order to care for their families instead. Mismanagement of public funds was also a contributing factor to the crippled response. Had the levee project been completed on time with adequate funding, it is likely what flooding would have occurred would have been much less destructive than the floods that eventually covered 80% of the city.
Critical Assessment of Success or Challenges of Approach
Issues of Equity in Response to Hurricane Katrina
Some have argued that the high number of residents failing to evacuate was in some part due to historic lack of trust in government officials by minority and low-income communities. Their distrust can be traced to earlier hurricane responses. In particular, The Great Mississippi Flood of 1927 was an example of environmental injustice where the lives and livelihoods of poor and communities of color were sacrificed for mostly financial interests (Colten et al., 2008). In this example, as flood waters rose to a point where levee breaches seemed imminent and important downtown areas and financial institutions were threatened, officials decided to produce a “controlled break” of the levees, downstream from where they deemed the most important parts of the city. These downstream areas, however, were mostly inhabited by impoverished communities. This strategy was successful in its goal of reducing the height of flood waters above the break and protecting the places where political and financial power were seated. The loss of life and economic opportunity for the downstream disadvantaged communities was considered a justified sacrifice.
The legacy of this injustice persisted in the planning and response to Hurricane Katrina. The first and most obvious issue of equity in the New Orleans Hurricane Evacuation Plan was the fact that it relied entirely on personal vehicles as the means for evacuation. The plan itself even recognized that many residents would be unable to evacuate for lack of access to vehicles or friends or relatives with vehicles. The evacuation plan in place indicated three reasons that people might not evacuate in the
case of a major hurricane: unwillingness to leave, lack of access to personal transportation, and lack of highway capacity. Of these three reasons, the evacuation plan only responds to one: lack of highway capacity. The choice to neglect the other two obstacles to safely evacuating all New Orleans residents demonstrates a bias toward those with socioeconomic advantage and a lack of commitment to those without. The evacuation plan identified 200-300,000 residents that would be unable to utilize the highway system to seek refuge. This plan, however, suggests increasing outbound highway capacity to facilitate safe evacuation for those with the means to own and maintain a private vehicle. The official guidance in the plan for those who do not have personal transportation options is to seek charity from friends or family. The futility of this guidance is recognized in the figure of hundreds of thousands of residents that are predicted to be left behind because of lack of accessibility.
Equity in Transit Today
In a recent study by Lyons & Choi (2020), they compare transit service economic equity in six U.S. regions. New Orleans scored highest in their overall transit economic equity index (TEEI), with a composite score of 1.187. This index is composed of three component indices: transit service convenience score, system access score, and nonpeak-hour service score. The figure of 1.187 indicates that the system is serving disadvantaged populations of New Orleans better than it serves advantaged populations. With a high transit service convenience score, the authors find that neighborhoods with higher levels of poverty and non-white residents are more conveniently connected to employment centers via transit than their advantaged counterparts. This finding is promising for New Orleans, although a limitation of the measure should be noted. The TEEI can tell us how transit service compares between disadvantaged and advantaged neighborhoods. The relatively high TEEI score in New Orleans indicates that transit service connects disadvantaged neighborhoods to employment centers better than it does for advantaged neighborhoods. It does not tell us, however, how good the service is in general.
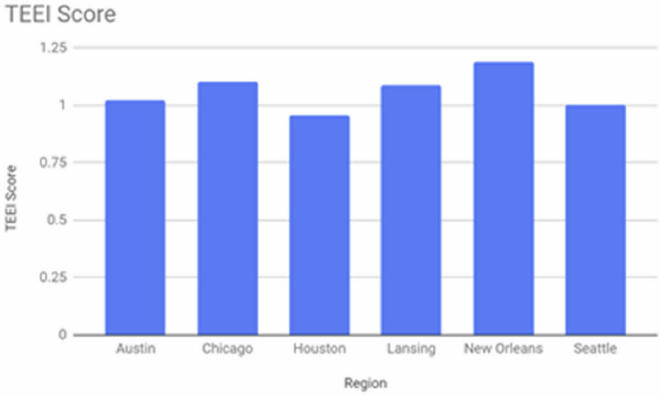
Exhibit 15: Comparative Transit Economic Equity Index (TEEI)
Key Takeaways
A resilient system is one with many safeguards, redundancy, and adaptability. We see somewhat of the opposite in the planning and response to Hurricane Katrina. Overstressed systems such as the communication network, highways, flood protection, and government agencies exemplify a lack of resilience, and the disconcerted response to Hurricane Katrina is evidence for the need for resilience in these systems. According to Litman (2006), the following should be considered best practices for resilient transportation systems:
- Include disaster response as part of all transportation planning
- Establish a system to prioritize evacuations based on location, need, and ability
- Coordinate vehicle rentals and fuel supplies, provide special services along evacuation routes
- Create networks for contacting and providing services for the most vulnerable people
- Give buses and other high-occupancy vehicles priority
- Have an adequate inventory of buses and drivers with clearly established instructions for emergency operation
- Coordinate fuel, emergency repair, and other mobility support service
3AB.3: COVID-19: A Regional Response to a Global Health Pandemic (report out only)
In the wake of an earlier global conflict and humanitarian crises we know today as World War II, emerged the United Nations (UN). October 24th, 2020 marked the 75th birthday of the UN. The UN was formed to maintain international peace and to foster cooperation in solving international problems of “economic, social, cultural or humanitarian character.” (United Nations, 1945) The UN Charter was signed in 1945 by fifty-one original member nations including the United States, China, Soviet Union, France and United Kingdom. Today, the UN is made up of 193 member nations.
A primary function of the UN is to deliver humanitarian aid to countries that have been affected by natural and human-made disasters that exceed the relief abilities of the national government alone. The UN delivers humanitarian aid through four programs: United Nations Development Program (UNDP), the United Nations Refugee Agency (UNHCR), the United Nations Children’s Fund (UNICEF) and the World Food Program (WFP). A fifth program, the World Health Organization (WHO) coordinates international responses to health emergencies. (UN, accessed October 2020) The WHO was formed in 1948. The WFP was created in 1961 at the request of President Dwight D. Eisenhower. This year, in 2020 the WFP won the Nobel Peace Prize for its legacy of fighting hunger in conflict ridden regions around the globe.
A key mission of the WHO is to direct and coordinate response to threats against public health on an international scale. The agency is governed by its member states and does not have legal authority to enter a country or force countries to take its advice. Through the International Health Regulation signed by all member counties in 2005, WHO members are required to report to WHO any disease outbreaks that are unexpected, of unknown cause and carry a significant risk of spreading internationally.
When the COVID-19 pandemic hit the world stage in early 2020, the resilience of global supply chains was severely tested. A combination of panic buying, heavy dependence on selects providers and country or industry shutdowns resulted in a number of widely publicized shortages in medical, food and consumer products industries. In response to the COVID-19 supply chain issues affecting personal protective equipment (PPE) and medical supplies, a Supply Chain Taskforce co-chaired by WHO and the WFP was formed. In a statement issued by WHO regarding the Taskforce it said:
The Task Force oversees a concerted and coordinated approach that both leverages the well-established and proven systems, process, and mechanisms that participating partners have in place while reflecting the need to build on respective strengths and generate synergies for enhanced collaboration in these exceptional circumstances.
(WHO, April 2020)
The WHO’s Supply Chain Task Force is at the top of an operating pyramid organizational structure. The Task Force is comprised of representatives from key health and relief agencies that include the World Bank, UNICEF, and the Red Cross among others. The Task Force provides strategic guidance and oversees an inter-agency Purchasing Consortia which coordinates the demand for supplies, uses its multiagency buying power to negotiate price, operates an online order portal and allocates supplies to countries that make requests through the portal. At the base of the pyramid is the “Control Tower” which manages the day-to-day operations of the medical and PPE supply chains. The Control Tower is described as the “central interface where country demand, partner procurement mechanism and logistics/distribution come together.” One of the early actions of the Supply Chain Task Force following its formation, was the designation of eight airports around the globe to act as distribution hubs to facilitate the expedited movement of critical supplies. The eight air cargo hubs in Belgium, China, Ethiopia, Ghana, Malaysia, Panama, South Africa and the United Arab Emirates.
Today, the Liege Airport is known as FlexPort and markets itself as the most flexible air cargo airport in Europe. In addition to acting as a FedEx/TNT sorting hub, it also specializes in humanitarian aid transport, including medicines and pharmaceutical products. Within the WHO supply chain air cargo network, some hubs are receiving hubs and others are distribution hubs. Liege is a distribution hub in the network.
Minnesota is home to one of the largest concentrations of health care technology manufacturers, pharmaceutical and healthcare providers in the U.S. For more than a decade regional leader for the medical products and associated industries have collaborated through an association called Medical Alley, in large part to build a brand around the region as the “Epicenter of Health Innovation and Care.” So, when WHO did not designate an air cargo hub in North America as part of its medical supply chain network it did not go unnoticed among regional leadership.
In response to what seemed to be a missed opportunity, leaders from health care, third-party logistics, local government, and academia in the Minneapolis/St. Paul Region began a conversation through a series of internet meetings. In late 2020, the regional leadership group has formed a new consortium known as the Global Wellness Consortium (GWC). The GWC recently formed a legal charter and organized as a 501 (c)(3) non-profit organization.
Early on during the COVID-19 pandemic, a GWC member and former Minnesota Secretary of State Mark Ritchie, reached out to contacts he had associated with Liege Airport in Belgium. Since the spring of 2020 GWC has held multiple internet video meetings with representatives from Liege Airport to better understand their strategy for becoming a medical supply distribution hub for Europe.
As the regional GWC network expanded the consortium has been able to tap into supply chain clusters research at the University of Minnesota, seek insights from regional logistics and trade experts familiar with medical products and PPE supply chain developments.
A key lesson to date is that having a regional reputation and brand around particular products, or industries has advantages from an international clearance standpoint. The group learned that cities like Houston with an international reputation about petroleum products have specialists in their U.S. Customs Facilities to ease trade huddles through frictionless product clearance. As the GWC continues to extend its network toward building a brand for the Upper Midwest as the North American leader not only in medical product manufacturing, but also as a medical supply distribution hub, they hope to effectively go from sitting on the bench, to being a star player in the game.
Keywords: Pandemic, Supply chain delays, Aviation
References
100 Resilient Cities relaunches as an independent network. (2020). Retrieved from Cities Today website: https://cities-today.com/100-resilient-cities-relaunches-as-an-independent-network
1989 Loma Prieta earthquake. (n.d.). Retrieved from https://en.wikipedia.org/wiki/1989_Loma_Prieta_earthquake
American Trucking Association. (2020). Retrieved from American Trucking Association website: https://www.trucking.org/COVID19/state-declarations
ARC Vulnerability and Resiliency Framework for the Atlanta Region. (2018). In Atlanta Regional Commission. https://doi.org/10.20622/jltajournal.16.0_toc1
Atlanta Regional Commission. (2020). Request for Proposal: Resilience Plan – Transportation System Vulnerability & High-level Risk assessment. Retrieved from https://cdn.atlantaregional.org/wp-content/uploads/resilience-final-rfp.pdf
BALTIMORE’ S RAILROAD NETWORK: ANALYSIS AND RECOMMENDATIONS. (2011). Retrieved from http://www.insystem.com/usgs/mdothst.pdf
Buxton, R. (2013). Critical Infrastructure Interdependency Modelling, a Comparison of Approaches Used by CIPMA, SMART and GNS Science. GNS Science.
Charter of the United Nations, Chapter 1: Purposes and Principles. (n.d.). Retrieved from https://www.un.org/en/sections/un-charter/chapter-i/index.html
Chico, R. C. (2016). Puerto Rico’s Roads Go from Bad to Worse. Retrieved from endi website: https://www.elnuevodia.com/english/news/story/puerto-ricos-roads-go-from-bad-to-worse/
Circle – Vital infrastructure: Relationships and consequences, cascade effects. (n.d.). Retrieved from https://www.deltares.nl/nl/software/circle_vitale_infrastructuur/
CLEAN Business List. (n.d.). Retrieved from https://www.chulavistaca.gov/departments/clean/clean-business-program/clean-business-list
Climate Ready Boston: Final Report. (2016).
Climate Resilience Design Guidelines. (2018). Retrieved from https://www.panynj.gov/port-authority/en/about/Environmental-Initiatives/sustainable-resilient-development.html
Coastal Flood Resilience Design Guidelines. (2019).
Coastal Resilience Solutions for East Boston and Charlestown. (2017).
Coastal Resilience Solutions for South Boston: Executive Summary. (2018).
Cole, T. W., & Fellows, K. L. (2008). Risk communication failure: A case study of new orleans and hurricane katrina. Southern Communication Journal, 73(3), 211–228. https://doi.org/10.1080/10417940802219702
Colten, C. E., Kates, R. W., & Laska, S. B. (2008). Community Resilience: Lessons from New Orleans and Hurricane Katrina. CARRI Research Report 3, 1–39.
Commendatore, C. (2020). COVID-19 strains supply chains, last-mile delivery operations. Retrieved from FleetOwner website: https://www.fleetowner.com/covid-19-coverage/article/21129632/covid19-strains-supply-chains-lastmile-delivery-operations
Cooper, C., & Block, R. (2007). Disaster: Hurricane Katrina and the failure of homeland security. Macmillan.
Council on Port Performance. (n.d.). Retrieved from https://www.panynj.gov/port/en/our-port/council-on-port-performance-.html
COVID-19 Impact on Iowa’s Supply Chain. (2020). Retrieved from dailyiowan website: https://dailyiowan.com/2020/06/29/covid-19-impact-on-iowas-supply-chain/
Deliver Humanitarian Aid. (n.d.). Retrieved from https://www.un.org/en/sections/what-we-do/deliver-humanitarian-aid/index.html
DePass, D. (2020). MidWest Business Condition. Retrieved August 9, 2020, from Star Tribune website: https://www.startribune.com/minnesota-midwest-factory-conditions-plunge-because-of-coronavirus/569283692/
Domingue, S. J., & Emrich, C. T. (2019). Social Vulnerability and Procedural Equity: Exploring the Distribution of Disaster Aid Across Counties in the United States. American Review of Public Administration, 49(8), 897–913. https://doi.org/10.1177/0275074019856122
DOMINO. (n.d.). Retrieved from Polytechnique Montréal website: https://www.polymtl.ca/centre-risque-performance/en/domino
Eller, D. (2020). Pandemic creates heartache for Iowa farmers, workers and possibly consumer. Retrieved from Agriculture website: https://www.desmoinesregister.com/story/money/agriculture/2020/04/23/coronavirus-causing-food-supply-chain-challenges-iowa-processing-plant-closures/3008171001/
Emrich, C. T., Tate, E., Larson, S. E., & Zhou, Y. (2020). Measuring social equity in flood recovery funding. Environmental Hazards, 19(3), 228–250. https://doi.org/10.1080/17477891.2019.1675578
EU announces Euro 1.9 lakh to Indian Red Cross Society for Kerala flood relief | India News, The Indian Express. (2018). Retrieved October 26, 2020, from https://indianexpress.com/article/india/eu-announces-aid-indian-red-cross-society-kerala-flood-relief-5321472/
Farazmand, A. (2007). Learning from the Katrina crisis: A global and international perspective with implications for future crisis management. Public Administration Review, 67(SUPPL. 1), 149–159. https://doi.org/10.1111/j.1540-6210.2007.00824.x
FARM, FOOD AND AGRIBUSINESS COVID-19 IMPACT SURVEY. (2020). Retrieved from https://ofbf.org/app/uploads/2020/04/Farm-Food-and-Agribusiness-COVID-19-Survey-web.pdf
Fearnley, S. M., Miner, M. D., Kulp, M., Bohling, C., & Penland, S. (2009). Hurricane impact and recovery shoreline change analysis of the Chandeleur Islands, Louisiana, USA: 1855 to 2005. Geo-Marine Letters, 29(6), 455–466. https://doi.org/10.1007/s00367-009-0155-5
Federal Emergency Management Administration. (2004). Hurricane Pam exercise concludes. Retrieved from http://www.fema.gov/news/newsrelease_print.fema?id=13051
Federal Emergency Management Agency. (2018). 2017 Hurricane Season FEMA After-Action Report. In FEMA.
Financing climate Resilience Sustainable Solutions Lab Mobilizing Resources and Incentives to Protect Boston from Climate Risks. (2018).
Fink, S. (2018). Puerto Rico’s Hurricane Maria Death Toll Could Exceed 4,000, New Study Estimates - The New York Times. Retrieved October 22, 2020, from https://www.nytimes.com/2018/05/29/us/puerto-rico-deaths-hurricane.html
Fischetti, M. (2008). Drowning New Orleans. Retrieved from Scientific American website: https://www.scientificamerican.com/article/drowning-new-orleans-hurricane-prediction/.
Filosa, G., A. Plovnick, L. Stahl, R. Miller, and D. Pickrell. (2017). Vulnerability Assessment and Adaptation Framework, Third Edition. U.S. Department of Transportation, John A Volpe National Transportation Systems Center, Cambridge, MA.
Florida long range transportation planning Needs Plan Guidelines. (n.d.). Retrieved from https://fdotwww.blob.core.windows.net/sitefinity/docs/default-source/planning/policy/metrosupport/resources/lrtp-needs-plan-guidelines(final).pdf?sfvrsn=a52adac6_0
Georgia State University Leads Atlanta in National Initiative to Help Cities Develop Resilience. (2019). Retrieved from Georgia State University website: https://news.gsu.edu/2019/11/21/growing-convergence-research-david-iwaniec
Geronimo, L. (2019). Sea level rise and storm surge: Incorporating Uncertainty and Equity into Transportation Planning for the San Juan Metropolitan Area, Puerto Rico. 1–70.
Gibbins, J. D., Hale, C., Silver, M., Fischer, M., Steinberg, J., Basler, C. A., … Hornsby-myers, J. (2020). COVID-19 Among Workers in Meat and Poultry Processing Facilities. In CDC. Retrieved from https://www.cdc.gov/mmwr/volumes/69/wr/mm6918e3.htm
Good, K. (2020). Food Supply Chain During COVID-19. Retrieved August 9, 2020, from agricultural economy website: https://farmpolicynews.illinois.edu/2020/05/some-kinks-in-food-supply-chain-persist-as-covid-19-fallout-goes-on/
Gray, R. S. (2020). Agriculture, transportation, and the COVID-19 crisis. Canadian Journal of Agricultural Economics, 68(2), 239–243. https://doi.org/10.1111/cjag.12235
Greenberg, A. (2010). The Untold Story of NotPetya, the Most Devastating Cyberattack in History. Retrieved from https://www.wired.com/story/notpetya-cyberattack-ukraine-russia-code-crashed-the-world/
Greenberg, A. (2018). The Untold Story of NotPetya, the Most Devastating Cyberattack in History. Wired Magazine. Retrieved from https://www.wired.com/story/notpetya-cyberattack-ukraine-russia-code-crashed-the-world/
Grube, L. E., Fike, R., & Storr, V. H. (2018). Navigating disaster: An empirical study of federal assistance following hurricane sandy. Eastern Economic Journal, 44(4), 576–593.
GW Researchers: 2,975 Excess Deaths Linked to Hurricane Maria | GW Today | The George Washington University. (2018). Retrieved October 22, 2020, from https://gwtoday.gwu.edu/gw-researchers-2975-excess-deaths-linked-hurricane-maria
Hernández, A. R., & Mufson, S. (2017). Getting relief supplies to Puerto Rico ports is only half the problem. Retrieved from Economy website: https://www.washingtonpost.com/business/economy/getting-relief-supplies-to-puerto-rico-ports-is-only-half-the-problem/2017/09/28/9ff558a6-a460-11e7-8cfe-d5b912fabc99_story.html
Holland Tunnel Sandy Repairs and Resiliency Improvements. (n.d.). Retrieved from https://www.panynj.gov/bridges-tunnels/en/holland-tunnel.html
Hughes, J. F. (James F.., & Healy, K. (2014). Measuring the resilience of transport infrastructure. Retrieved from https://www.nzta.govt.nz/assets/resources/research/reports/546/docs/546.pdf
Illinois State Freight Plan. (2018). https://doi.org/10.1017/CBO9781107415324.004
INFRASTRUCTURE EVIDENCE BASE 2015 Refresh. (2015). Retrieved from https://www.treasury.govt.nz/sites/default/files/2017-12/2015-nip-evidence-overview.pdf
International infrastructure management manual. (2006). Retrieved from https://openlibrary.org/books/OL21245688M/International_infrastructure_management_manual.
Iowa Assists Pork Producers. (2020). Retrieved from Iowa Department of Agriculture and Land Stewardship website: https://iowaagriculture.gov/news/idals-assists-pork-producers-impactedplant-closures
Iowa State Freight Plan. (2017).
Jones, C. (2017). Transportation Planning in an Era of Inequality and Climate Change. In Fordham Urban Law Journal (Vol. 44).
Kaplan, H. T. and S. (2017). 2017 Hazards in Houston’s Floodwaters. Retrieved from The New York Times website: https://www.nytimes.com/2017/08/31/us/houston-contaminated-floodwaters.html?mcubz=3
Kishore, N., Marqués, D., Mahmud, A., Kiang, M. V., Rodriguez, I., Fuller, A., … Buckee, C. O. (2018). Mortality in Puerto Rico after Hurricane Maria. New England Journal of Medicine, 379(2), 162–170. https://doi.org/10.1056/NEJMsa1803972
Lazkani, S. (2020). Here Are The 36 Countries That Are Helping Lebanon Recover from The Blast. Retrieved October 26, 2020, from https://www.the961.com/35-countries-helping-lebanon-recover/
Lazo, L. (2017). Air traffic slowly returns to Puerto Rico, but dire conditions continue after Maria. Retrieved from The Washington Post website: https://www.washingtonpost.com/news/dr-gridlock/wp/2017/09/25/air-traffic-slowly-returns-to-puerto-rico-but-dire-conditions-continueafter-maria/?noredirect=on
Lindsay, B. R., & Webster, E. M. (2019). FEMA and SBA disaster assistance for individuals and households: Application processes, determinations, and appeals. In Key Congressional Reports.
Litman, T. (2005). Evaluating Transportation Equity: Guidance for Incorporating Distributional Impacts in Transportation Planning. Victoria Transport Policy Institute, Victoria, British Columbia, 8(2), 50–65. Retrieved from http://scholar.google.com/scholar?hl=en&btnG=Search&q=intitle:Evaluating+Transportation+Equity+Guidance+For+Incorporating+Distributional+Impacts+in+Transportation+Planning+by#2
Litman, T. (2006). Lessons from Katrina and Rita: What major disasters can teach transportation planners. Journal of Transportation Engineering, 132(1), 11–18. https://doi.org/10.1061/(ASCE)0733-947X(2006)132:1(11)
Local Hazard Mitigation Planning. (n.d.). Retrieved from https://www.fema.gov/media-library-data/1468272301025-eed10d9ec0d7bfb537ad18c036870637/Local_Hazard_Mitigation_Planning_Fact_Sheet_Final_508.pdf
Lundgren, R. E., & McMakin, A. H. (2018). Risk Communication: A Handbook for Communicating Environmental, Safety, and Health Risks. https://doi.org/10.1093/occmed/kqv085
Lyons, T., and Choi, D. (2020). Transit Economic Equity Index: Developing a Comprehensive Measure of Transit Service Equity. Transportation Research Record: Journal of the Transportation Research Board, No. 2675, pp. 288-300. https://doi.org/10.1177/0361198120970529.
Meat Industry in Midwest. (2020). Retrieved September 16, 2020, from nwitimes website: https://www.nwitimes.com/news/watch-now-meat-industry-butchered-by-covid-19-in-the-midwest/article_bae39958-d20b-58df-ad57-9f1094eeae52.html
Mohammad Behnam, Marc Chelala, Tony Gambell, and M. T. G. (2020). Meeting the demand surge caused by COVID-19. Retrieved September 15, 2020, from mckinsey website: https://www.mckinsey.com/industries/pharmaceuticals-and-medical-products/our-insights/medtechs-call-to-action-meeting-the-demand-surge-caused-by-covid-19
Morello-Frosch, R., Brown, P., Lyson, M., Cohen, A., & Krupa, K. (2011). Community voice, vision, and resilience in post-Hurricane Katrina recovery. Environmental Justice, 4(1), 71–80. https://doi.org/10.1089/env.2010.0029
Mostajabdaveh, M., Gutjahr, W. J., & Sibel Salman, F. (2019). Inequity-averse shelter location for disaster preparedness. IISE Transactions, 51(8), 809–829. https://doi.org/10.1080/24725854.2018.1496372
Nadesan, M. H. (2008). Hurricane Katrina: Governmentality, Risk, and Responsibility. Controversia, 6(1), 67–90. Retrieved from http://libraryproxy.uwp.edu:2048/login?url=http://search.ebscohost.com/login.aspx?direct=true&db=ufh&AN=36160414&loginpage=login.asp&site=ehost-live&scope=site
National Disaster Recovery Framework (Second Edition). (n.d.). https://doi.org/10.1177/002205741508201208
NOAA & NHC. (2018). Hazards in Houston’s Floodwaters. In NOAA Technical Memorandum NWS NHC6. Retrieved from https://www.nhc.noaa.gov/pdf/nws-nhc-6.pdf%0Ahttps://www.nhc.noaa.gov/news/UpdatedCostliest.pdf%0Ahttps://www.nhc.noaa.gov/pdf/nws-nhc-6.pdf%0Ahttps://www.nhc.noaa.gov/dcmi.shtml
Novakovic, A. (2020). Amidst COVID-19, transportation disruptions pose biggest threat to food supp. Retrieved from Cornell University website: https://news.cornell.edu/media-relations/tip-sheets/amidst-covid-19-transportation-disruptions-pose-biggest-threat-food
OHCHR | Puerto Rico: Human rights concerns mount in absence of adequate emergency response. (n.d.). Retrieved October 27, 2020, from https://www.ohchr.org/EN/NewsEvents/Pages/DisplayNews.aspx?NewsID=22326&LangID=E
Ongoing Recovery in Puerto Rico: Charity Navigator. (n.d.). Retrieved October 26, 2020, from https://www.charitynavigator.org/index.cfm?bay=content.view&cpid=5356
Org, I., & Puerto-Rico, /. (2019). American Society of Civil Engineers Puerto Rico Section.
Overview of Federal Efforts to Prepare for and Respond to Hurricane Maria | Homeland Security. (n.d.). Retrieved October 22, 2020, from 2017 website: https://www.dhs.gov/blog/2017/09/29/overview-federal-efforts-prepare-and-respondhurricane-maria
P.J. Huffstutter. (2020). U.S. dairy farmers dump milk as pandemic upends food markets. Retrieved from World Economic Forum website: https://www.weforum.org/agenda/2020/04/dairy-milk-pandemic-supply-chains-coronavirus-covid19-pandemic/
Palin, P. J., Hanson, L. S., Barton, D., & Frohwein, A. (2018). Supply Chain Resilience and the 2017 Hurricane Season. CNA Analysis & Solutions, (October), 14–46.
Park, J., Seager, T. P., Rao, P. S. C., Convertino, M., & Linkov, I. (2013). Integrating risk and resilience approaches to catastrophe management in engineering systems. Risk Analysis, 33(3), 356–367. https://doi.org/10.1111/j.1539-6924.2012.01885.x
Parsons Brinckerhoff, E. P. Chait, and Cambridge Systematics, Inc. (2008). NCHRP Report 608: GASB 34—Methods for Condition Assessment and Preservation. Transportation Research Board of the National Academies, Washington, DC.
Port Authority to Undertake Major Overhaul of Two PATH Tunnels Damaged by Superstorm Sandy in 2012. (2016). Retrieved from https://www.panynj.gov/port-authority/en/press-room/pressrelease-archives/2016_press_releases/port_authority_toundertakemajoroverhauloftwopathtunnelsdamagedby.html
Petit, F., D. Verner, and L. Levy. (2017). Regional Resiliency Assessment Program Dependency Analysis Framework. Argonne National Laboratory. Lemont, IL.
PRHTA. (2018). Final Fiscal Plan 2018 - 2023. Retrieved from https://www.aafaf.pr.gov/assets/prhta-fiscal-plan---2018-04-05-vpublic.pdf
Puerto Rico a year after Hurricane Maria | Amnesty International. (n.d.). Retrieved October 22, 2020, from https://www.amnesty.org/en/latest/research/2018/09/puerto-rico-a-year-after-hurricane-maria/
PUERTO RICO DISASTER RECOVERY FEMA Actions Needed to Strengthen Project Cost Estimation and Awareness of Program Guidance Report to Congressional Requesters United States Government Accountability Office. (2020).
Puget Sound Regional Council. (n.d.). Retrieved from https://www.psrc.org/
Rawls, C. G., & Turnquist, M. A. (2010). Pre-positioning of emergency supplies for disaster response. Transportation Research Part B: Methodological, 44(4), 521–534. https://doi.org/10.1016/j.trb.2009.08.003
Representatives-Florida, H. of. (2018). Hurricane response & preparedness.
Resilience Quick Guide: Incorporating Resilience in the MPO Long Range Transportation Plan. (2020). Retrieved from http://floridatransportationplan.com/pdf/2020-01-29_FDOTResilienceQuickStartGuide_FINAL.pdf
Resilient and Sustainable Transportation Systems Technical Assistance Program. (n.d.). Retrieved from AASHTO Center for Environmental Excellence website: https://environment.transportation.org/center/rsts/state_by_state_listing.aspx
Resilient Tampa Bay. (n.d.). Retrieved from http://www.tbrpc.org/resilient-tampa-bay/
Reverón-Collazo, W. E. (n.d.). THE INTERNATIONAL RESPONSE TO THE HURRICANE AND PUERTO RICO’S ROLE IN THE GLOBAL ENVIRONMENT. Retrieved from http://www.ohchr.org/EN/NewsEvents/Pages/DisplayNews.aspx?NewsID=22326&
Rinaldi, S. M., J. P. Peerenboom, and T. K. Kelly. (2001). Identifying, Understanding, and Analyzing Critical Infrastructure Interdependencies. IEEE Control Systems Magazine, Vol. 21, No. 6, pp. 11–25. doi: 10.1109/37.969131.
Risk management — Guidelines. (2018). Retrieved from https://www.iso.org/standard/65694.html
Risk management practice guide. (2018). Retrieved from https://www.nzta.govt.nz/resources/minimum-standard-z-44-risk-management/
Rufat, S., Tate, E., Emrich, C. T., & Antolini, F. (2019). How Valid Are Social Vulnerability Models? Annals of the American Association of Geographers, 0(0), 1–23. https://doi.org/10.1080/24694452.2018.1535887
Sanchez, T. W., & Brenman, M. (2008). Transportation Equity and Environmental Justice: Lessons from Hurricane Katrina. Environmental Justice, 1(2), 73–80. https://doi.org/10.1089/env.2008.0510
Scenario Planning Toolkit. (n.d.). Retrieved from https://ctl.mit.edu/scenario-planning-toolkit
Schleifstein, M., & McQuaid, J. (2002). The big one. Retrieved from https://www.nola.com/
Singh, B. M. (2020). Shortage of Truck Drivers Looms Large. Retrieved September 15, 2020, from https://www.marketplace.org/2020/04/10/pandemic-worsening-big-rig-truck-driver-shortage/
Smith, C. (2018). Technical Memorandum: Risk Assessment on SIS Facilities. Retrieved from https://fdotwww.blob.core.windows.net/sitefinity/docs/default-source/planning/policy/metrosupport/resources/lrtp-needs-plan-guidelines(final).pdf?sfvrsn=a52adac6_0
Snowdon, D. (2011). Risk and resilience. Retrieved from www.youtube.com/watch?v=2Hhu0ihG3kY
Spread of COVID-19 Within the United States. (2020). Retrieved September 15, 2020, from Center of Disease and Prevention website: https://www.cdc.gov/mmwr/volumes/69/wr/mm6922e1.htm
Susman, M., & Monahan, R. (2016). Planning framework for a climate-resilient economy. Retrieved from https://www.epa.gov/sites/production/files/2016-05/documents/planning-framework-climate-resilient-economy-508.pdf
Sutter, J. D. (2018). Deaths from bacterial disease in Puerto Rico spiked after Maria. Retrieved from CNN website: https://www.cnn.com/2018/07/03/health/sutter-leptospirosis-outbreak-puerto-rico-invs/index.html
Swanstrom, T. (2008). Regional resilience: A critical examination of the ecological framework. IURD Working Paper Series, Institute of Urban and Regional Development, UC Berkeley, 1–33.
The effect of precautionary buying. (2020). Retrieved from everydaymatters website: https://everydaymatters.rpi.edu/the-effects-of-precautionary-buying/#.X2IS3mhKi70
The United States Meat Industry at a Glance. (2017). Retrieved from https://www.meatinstitute.org/index.php?ht=d/sp/i/47465/pid/47465
Tonnage of Top 50 U.S. Water Ports, Ranked by Total Tons. (n.d.). Retrieved from https://www.bts.dot.gov/content/tonnage-top-50-us-water-ports-ranked-total-tons
Tools that can be Used in Climate Change Vulnerability Assessments. (2018). Retrieved from https://cdn.atlantaregional.org/wp-content/uploads/tools-report-final.pdf
Trapani, M. (2020). U.S. food system. https://doi.org/10.1016/0306-9192(79)90019-8
U.S. Geological Survey Digital Data Series DDS-29. (n.d.). Retrieved from https://pubs.usgs.gov/dds/dds-29/slideshow.pdf
UNGKU, F., & KAPOOR, K. (2018). Up to 20 countries helping in tsunami-struck Indonesia. Retrieved October 26, 2020, from https://www.businesslive.co.za/bd/world/2018-10-04-up-to-20-countries-helping-in-tsunami-struck-indonesia/
Vajjhala, S. (2017). Finance Guide for Resilient by Design Bary Area Challenge Teams. In Resilient Bay Area. Retrieved from http://www.resilientbayarea.org/s/Vajjhala-Financing-the-Future-of-Resilient-by-Design-071918-1-1.pdf
WASHINGTON STATE’s BRIDGE SEISMIC RETROFIT PROGRAM. (n.d.). Retrieved from https://www.wsdot.wa.gov/eesc/bridge/preservation/pdf%5CBrgSeismicPaper.pdf
Weilant, S., Strong, A., & Miller, B. M. (2019). Incorporating Resilience into Transportation Planning and Assessment. Retrieved from www.rand.org/giving/contribute
Wes Mills, C. M. (2020). CoronaVirusImpct- Indiana Manufacturing. Retrieved from insideindianabusiness website: https://www.insideindianabusiness.com/story/41840400/coronavirus-potential-impact-onindiana-manufacturing
Willison, C. E., Singer, P. M., Creary, M. S., & Greer, S. L. (2019). Quantifying inequities in U.S. federal response to hurricane disaster in Texas and Florida compared with Puerto Rico. BMJ Global Health, 4(1), 1–6. https://doi.org/10.1136/bmjgh-2018-001191
Wisconsin State Freight Plan. (2018).
Wolshon, B. (2002). Planning for the Evacuation of New Orleans. Institute of Transportation Engineers. ITE Journal, 72(2), 44.
Wolshon, B., Catarella-Michel, A., & Lambert, L. (2006). Louisiana Highway Evacuation Plan for Hurricane Katrina: Proactive management of a regional evacuation. Journal of Transportation Engineering, 132(1), 1–10. https://doi.org/10.1061/(ASCE)0733-947X(2006)132:1(1)
Wong, A. (2019). Strategies to Advance Investments in Coastal Resilience Solutions in Boston (MASSACHUSETTS INSTITUTE OF TECHNOLOGY). Retrieved from https://hdl.handle.net/1721.1/123914
World-Health-Organization. (2020). COVID-19 Supply Chain System: Requesting and Receiving Supplies. In Health Emergencies Programme. Retrieved from https://www.who.int/emergencies/diseases/novel-coronavirus-2019?gclid=Cj0KCQjwhIP6BRCMARIsALu9LflGlfpyKhaAgXXf7ymHpwDSyQEZjQd2wCiDKvc96_odDN9CzqMizy8aAqxfEALw_wcB
XDI Sydney Project: Building climate resilience across critical infrastructure. (2019). Retrieved from https://xdi.systems/wp-content/uploads/2019/05/XDI_Sydney-A3toA4__singlepages.pdf
Zech, A. (2018). FEMA 2017 Hurricane Season After-Action Report - Homeland Security Digital Library. Retrieved October 19, 2020, from https://www.hsdl.org/c/fema-2017-hurricane-season-after-action-report/
Zorn, C. R., & Shamseldin, A. Y. (2016). Quantifying directional dependencies from infrastructure restoration data. Earthquake Spectra, 32(3), 1363–1381. https://doi.org/10.1193/013015EQS015M
Zorn, C., Thacker, S., Pant, R., & Shamseldin, A. (2017). VULNERABILITY OF NATIONAL INTERDEPENDENT INFRASTRUCTURE NETWORKS TO SPATIALLY.
Zorn, Conrad, Davies, A., Robinson, T., Pant, R., Wotherspoon, L., & Thacker, S. (2018). Infrastructure Failures and Recovery from an Alpine Fault Earthquake Scenario. 16th European Conference on Earthquake Engineering, 1–12.
Zorn, Conrad, Pant, R., Thacker, S., & Shamseldin, A. Y. (2020). Evaluating the magnitude and spatial extent of disruptions across interdependent national infrastructure networks. ASCE-ASME Journal of Risk and Uncertainty in Engineering Systems, Part B: Mechanical Engineering, 6(2). https://doi.org/10.1115/1.4046327
Zorrilla, C. D. (2017). The view from Puerto Rico: Hurricane Maria and its aftermath. The New England Journal of Medicine, 377, 1801–1803. Retrieved from 10.1056/NEJMp1713196


