Resilience in Transportation Networks, Volume 1: Resilience Case Studies (2024)
Chapter: Section 1: Background and Synthesis
Section 1: Background and Synthesis
Organization of Report
The case study synthesis report is organized into three sections. Section 1 contains the synthesis discussion. The section is further broken down into four major themes that permeated the case studies: resolution of focus, interdependencies and cascading effects, multimodal systems, and community and economic resilience. Section 2 contains abstracts for each case study, and Section 3 includes the case studies themselves.
The purpose of this organization is out of consideration for the reader of such an extensive report. Readers may choose to read the report in its entirety or select the sections that are of specific interest to them. Section 1, the synthesis, references individual case studies within the context of the four major themes. The cases referenced in Section 1 are numbered, facilitating easy reference to the abstracts and case studies. Abstracts are included so the Panel can conduct a quick review of the cases and then if desired, read the entire case study. The intention is for the information to be easily accessible, from general to specific.
Case Synthesis
Resolution of Analysis/Focus
This report’s case studies show various experiences highlighting frameworks, tools, methods, and data needs. Increasing the resilience of transportation networks affects transportation operations and many other networks and systems. For example, the transportation network is the backbone of supply chains that produce, transport, and deliver critical products. Understanding that transportation networks affect and are affected by other networks and systems is essential. Particular challenges appear as a common theme in most of the case studies: (1) the need for a unified and structured framework for the problem of resilience in transportation networks, (2) the identification of data-enabled methods and metrics, and (3) the need for accurate, time-sensitive data suitable to make decisions. These needs aligned with the traditional approach, which considers frameworks at a strategic level, methods for tactical considerations, and data for operational needs.
Figure 1 organizes the case studies into these categories: framework, methods, and data needs. Some case studies are placed into more than one category as they may touch on more than one relevant level of analysis. Altogether, the case studies provide evidence of successful and unsuccessful implementations, response operations, potential threats, and features to enhance current and future practices at all levels of analysis:
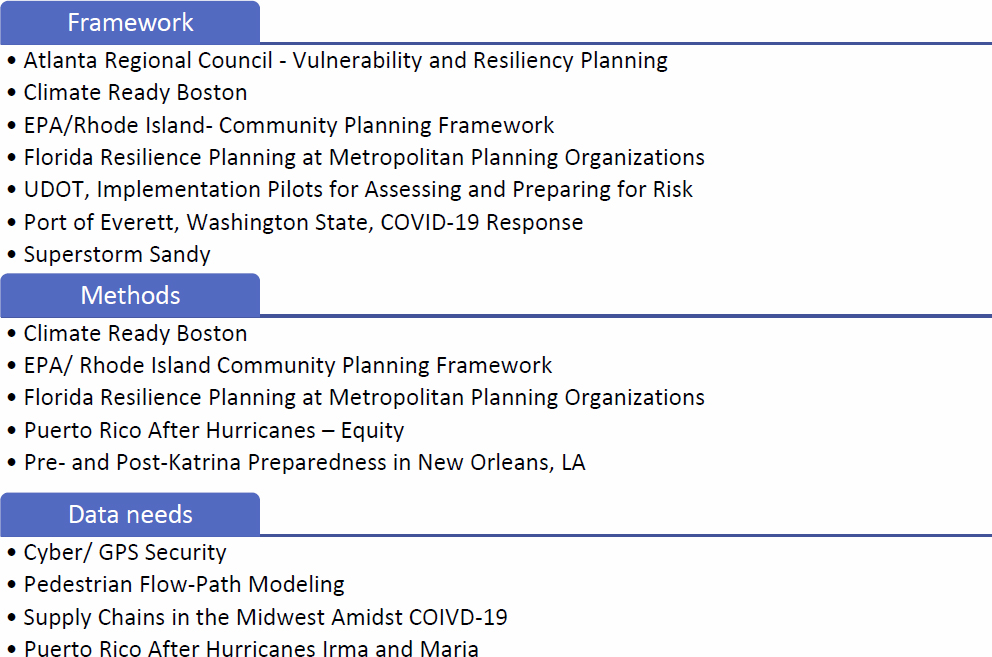
Framework
A framework identifies the overarching goal. It needs to include a problem statement and critical questions to answer. More importantly, the framework breaks down the fundamental problem into several attainable subproblems. Subproblems can be identified as the objectives. Carrying out the set of objectives will enable the achievement of the framework’s goal. One of the ways to evaluate the completion or successful implementation of the objectives is by establishing metrics since “you can’t manage what you can’t measure.” A framework is, therefore, a high-level platform that delivers at least the following three components, a goal, objectives, and metrics.
Framework Goal: The goal refers to the overarching aim of a project, activity, or set of activities. The goal must be simple enough that all members of the organization understand the subordinate objectives’ direction, vision, and purpose. The Atlanta Regional Council and Climate Ready Boston case studies offer insight regarding identifying goals, and the UDOT case study also establishes such goals and adds the methodology. The Port of Everett case study shows clear roles and metrics to establish a framework for business continuity.
Objectives: While a goal is a more general statement of a project, the objectives seek to ground the subject more precisely. The set of objectives reflects what needs to be accomplished to reach the goal. While some of the objectives might be independent, there is the possibility that different objectives may inform each other. Moreover, the output of a specific objective might be the input required to execute another objective. For example, such is the case of consecutive objectives in time. The case of Super Storm Sandy shows a lack of consecutive objectives that can direct the
response and recovery efforts. A similar situation was experienced in response to Hurricane Maria in Puerto Rico. This report addresses the response to Hurricane Maria concerning the response and related issues of equity.
Metrics: Establishing metrics is important from a planning perspective, as well as evaluating the response to disruptions. The purpose of establishing metrics is to be able to measure the level of success or failure of each of the objectives. There is inherent complexity when identifying metrics for increasing resilience because successful resilience plans will effectively mitigate negative impacts, making it impossible to measure the difference between any worst-case scenario and what actually occurred. However, establishing metrics is an unquestionably important implementation piece. The case study addressing equity in Puerto Rico shows dramatic discrepancies between the response to hurricanes in Texas, Florida, and Puerto Rico.
Methods
While the framework establishes the goal, objectives, and metrics of plans, regional planning approaches require tools and methods (e.g., simulation, risk-based scenarios) at a lower level of resolution. Once the overall goal and individual objectives are recognized, it is necessary to understand how these objectives will be accomplished. For example, Climate Ready Boston and EPA/Rhode Island are two case studies highlighting the need to address climate change challenges. Climate Ready Boston’s method included congregating experts and technical knowledge to direct investments over the next 20 years to increase resilience in the Boston Metropolitan Area.
Data Needs
The lowest and probably most challenging level of resolution is data needs. Experience in disaster response has shown that some critical data is always lost in the process. The urgent pace and nature of emergency response activities often make data collection an understandably secondary activity. However, this is why collecting the “right data” in the “right format” is so important. The case studies demonstrate that data collection is much more than a reporting exercise when informing the framework and methods.
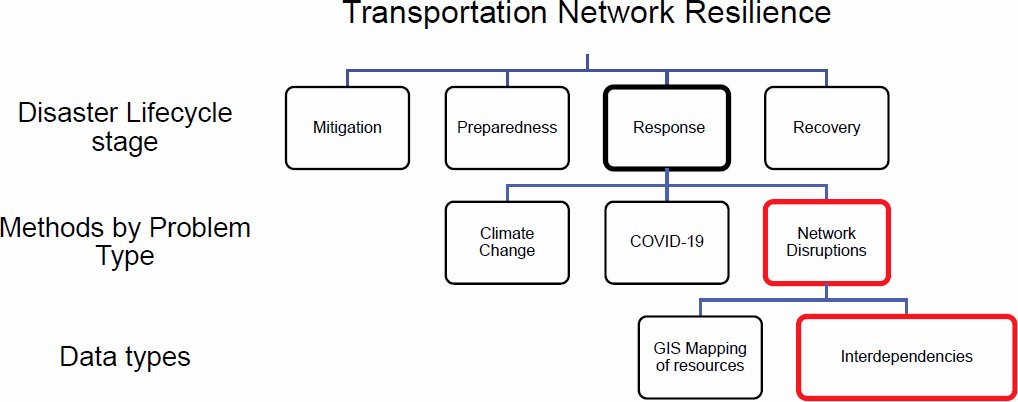
It is also important to highlight that developing tools, methods, and data to increase transportation network resilience will affect all four stages of the emergency management cycle. The case studies presented in this report contribute to understanding the different stages by showing unique examples of functionality. It is imperative to recognize the framework’s purpose in the context of these four stages: mitigation, preparedness, response, and recovery (see Figure 2).
Interdependencies and Cascading Effects
The concepts of interdependencies and cascading effects have been a central concern of the NCHRP Project 20-125 research effort. In the AWP, the concepts were organized around primary, secondary, and tertiary effects, which were a core element in the organization of the Task 3B (response) case studies. In this regard, it was unsurprising that these concepts would permeate contemporary risk and resilience literature. Nevertheless, most of the literature focused on after-action reviews of event response and recovery efforts, explaining how an event affected infrastructure systems, community and social cohesion, and economic systems. However, several case studies illustrated how the concepts of interdependency and cascading effects could be used to organize preparedness and response planning, as well as improve strategies for medium and long-term recovery efforts. It also became apparent that the concept of interdependency can be applied at both the tactical and strategic levels.
The Florida DOT (FDOT) Resilience Planning Quick Start Guide (Florida Resilience Planning..., Case 3A.5) is a compelling example of a process appropriate for a strategic discussion of interdependencies and cascading effects. FDOT created the quick start guide on behalf of its metropolitan planning organization (MPO) partners as part of efforts to incorporate resilience into long-range transportation plans. FDOT staff and one of their MPO partners commented on how complex this undertaking is. The state has 23 MPOs and numerous federal, state, and local government agencies charged with various aspects of the resilience cycle. While there is a lot of enthusiasm and support for the effort, it was acknowledged that coordination at this level possesses numerous challenges. For instance, it has not been sufficiently clarified how incorporating resilience in the planning process will translate into projects advanced through the project development process. Data sharing and project prioritization are difficult under any circumstances. However, it can be especially daunting with so many partners that use distinct processes, their own data, and have different fundamental assumptions.
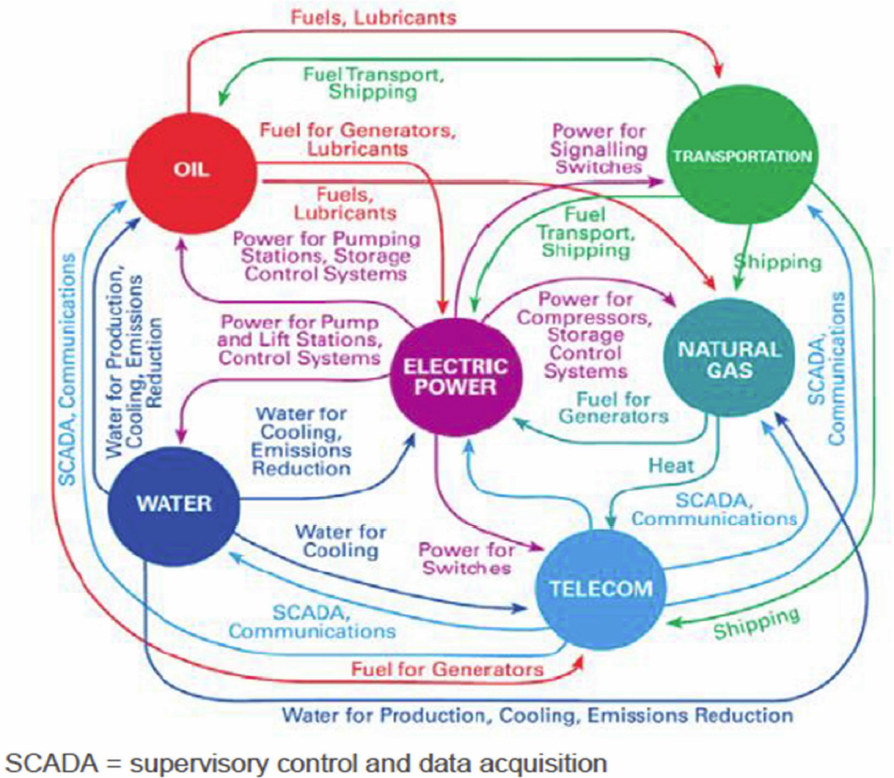
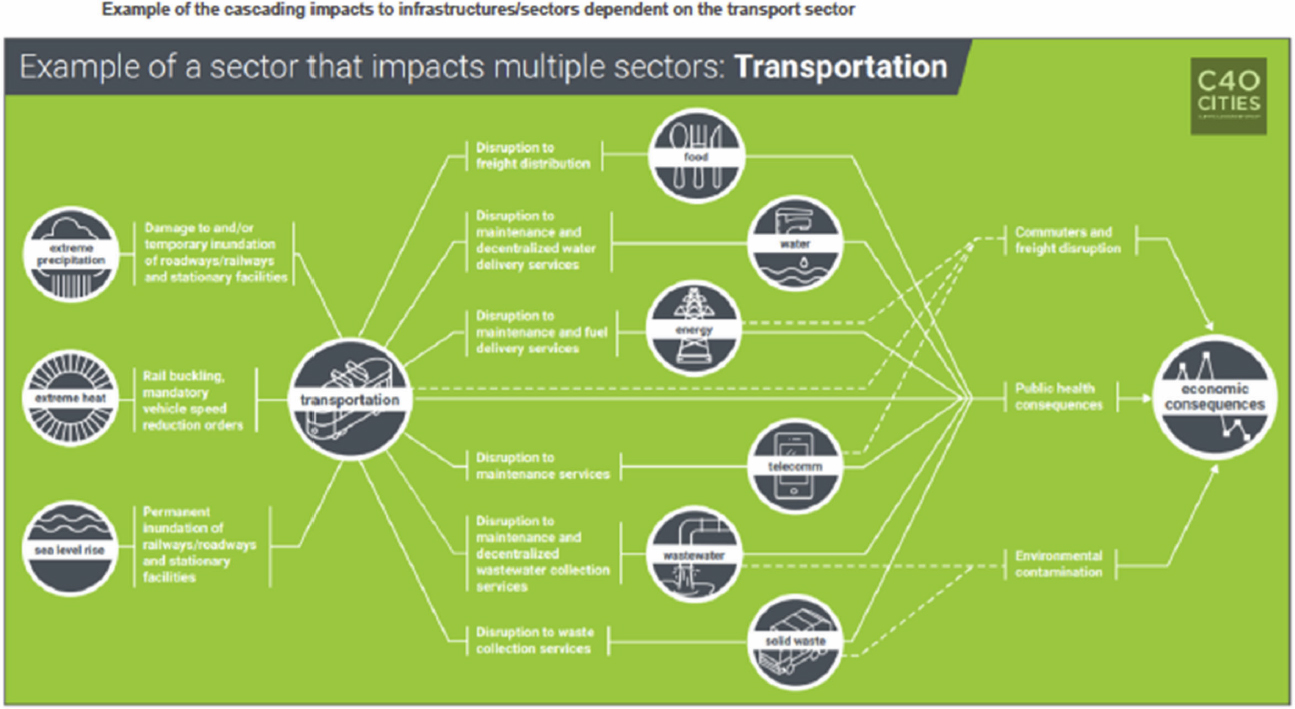
Long-range planning is the beginning of the DOT project development workflow. In many cases, an agency’s strategic direction is established in this process. DOTs rely heavily on their MPO partners for comprehensive, well-thought-out regional transportation plans. Because of this, DOTs and MPOs need to have a systemic view of the world. The long-range planning process is ideal for assessing systems-to-systems interdependencies and beginning to think through how disruptive events might cascade through infrastructure systems, communities, and economies. Figure 3 is a graphic representation of systems-to-systems interdependencies, and Figure 4 represents the potential downstream impact of a disruption to the transportation network.
Integrating risk and resilience analyses in long-range planning processes will lead to more awareness and a better understanding of the complex nature of infrastructure dependencies and interdependencies. Communicating this increased understanding with agencies responsible for other aspects of the resilience cycle has the potential to improve event response and recovery efforts. The New Zealand Transport Agency (NZTA) envisioned this type of coordination and communication when they established an interdependency organizational typology. This typology is one of four organizational typologies, the others being physical, digital, and geographic, developed as part of a research effort the agency commissioned to help develop policy options for an asset-based risk management program (Asset-Based Risk Management, Case 3A.10). Coordinating and planning between all agencies that participate in the resilience cycle (preparedness planning, recovery, and response) is a strategic level activity.
When assessing previous disruptive events, it is unclear whether the concepts of interdependencies and cascading effects had yet permeated preparedness and response planning. In the case of Katrina, it has been demonstrated there was knowledge of the limitations of vulnerable populations to evacuate in the region’s automobile-dominated response plans and that the same vulnerable population tended to live in the lower-lying areas of New Orleans. Yet that knowledge was not used to refine the area’s evacuation and response planning. This information is an example of the types of knowledge that, if known in advance by agencies responsible for resilience planning, can be incorporated into early planning efforts to prevent and mitigate negative impacts. A greater understanding of global supply chain interdependencies likely would have reduced or prevented some of the disruptions caused by the COVID-19 pandemic; however, we did not know what we did not know. Increasing uncertainty caused by global warming, regional instabilities, pandemics, and other future unknowns suggests such analyses, while complex, are warranted. Figure 5 illustrates the relationship between a tactical approach and a
strategic approach to assessing interdependencies and possible cascading effects. It also shows that the concepts of interdependencies and cascading effects can also be used at the tactical level.
The asset-based risk management case mentioned above demonstrates these concepts’ use to assess a transportation asset’s criticality on other lifeline infrastructures and critical care uses. Criticality, in this case, is a proxy for consequence in the risk assessment equation: Risk = Consequence x Threat. Figures 6 and 7 exemplify how the NZTA developed a criticality score. Figure 6 shows the modified criticality asset scope when considering downstream impacts, while Figure 7 shows the criticality score for assets without considering downstream impacts.


Interestingly, the NZTA research effort distinguished between risk/mitigation approaches and resilience approaches. The distinguishing features rested on the difference between mitigating identified assets against specific threats (a risk/mitigation approach) and investing in overall systems to withstand difficult-to-quantify or as-yet-to-be-determined threats like climate change or pandemics (a resilience approach). This difference is an important distinction that should be considered in the guidance document so agencies can consider the implications when developing approaches to incorporate resilience in their transportation networks.
Multimodal Network Resilience
Multimodal transportation network resilience is at the pinnacle of today’s commercial supply chains. Local, regional, national, and international supply chains, such as the ones described in our case studies COVID-19 Regional Response and COVID-19 Food Supply Chain Disruptions, need multiple
transportation modes to connect production with consumption points. Although the landscape of international supply chains has changed due to COVID, the economies of scale, efficiencies, and logistical capacity produced by multimodal transportation networks are unlikely to be abandoned.
Ensuring an adequate level of resilience in such networks is no simple task. First, a framework addressing multimodal transportation networks should have overarching goals and metrics that go beyond the operation of individual pieces of infrastructure and operation. This framework requires a systems perspective rather than a local design. For example, in the responses to Hurricanes Irma and Maria in Puerto Rico, the reopening of ports was only marginally beneficial due to operational difficulties and the inflexibility of port policies. In that specific case study, the metrics should have incorporated the entire supply chain process (i.e., flow of products, information, and, when needed, funds).
The metrics that address specific segments of a supply chain need to be aligned with the goal of logistics efficiency and resilience. For example, in the case study on the Port of Everett, the quick recovery and business continuity were due to plans, preparation, and operations flexibility. However, the port is one in a series of interconnected links that facilitate freight movement. To some extent, what happens in the links before and after the port is often viewed as out of the scope of their operation. However, from a multimodal transportation networks resilience perspective, they are not because implementing plans in business continuity up and downstream of the supply chain will increase the system’s overall resilience. This observation reinforces a key consideration for multimodal transportation networks: systems or global perspective versus local optimization of resilience.
Finally, it is important to highlight the need to identify critical facilities, operations, and policies in a multimodal transportation network context. At a local, more granular level of analysis, individual links or levels of supply chains might be evaluated with medium or even low criticality. However, they could be critical in the overall supply chain system. In the case study addressing COVID-19 in the U.S. Midwest, the packaging and labeling of dairy products became a choke point in supply chains. FDA regulations prohibit the commercialization of products, particularly dairy, without labels. This situation forced producers to dump their product to alleviate the excess supply. In this case, the imbalance between excess supply and lower capacity to process the product infringed on the operation of multimodal supply chains.
Economic and Community Resilience
Infrastructure is crucial to vibrant and healthy communities. It facilitates the movement of people, goods, and information. Infrastructure supports community cohesion and access to services at a fundamental level and is essential to social well-being. Therefore, it is vital to integrate resilience into our infrastructure systems. Doing so increases the ability of communities to withstand the impacts of disruptive events, improve response performance during disruptions, and recover more quickly.
Business Continuity
Business continuity was among the themes revealed by the literature review of Task 2 and again in the case studies developed for Task 3. There are multiple approaches to improving business resilience. The literature was replete with examples ranging from a specific focus on supply chain resilience to broader approaches addressing community resilience as a whole. Until the first quarter of 2020, discussions of business continuity typically surrounded extreme weather, cybersecurity, and
geopolitical events. The COVID-19 pandemic has broadened those discussions regarding event types, global scale, and the long-term nature of events. Short of global warfare, COVID-19 has had the most extreme impact on business continuity that has extended from the local to the international level. As part of this research effort, a white paper was produced (COVID-19- A Regional Response to a Global Health Pandemic, Case 3AB.3) on the distribution of personal protective equipment in relation to COVID-19 global supply chain issues. An evaluation was also done of the impact on midwestern supply chains (Supply Chains in the Midwest Amid COVID-19, Case 3B.1) resulting from COVID-19, emphasizing the local to global effects of the pandemic on supply chains.
There is growing awareness and acceptance from many community and business leaders and the public about the risks associated with increasing uncertainty and climate change. Yet it can be challenging to translate an intellectual understanding into a visceral understanding that inspires urgency and action. Part of the problem lies in translating threats into bottom-line return on investment. Many DOTs don’t have the resources to address the elements of their mandates, mobility, and preservation. It is then a significant hurdle to motivate DOTs to address a topic that only promises to increase expenditures in the short run. Infrastructure is a long-term investment that requires patience. Given the often-short-term focus of politics and public opinion, this is a significant challenge that requires a solution. There are examples of state and local communities that have overcome a short-term focus on transportation investment. One such example, although not directly related to resilience, is the state of Utah. Utah’s Unified Planning Process is a strong example of successfully building political, business, and public support for investment in transportation infrastructure. While it took decades of concerted effort, the transportation agencies and business community effectively made the business case for why the state and local governments should invest in transportation infrastructure. At the time of this report, Utah commits approximately 17% of state sales tax revenues (~$750M annually), despite the effects of the COVID-19 pandemic, to support transportation investment. Additionally, three years ago, that state passed an indexed gas tax increase, supplementing its federal funds, to fully fund the state’s roadway preservation needs. The argument for funding can be made, but it needs to be a coordinated and systematic approach that includes the business community.
Another example is the Louisiana Supply Chain & Transportation Council (SCTC), addressed in this report in Case 3A.6. After significant flooding in March and August of 2016, FEMA activated the National Disaster Recovery Framework (NDRF). Under the NDRF’s Economic Recovery Support Function (ERSF), the Louisiana Economic Development and the U.S. Economic Development Administrations identified supply chain and commercial transportation disruptions as a recovery issue. They recommended establishing a supply chain network to engage business and agriculture

interest in support of transportation resilience and enhanced transportation systems. This effort had the support of Louisiana executive and legislative branches of government, numerous supply and trade associations, and universities. Figure 8 illustrates the organization of the SCTC. A counterpoint to the Louisiana case study is a case study developed for an effort by the Environmental Protection Agency (EPA), Rhode Island, and the community of North Kingstown. They developed, tested, and refined a Planning Framework for a Climate-Resilient Economy (EPA/Rhode Island- Community Planning Framework, Case 3A.4). The effort ultimately failed to garner local government support and was not implemented. However, the designed framework is well done and can serve as an instructive tool, and the case study provides valuable lessons for informing the final products of this research effort.
Community Resilience
The topic of community resilience inevitably engenders a discussion of ecological resilience. Resilience in this context means the sustainability of human and natural systems. Ecological resilience refers to the level of impact an ecosystem can withstand without long-term degradation, making the two concepts inexorably tied. However, community resilience is often understood as the ability of a system to absorb and recover from a disruptive event. Community resilience apparently involves much more than infrastructure hardening when considering human systems. Equity is one of the most significant of these broader issues in assessing community resilience. Two case studies were conducted involving events where a lack of consideration, or perhaps even disregarding of the needs of vulnerable populations, negatively affected preparedness, emergency response, and medium and long-term recovery efforts. The two case studies examined the responses to hurricanes Katrina, Maria, and Irma and their effects on New Orleans and Puerto Rico, respectively (Puerto Rico After Hurricanes, Case 3B4; Pre- and Post-Hurricane Katrina, Case 3AB.2).
In the case of Hurricane Katrina, there was a blatant disregard for the vulnerable populations of New Orleans in preparing hurricane evacuation plans and in post-event response planning. In the case of Puerto Rico, vulnerabilities were characterized as a wide range of socioeconomic, demographic, and environmental conditions that contribute to equity. These include but are not limited to race, education, income, occupation, age, disability, and language proficiency. Some authors suggest that social vulnerabilities vary across different regions and may have compounded effects. For instance, one region might be vulnerable because of race, and another might be vulnerable because of poverty and mobile housing. In contrast, another region may contain populations with all the mentioned vulnerabilities. This recognition is significant because agencies responsible for aspects of the resilience cycle can better understand the specific needs of various vulnerable populations and prepare equitable preparedness and response plans.
Several case studies also demonstrated how communities are addressing community resilience concerning broader issues other than equity. Two such cases are an examination of Climate Ready Boston (Case 3A.2) and a study of Atlanta Regional Council - Vulnerability and Resiliency Planning (Case 3A.1). Both subjects evaluated long-term risks and developed plans to mitigate those risks. These cases are excellent examples of the type of analyses necessary to start building the business case for a comprehensive resilience program. These cases, along with the Louisiana Supply Chain case, provide excellent examples of tools that states, and regions have used to implement risk and resilience-based programs and ultimately improve the resilience of the transportation network.
Table 1: TABLE OF CASE STUDIES
In Alphabetical Order Within Categories
| Case Name | Description | Location | Resilience Cycle | Case Study # | Event |
|---|---|---|---|---|---|
| Atlanta Regional Council - Vulnerability and Resiliency Planning | Developing a resilience framework for the Atlanta Region | Atlanta, GA | Preparedness | 3A.1 | Climate |
| Climate Ready Boston | Implementing district-scale solutions for the East Community; resilience, economic response, and business continuity | Boston, MA | Preparedness | 3A.2 | Flooding |
| Cyber/GPS Security | Satellite targeting-communications and supply chain preparedness | Wisconsin | Preparedness | 3A.3 | Cyberattack |
| EPA/Rhode Island-Community Planning Framework | Prepare for a climate-resilient economy; climate resilience, economic resilience, and business continuity | Rhode Island | Preparedness | 3A.4 | Climate |
| Florida DOT Resiliency in Long-Range Planning | MPO and DOT coordination in implementing resilience in long-range planning | Florida | Preparedness | 3A.5 | Climate/Hurrican e |
| Case Name | Description | Location | Resilience Cycle | Case Study # | Event |
|---|---|---|---|---|---|
| Louisiana Supply Chain Transportation Council | Business continuity, supply chain risk, disruption, and public-private partnerships | Louisiana | Preparedness | 3A.6 | Hurricane |
| Washington State DOT’s Bridge Seismic Retrofit Program | Earthquake/rock fall emergency mgmt., asset hardening, and redundancy | Oregon and Washington | Preparedness | 3A.7 | Earthquake |
| Pedestrian Flow-Path Modeling | To support tsunami evacuation and disaster relief planning in the U.S. Pacific Northwest tsunami response | Washington (state), USA | Preparedness | 3A.8 | Earthquake |
| Typhoon Emergency Response Modeling | Modeling the effectiveness of infrastructure and travel demand management measures to improve traffic congestion during typhoons | Tokai Region, Japan | preparedness | 3A.9 | Typhoon |
| Asset-Based Risk Management | Evaluation and implementation of a new risk management process | Utah, CONUS; New Zealand | Preparedness | 3A.10 | Risk evaluation – Interdependenci es and Cascading Effects |
| COVID-19 Food Supply Chain Disruption | Disruption to meat and dairy supply chains in the Midwest | Midwest United States | Response | 3B.1 | Pandemic |
| Howard Street Tunnel Fire, Baltimore, MD | Modal single point of failure and multiagency communication/cord | Maryland | Response | 3B.2 | Fire |
| Case Name | Description | Location | Resilience Cycle | Case Study # | Event |
|---|---|---|---|---|---|
| Puerto Rico After Hurricanes Irma and Maria | Transportation network impacts effect on populations | Puerto Rico | Response | 3B.3 | Hurricane |
| Puerto Rico After Hurricanes-Equity | Equity | Puerto Rico | Response | 3B.4 | Hurricane |
| Superstorm Sandy | Med-term to long-term- lessons learned, institutional responses | East Coast, USA | Response | 3B.5 | Hurricane |
| Port of Everett Response, COVID-19 | COVID response, how established and practiced response planning helps improve business continuity, and resumption of trade plan | Washington State | Response/preparedness | 3AB.1 | Pandemic |
| Pre- and Post-Hurricane Katrina | Equity | NOLA | Preparation/Response | 3AB.2 | Hurricane |
| COVID-19 A Regional Response to a Global Health Pandemic | WHO and distribution of medical supplies using world air hubs | International | Response | Report out only 3AB.3 | Pandemic |


