Design, Construction, and Monitoring Practices for Aquatic Organism Passage (2025)
Chapter: 3 State of the Practice Survey
CHAPTER 3
State of the Practice Survey
A questionnaire using the Alchemer survey platform was distributed electronically to engineering staff of DOTs in the 50 states, Puerto Rico, and the District of Columbia. The 30-question survey included definitions and terms important for understanding the content of the survey, as well as instructions for sharing the survey with colleagues should auxiliary expertise be required. The results present the state of the practice with the intent of providing aid to agencies to evaluate and improve design, construction, and monitoring practices for AOP. Additionally, the results may assist agencies in the development of AOP practices if procedures had not previously been implemented.
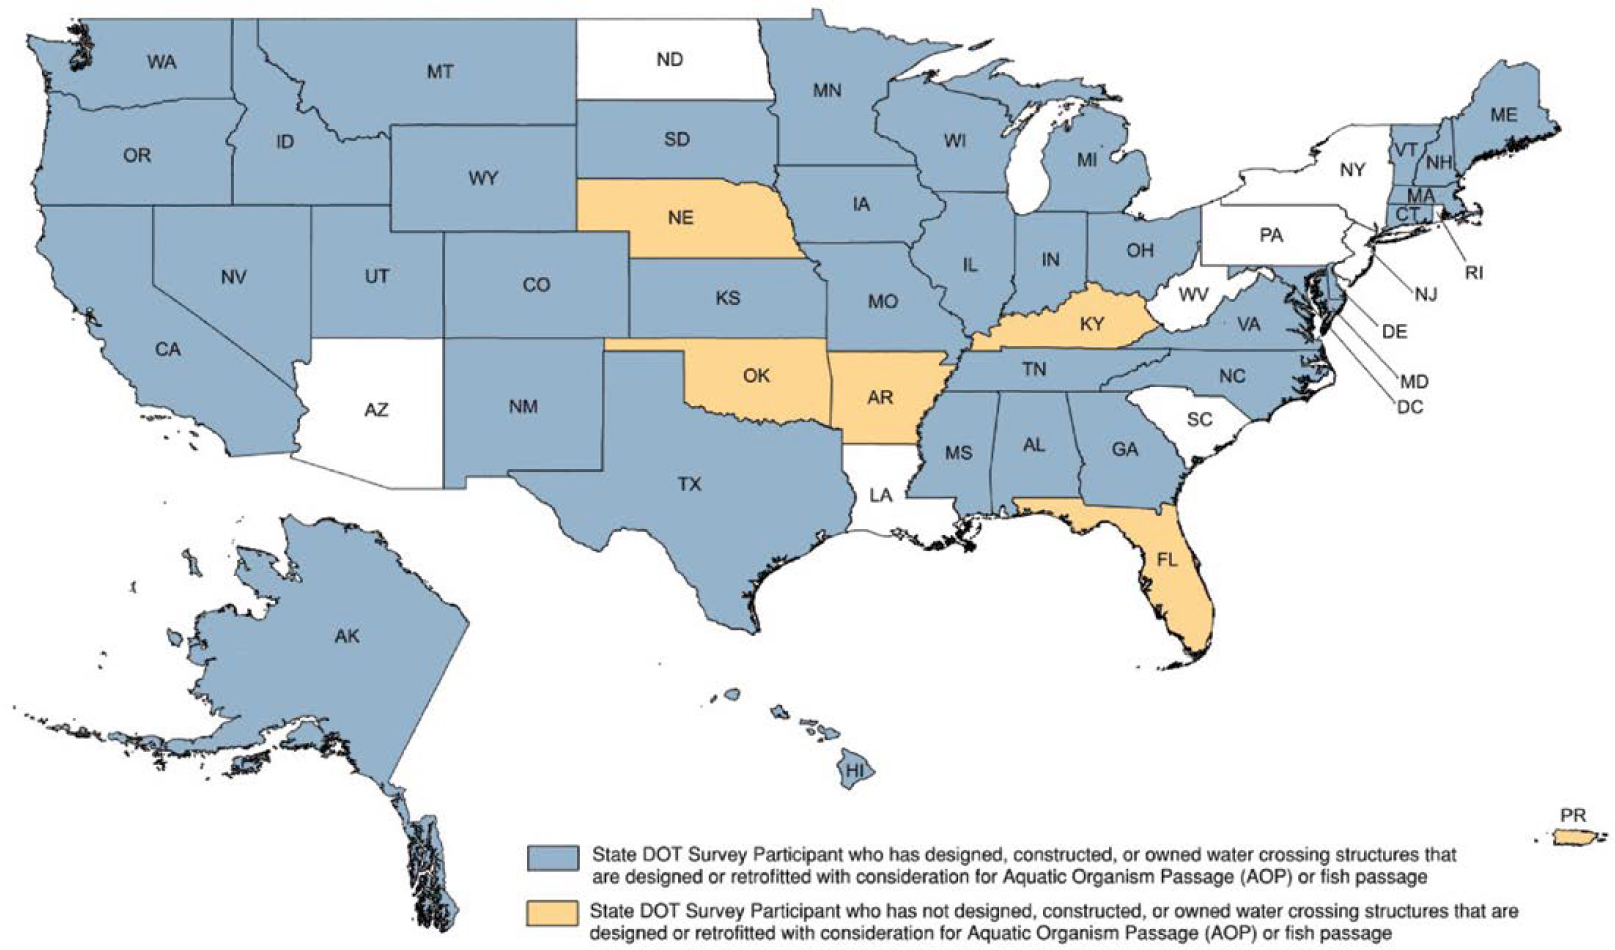
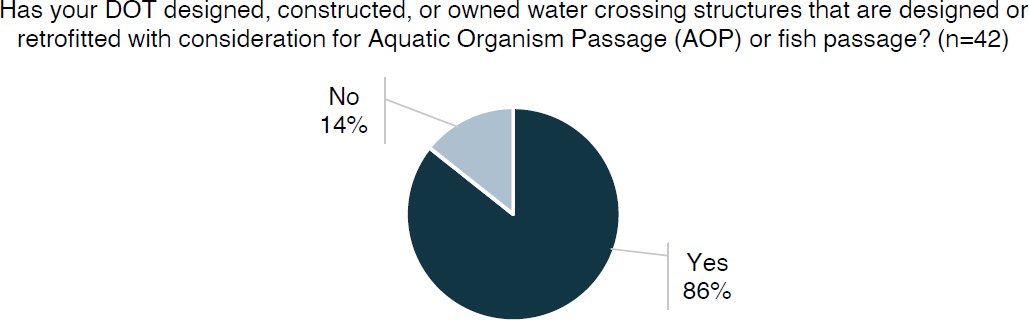
The survey was distributed on February 8, 2024, and responses were gathered through February 23, 2024. Forty-two of a possible 52 complete responses (81%) were received, as displayed in Figure 1. Six of the 42 respondents (14%) had not designed, constructed, or owned a water crossing structure designed or retrofitted with consideration for AOP or fish passage, and therefore were not participants in the remaining questionnaire regarding AOP-relevant design, retrofit, and construction procedures and experience.
Per the survey’s skip logic, the remaining questions were answered by a maximum of 36 participating DOTs, as 36 of the 42 DOT respondents (86%) indicated experience working with AOP projects. The branching of the survey questionnaire organized respondents into state DOTs that design, retrofit, or construct water crossing structures with consideration for AOP or fish passage. The number of responses for each survey question (n value) represents the total number of responses received on a particular question. Depending on the survey question (i.e., “select all that apply” or “select one”), the number of selections for a single question may exceed the number of participating DOTs; however, the number of respondents is consistently 36, as all questions required a survey response to complete the questionnaire. This section reports on the results of the survey.
3.1 State DOT AOP Water Crossing Ownership and Management
The initial survey questions gathered data on state DOT AOP design, ownership, management, and construction experience. Figures 2 and 3 display the percentage of participating DOTs with experience in the design, construction, or ownership of water crossing structures either designed or retrofitted with consideration for AOP or fish passage. State DOTs without experience in this field were directed to the end of the survey, and the remaining 36 of the responding 42 DOTs (86%) compose the survey group or sample.
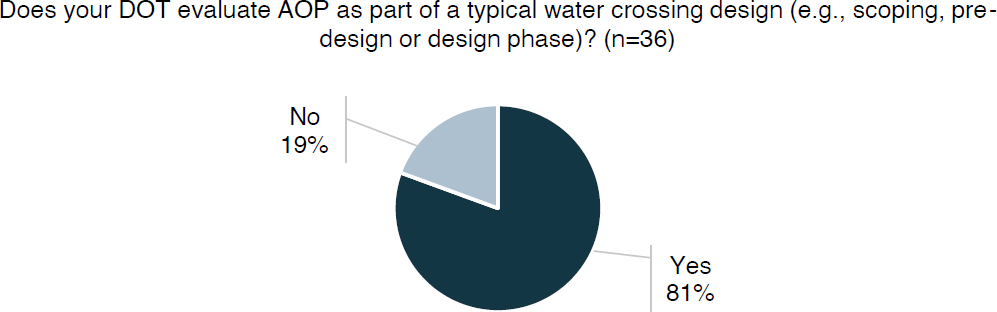
Respondents were asked whether their agency evaluates AOP as part of typical water crossing design (e.g., scoping, pre-design, design phase). Figure 4 shows that 29 of the 36 responding state DOTs (81%) responded affirmatively.
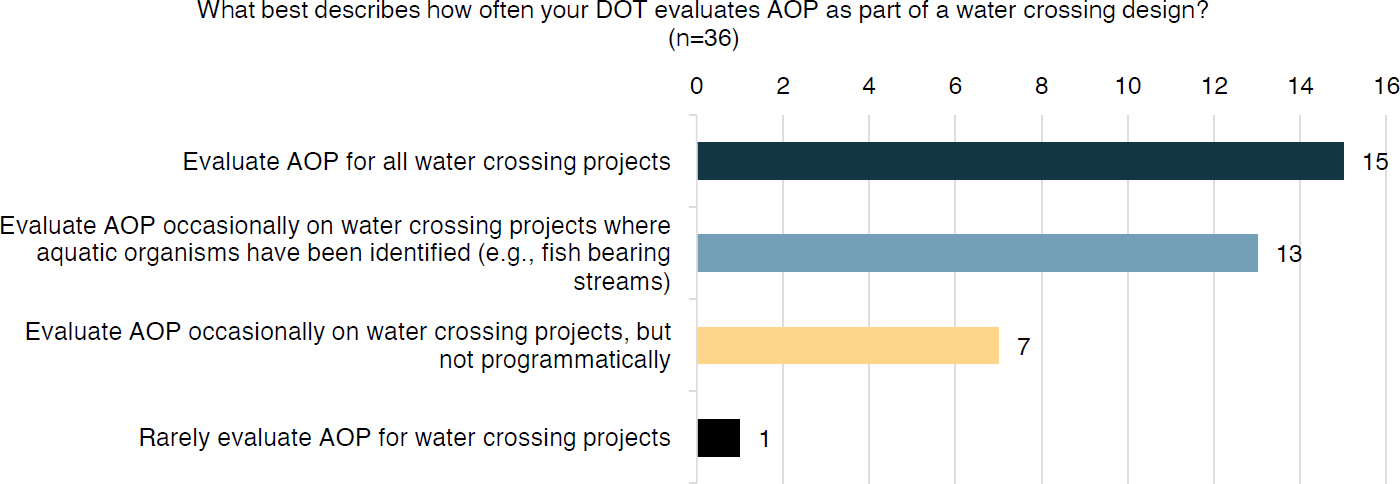
The survey sought further details concerning the frequency of AOP evaluation as part of a water crossing design. Figure 5 shows that 15 of the 36 responding DOTs (42%) evaluate AOP for all water crossing projects; 13 respondents (36%) evaluate AOP occasionally on water crossing projects where aquatic organisms have been identified; seven respondents (19%) evaluate AOP occasionally on water crossing projects, but not programmatically; and 1 of the 36 responding DOTs (3%) rarely evaluates AOP for water crossing projects.
Building on the previous questions with regard to the consideration of AOP in water crossing design and the frequency of AOP evaluation as a part of water crossing design, Figure 6 shows the responses to the question about the types of water crossing structures each state DOT has
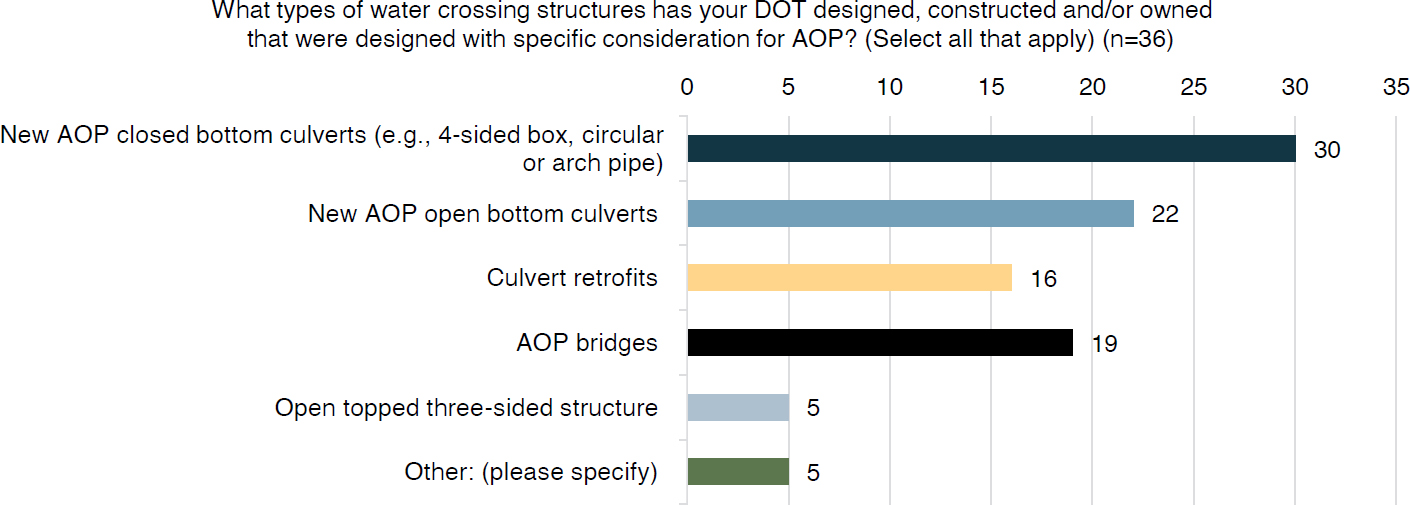
designed, constructed, or owned that were designed with specific consideration for AOP. New AOP closed-bottom culverts received the most responses, from 30 of the 36 responding DOTs (83%). Of the 36 respondents, 22 (61%) have designed new AOP open-bottom culverts, and 19 (53%) have designed new AOP bridges. The remaining responses indicate that 16 of the 36 responding DOTs (44%) consider AOP for the design of culvert retrofits, and 5 (14%) have designed AOP open-topped three-sided structures. For the responses that fall under the “other” category, 5 of the 36 (14%), include the following:
- The design, construction, or ownership of both aquatic passage–specific and non-specific structures.
- AOP or fish passage–specific in-stream relocation or restoration structures, such as fish ladders and fish weirs.
- AOP non-specific structures or projects, including standard bridge crossings, step-pool design local to bridge crossings, and environmental consultation responses.
Note that each responding DOT was able to select multiple responses depending on which features they have designed, constructed, or owned; therefore, the total number of responding agencies is 36, while the number of selections may be greater. Because the summation of selections is greater than the number of responses, percentages described herein will not sum to 100%.
3.2 State AOP Program Policy and Drivers
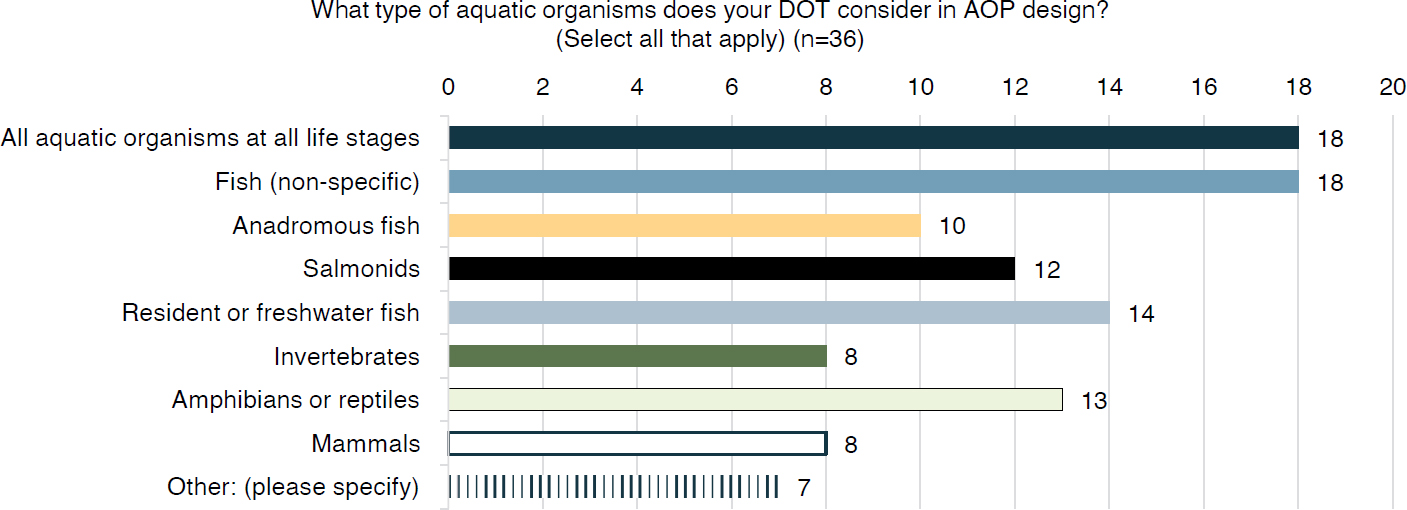
The second segment of survey questions was designed to determine the program policy and drivers for AOP. AOP design and project requirements can vary depending on the species of concern and current state regulatory requirements. The survey asked about the type of aquatic organisms that DOTs consider in AOP design (Figure 7). Eighteen of the 36 responding DOTs (50%) indicated they consider all aquatic organisms at all life stages; the same number consider non-specific fish species. Of the 36 responses, 14 DOTs (39%) consider resident or freshwater fish, 13 DOTs (36%) account for amphibians or reptiles, 12 DOTs (33%) consider salmonoids, and 10 DOTs (28%) consider anadromous fish in AOP design. Of the 36 responding state DOTs that have AOP practices, 8 (22%) consider aquatic mammals and the same number consider invertebrates. The remaining category, “other,” encompasses responses that do not fall under any of the other eight categories and account for 7 of the 36 (19%) responses; “other” responses are presented in Appendix B. As described previously, as each agency was allowed to select more than one response, percentages will not sum to 100%.
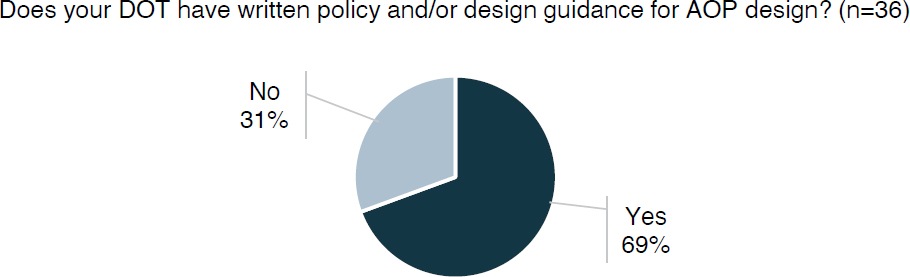
The presence of policy and design guidance for certain designs, such as AOP, may affect the likelihood of states incorporating such design practices into existing projects or taking on new projects. The survey asked whether the state has a written policy or design guidance for AOP design. As shown in Figure 8, 25 of the 36 responding DOTs (69%) have a written policy or design guidance document in place for advisement or direction on AOP design; the remaining 11 of the 36 responding DOTs (31%) do not have such a policy in place.
Survey questions 9 and 10 requested a link or attachment for the policy, design guidance, and other related documents, including checklists, scoping documents, and design procedures. The inclusion of such resources can be found on 23 of the 36 responding DOTs’ (64%) websites. A complete listing of the provided documents can be found in Appendix B.
3.3 AOP Design Practices
The third segment of the survey questionnaire captured information on the design practices used in AOP design projects by gathering data pertaining to structure dimension design practices, channel design features, rehabilitation and retrofit methods, and streambed material standards.
Primary factors for the geometry of structures may vary depending on the system and the existing landscape context. For example, alluvial systems, containing clay, silt, or sand in-stream or channel beds, lack the solid and durable qualities of hard rock and therefore require different considerations during their design process. Figure 9 illustrates the responses to the first of several AOP design practice questions. The question allowed for multiple responses per responding
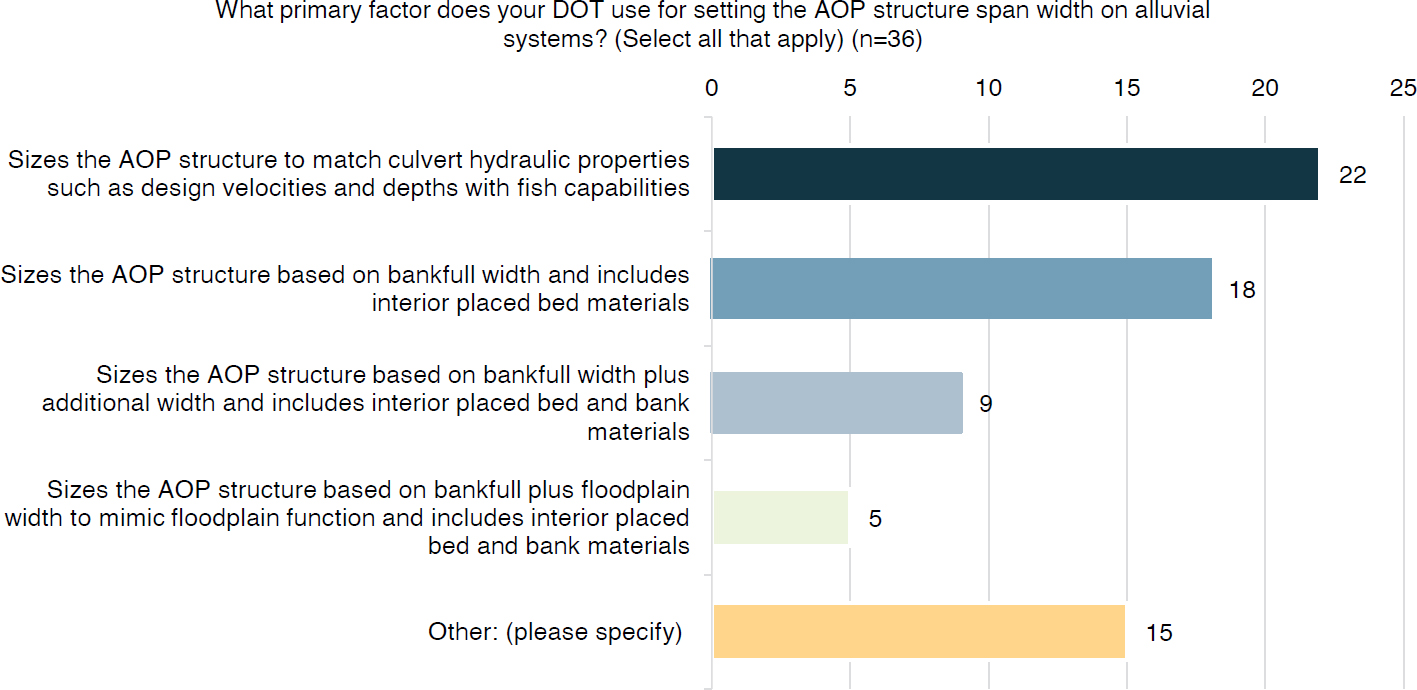
DOT and required a minimum of one response per respondent. The total number of responding DOTs is 36. Of the 36 responding DOTs, 22 (61%) size the AOP structure to match culvert hydraulic properties such as design velocities and depths with fish capabilities. Eighteen of the 36 responding DOTs (50%) that have designed, owned, or constructed water crossing structures designed or retrofitted with consideration for AOP size their AOP structures on the basis of bankfull width and include interior-placed bed materials, and 9 of the 36 responding DOTs (25%) size the AOP structure on the basis of bankfull width plus an additional width and include interior-placed bed and bank materials. Five of the 36 responding DOTs (14%) size the AOP structure on the basis of bankfull width plus floodplain width to mimic floodplain function and include interior-placed bed and bank materials. The remaining 15 of 36 responses (42%) fall into the “other” category and do not directly conform to the other four selection criteria. Of the 15 responses of “other,” 3 (20%) use HEC-26 (FHWA 2010), and stream-simulation methods. Other responses indicate that the structure span width for AOP design is conducted according to the following properties or circumstances:
- To maintain low-flow scenarios via bankfull width excluding placed bed materials.
- Based upon geomorphic approaches.
- Designed per culvert hydraulic properties only.
- Designed for culvert burial, and according to collaborative solutions with a state department of fish and game/wildlife where appropriate.
The state DOT responses to the selection “other” are set forth in Appendix B. Note that the question accepts multiple responses for each responding DOT. Because DOTs may use different methods for different AOP structures or projects, the percentage of responding DOTs that use each design method for alluvial systems will not sum to 100%.
Approaches to the design of channels vary based on the primary project objective, for example, conveyance efficiency, cost efficiency, AOP, erosion control, or restoration. State DOT respondents were asked to identify what design features their agency uses for the design of channels to facilitate AOP. As shown in Figure 10, 24 of the 36 responding DOTs (67%) focus on replication of natural channel dimensions, geometry, and features to the structure, and 21 of the 36 responding DOTs (58%) size bed materials to replicate natural channel bed materials. The same number use grade control structures defined as natural channels, such as rock sills, rock weirs,
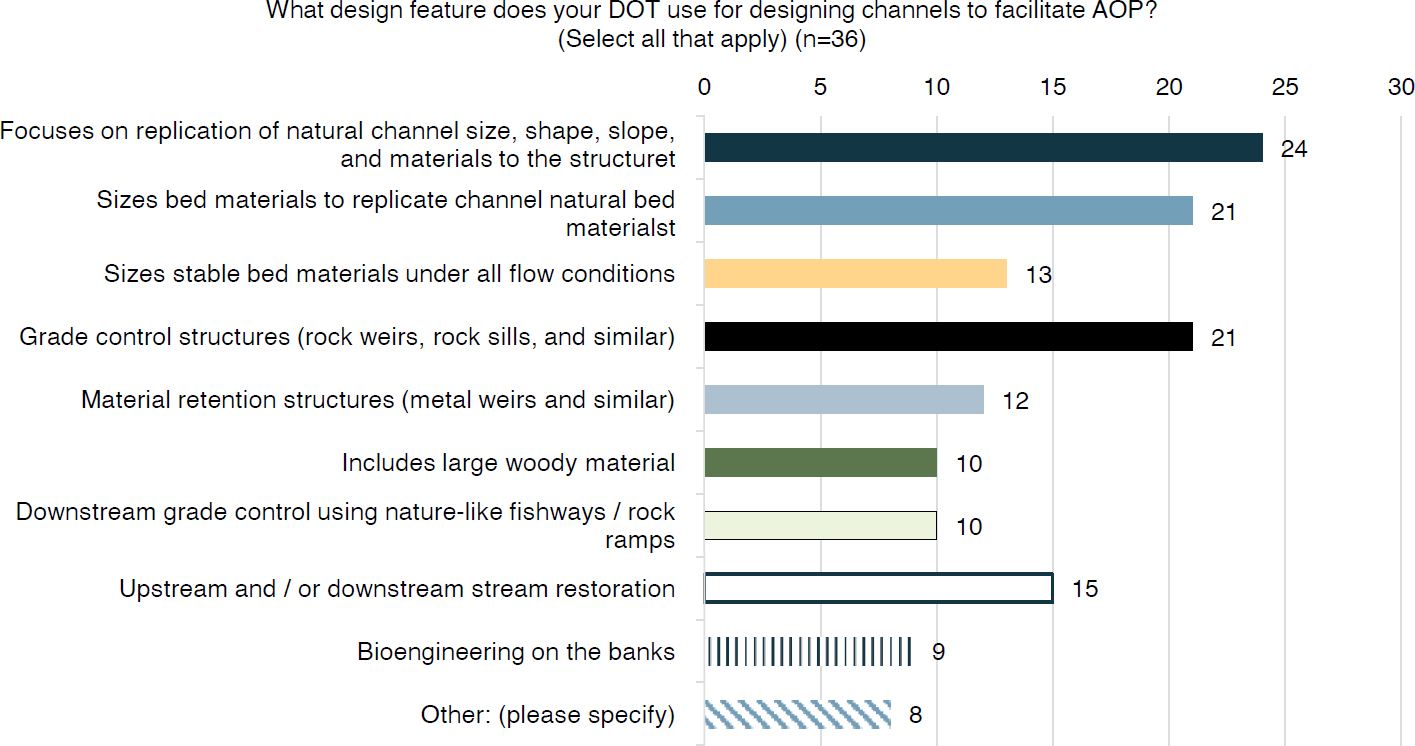
and similar design features. Additional responses include upstream and downstream restoration (15 of 36 responding DOTs [42%]), sizing stable bed materials under all flow conditions (13 of 36 responding DOTs [36%]), material retention structures (12 of 36 responding DOTs [33%]), downstream grade control using natural-like fishways and rock ramps, incorporation of large woody material (both 10 of 36 responding DOTs [28%]), and bioengineering on the banks (9 of 36 responding DOTs [25%]). Of the responses, 8 (22%) are characterized as other design features for designing channels to facilitate AOP. The “other” responses revealed that 3 of 8 agencies do not use any specific design feature for designing channels to facilitate AOP, 1 of 8 agencies uses the HEC-26 (FHWA 2010), and the remaining agencies vary techniques depending on permits and approvals. Responses provided by DOTs that selected “other” are presented in Appendix B.
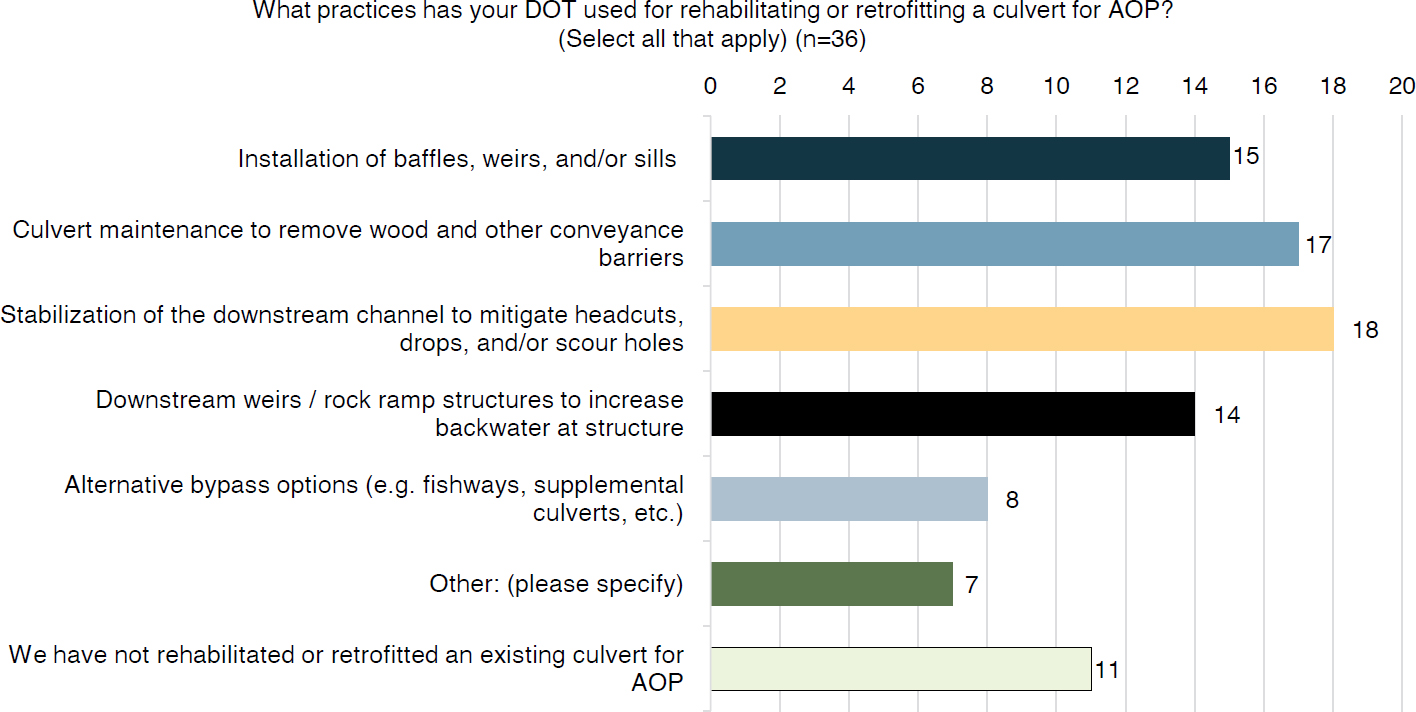
DOT participants were asked about the practices their agency incorporates for the rehabilitation and retrofit of culverts for AOP (Figure 11). Of the 36 responding DOTs, 18 (50%) stabilize the downstream channel to mitigate erosional features such as headcuts, drops, and scour holes, and 17 of the responding DOTs (47%) practice culvert maintenance to remove wood and other conveyance barriers. Additionally, 15 of the 36 responding DOTs (42%) install flow control devices such as baffles, weirs, and sills, and 14 of the 36 responding DOTs (39%) install downstream weirs or rock ramp structures that create adequate head for diversion to increase backwater at the structure. The remaining selections of no rehabilitation or retrofit action on an existing culvert for AOP and alternative bypass options such as fishways and supplemental culverts resulted in 11 and 8 of the 36 total responses, respectively. Finally, the outstanding seven responses are classified as “other,” allowing the responding DOTs that selected this option to specify what design practices their departments use for culvert rehabilitation or retrofit purposes. Other rehabilitative and retrofit design practices were tabulated as the following:
- Burial of the culvert bottom to allow for natural streambed reestablishment
- Pipe replacement with open-bottom culverts
- Experimental trenchless technologies
- Limited retrofit to existing culverts
The responses provided by DOTs that selected “other” are arranged in Appendix B.
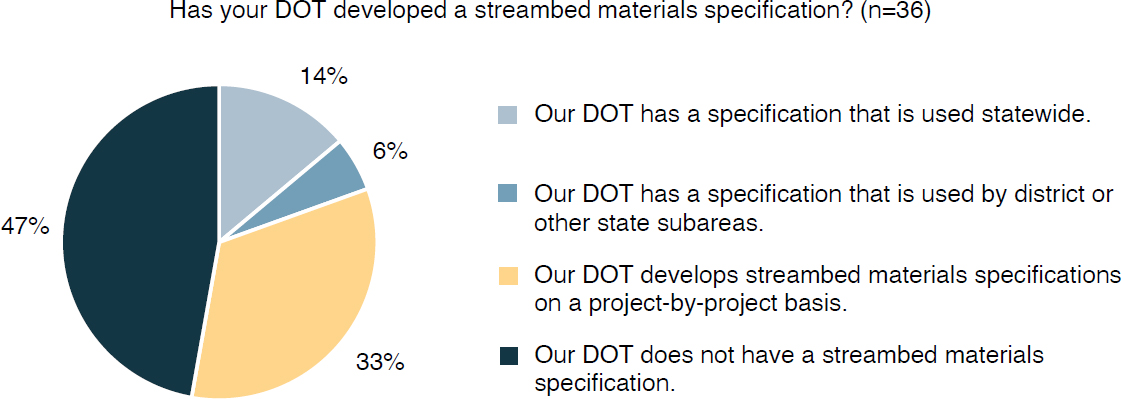
Responding DOTs were asked whether their agency had developed a streambed materials specification (Figure 12). Streambed material can support certain fish species, promote or negatively affect biodiversity, and provide difficult obstacles during feeding. Seventeen of the 36 responding DOTs (47%) do not have a streambed materials specification, 12 of the 36 responding DOTs (33%) develop streambed materials specifications on a project-by-project basis, 5 of the 36 responding DOTs (14%) have a statewide specification to reference, and 2 of the 36 responding DOTs (6%) have a district or state subarea specification for guidance with regard to stream materials. The selection of “other” allowed the DOT respondent to provide further detail with regard to their practices in rehabilitation or retrofitting a culvert for AOP; such responses are presented in Appendix B.
3.4 Implementation Costs of AOP
Incorporating AOP design elements and features may affect design and construction costs. This section addresses AOP cost considerations for DOTs.
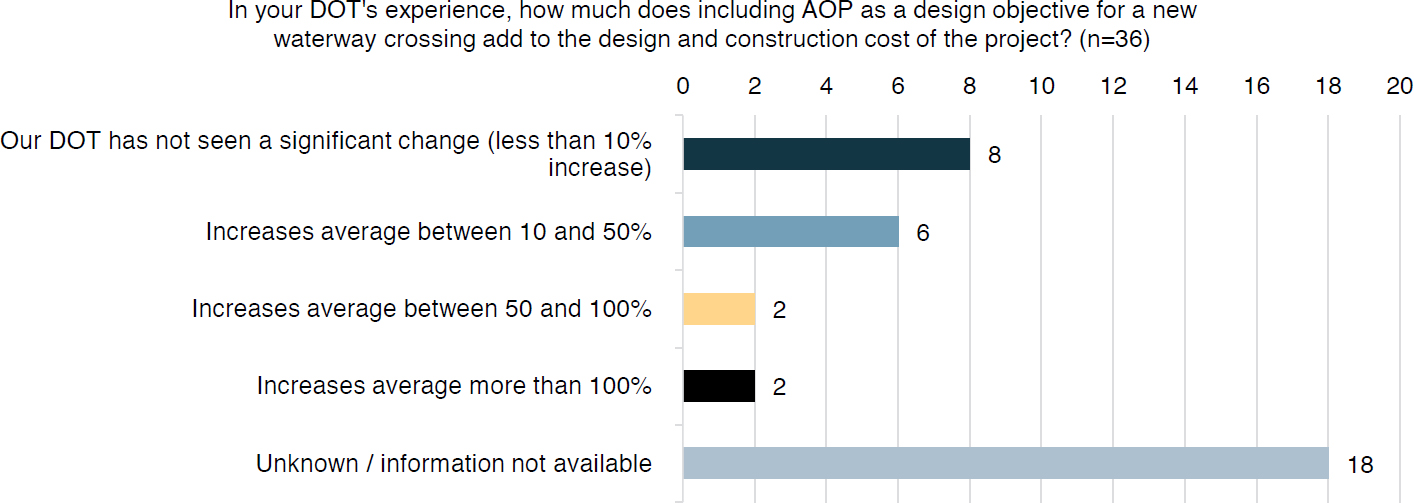
As a part of any cost-benefit analysis, a systematic approach to estimate costs and evaluate a project’s strengths and weaknesses is necessary to determine whether the cost of an item or design is worth its positive outcome. Incorporating several design features into a single project can help DOTs lower costs by meeting multiple goals within a single timeline, budget, and design team. Responding DOTs were asked how much the costs of including AOP as a design objective for a new waterway crossing add to design and construction project costs (Figure 13). Eighteen of the 36 responding DOTs (50%) do not possess information to differentiate new waterway crossing costs with or without the inclusion of AOP as a design intent; 8 of 36 responding DOTs (22%) have not observed a significant alteration (a less than 10% increase); and 6 of the 36 responding DOTs (17%) account for variable increases from 10% to 50%. Average increases between 50% and 100% and greater than 100% were each discerned by 2 of the 36 responding DOTs (6%).
State DOTs incorporate operation and maintenance (O&M) activities into their annual budgets and schedules to help organizations identify malfunctions before larger issues and timely part replacement is required. Figure 14 summarizes responses regarding the known effects of AOP projects on O&M costs. As shown, 32 of the 36 responding DOTs (89%) have not determined the variability linking AOP and non-AOP water crossing O&M costs, and 2 of the 36 responding DOTs (5%) have not seen a reduction in O&M costs in AOP waterway crossing projects when
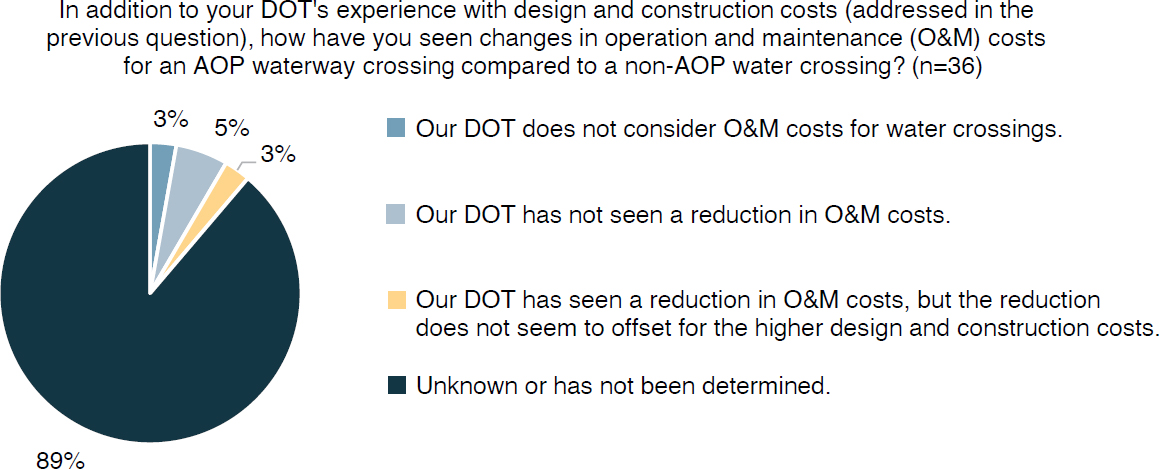
contrasted with non-AOP waterway crossing projects. The remaining 2 DOT respondents (1 each of the 36 responding DOTs; 3%) either do not consider O&M costs for waterway crossings or have seen a reduction in O&M costs that does not offset the increase in design and construction price points.
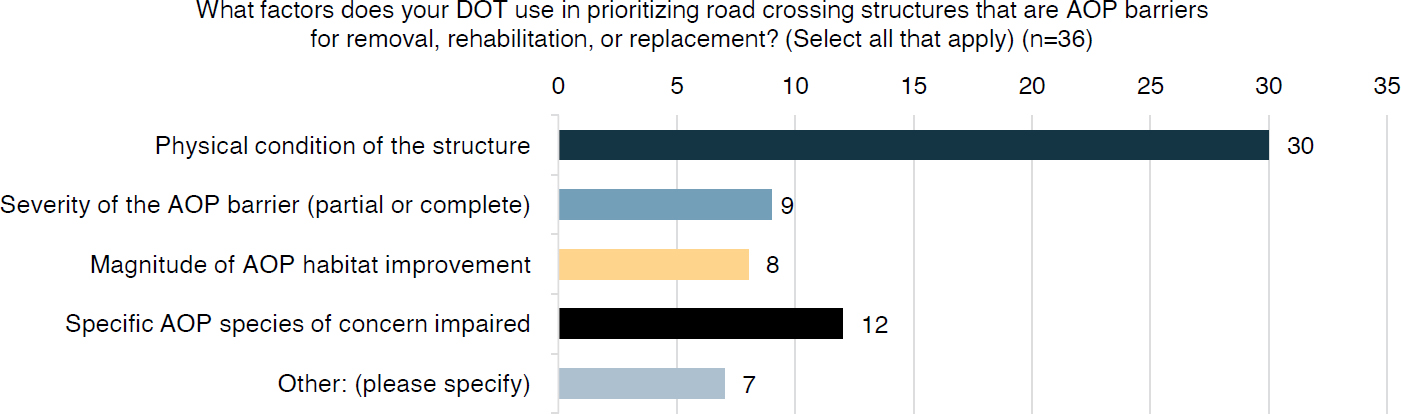
To understand the driving factors in prioritizing road crossing structures that are AOP barriers for removal, rehabilitation, and replacement, responding DOTs were asked what factors their agency uses in classifying such projects (Figure 15). Thirty of the 36 responding DOTs (83%) note the physical condition of the structure as a prioritization factor; 12 of the 36 responding DOTs (33%) declare the impairment of a specific AOP species of concern; 9 of the 36 responding DOTs (25%) assert the severity of the AOP barrier; and 8 of the 36 responding DOTs (22%) voice the magnitude of the AOP habitat improvement. The additional seven responses are designated as “other,” for which responding DOTs provided other prioritization factors. Respondents who selected “other” consider the following to be prioritization factors:
- Cost
- Length or extent of habitat
- Fish presence
- State department of fish and game/wildlife priorities
- Parks and wildlife directives
- U.S. Fish and Wildlife Service (USFWS) fish passage data referenced and analyzed in new projects
- Capital improvement project (CIP) inclusion
- No prioritization for AOP barriers for removal, rehabilitation, or replacement
The selection of “other” permitted DOT respondents to provide further detail regarding the factors their DOT uses to prioritize road crossing structures that are AOP barriers for removal, rehabilitation, or replacement; such state DOT responses are presented in Appendix B.
3.5 AOP Construction Practices
The following survey questions about AOP construction practices identify the importance and frequency of construction oversight and practices, as well as the typical project delivery methods for AOP structure projects.
The 36 responding DOTs were asked what construction practices their agency designated as most important (Figure 16). Twenty-one responding DOTs (58%) stated that frequent on-site engagement between state DOT and contractor personnel for field adjustments and oversight
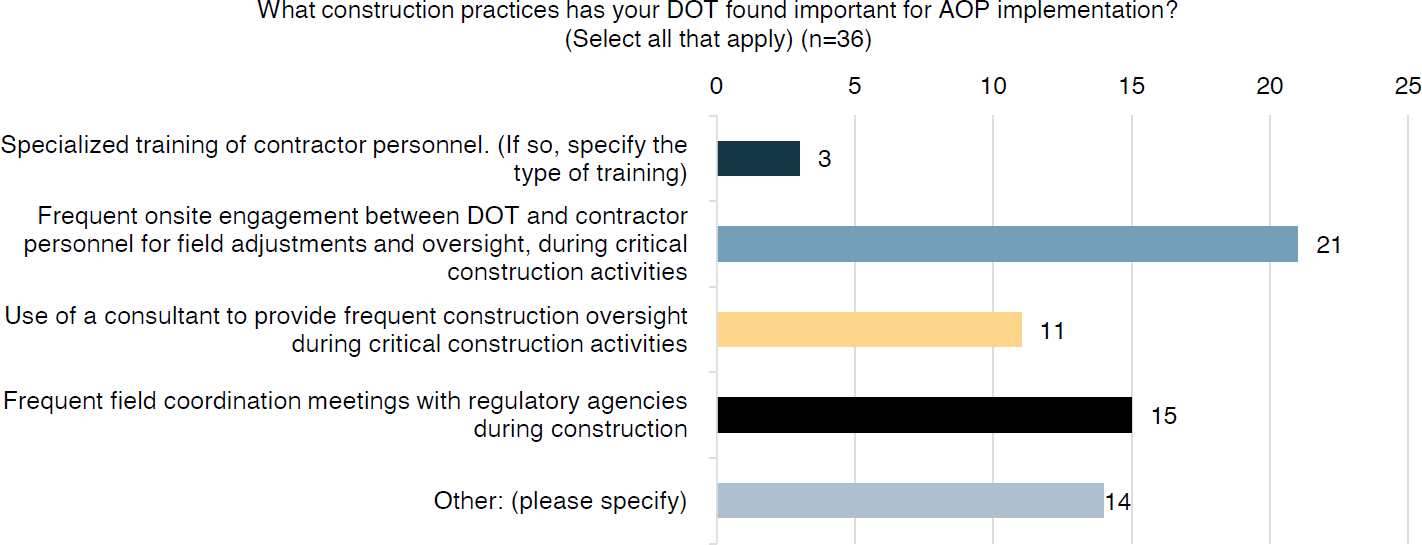
during critical construction activities is key; 15 responding DOTs (42%) discern frequent field coordination meetings with regulatory agencies during construction; 11 responding DOTs (31%) noted that a consultant to provide frequent construction oversight during critical construction activities is valuable; and three responding DOTs (8%) use and value specialized training of contractor personnel.
Fourteen further responses selected “other” and specified what construction practices their DOT has found essential for AOP implementations. Responses classified as “other” specified the following:
- All construction practices have been used, however, none universally, owing to state size and implementation of online communication sources (1 of 14 respondents [7%])
- Case-by-case for critical installations (1 of 14 respondents [7%])
- Use of a separate contractor (1 of 14 respondents [7%])
- Incorporation of environmental personnel and natural resource agencies for coordination and a review of construction of AOP structures (2 of 14 respondents [14%])
- A process to access AOP is currently under way (1 of 14 respondents [7%])
- Identification of special AOP design features within contract documents and preconstruction communication to avoid unintended adjustments (1 of 14 respondents [7%])
- Construction practices of importance for AOP implementation are unknown or do not apply (7 of 14 respondents [50%])
The selection of “other” or “specialized training of contractor personnel” granted the DOT respondent the option to provide further detail regarding state construction practices found important for AOP implementation; such responses are presented in Appendix B.
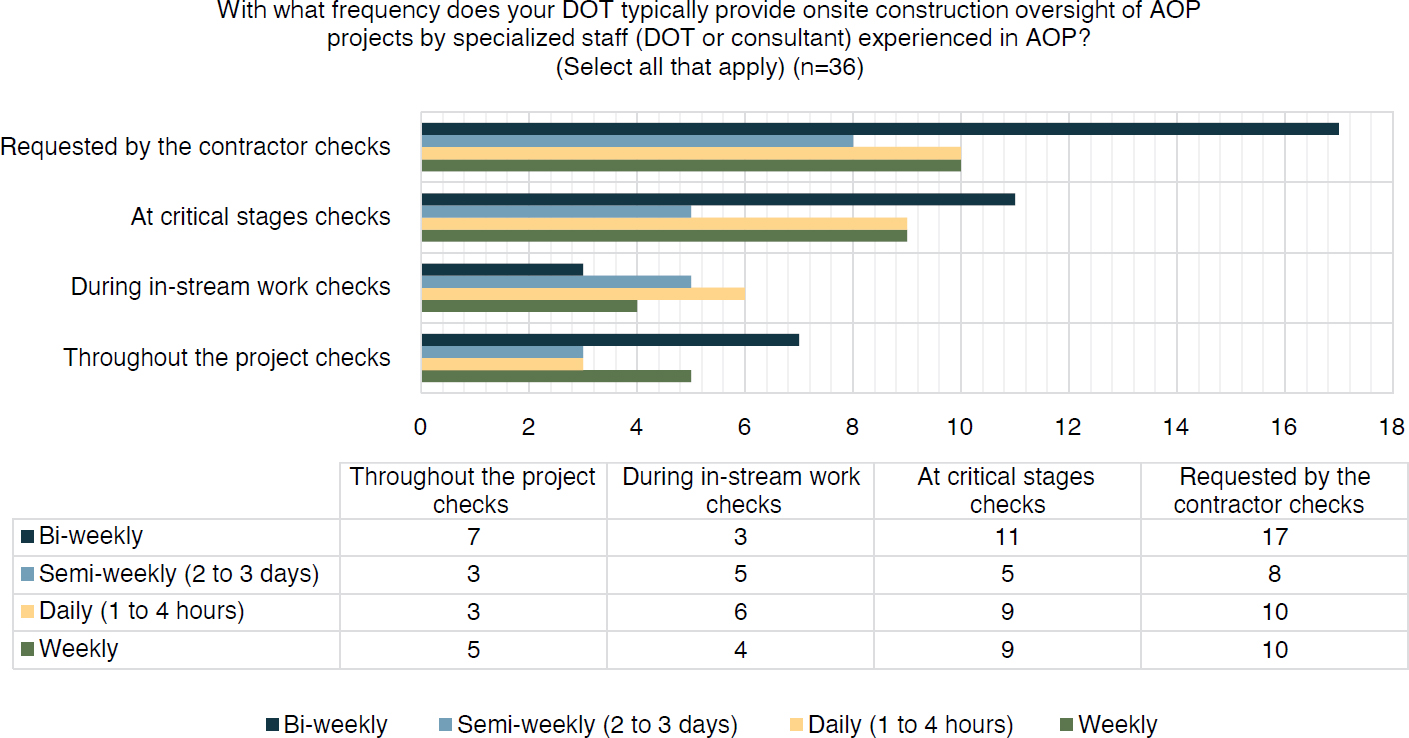
The frequency of construction site visits conducted by specialized staff may depend on the type of structure, project distance, and prioritization of a project. DOT respondents were asked about the frequency at which their agency typically provides on-site construction oversight of AOP projects by specialized staff (DOT or consultant) experienced in AOP construction oversight. As shown in Figure 17, there is a generally decreasing trend in on-site construction oversight of AOP projects by specialized staff, from the project checks requested by contractors, at critical stages, during in-stream checks, and throughout the project.
Responding state DOTs were asked about the contract delivery methods their agency uses for AOP projects. As shown in Figure 18, 32 of 36 responding DOTs (89%) indicated a
design-bid-build project delivery method, 21 of 36 responding DOTs (58%) indicated a design-build delivery method, and 4 of 36 responding DOTs (11%) used a public-private partnership for AOP structure projects. The survey question was designed to accept multiple responses per responding DOT because delivery methods are variable and depend on project location, structure, impacted species, and an array of additional factors. Of the 36 responding DOTs, 12 reflect an “other” selection that does not align with the three selection categories. “Other” delivery methods used by state DOTs, as indicated by submitted questionnaire responses, included the following:
- Construction manager/general contractor project delivery
- Detail-build
- Progressive design-build
- CIP
- Incorporation of AOP into an existing project, although AOP is not maintained as the primary focus; therefore, AOP structure projects adapt the delivery method of the project in which they are inherent.
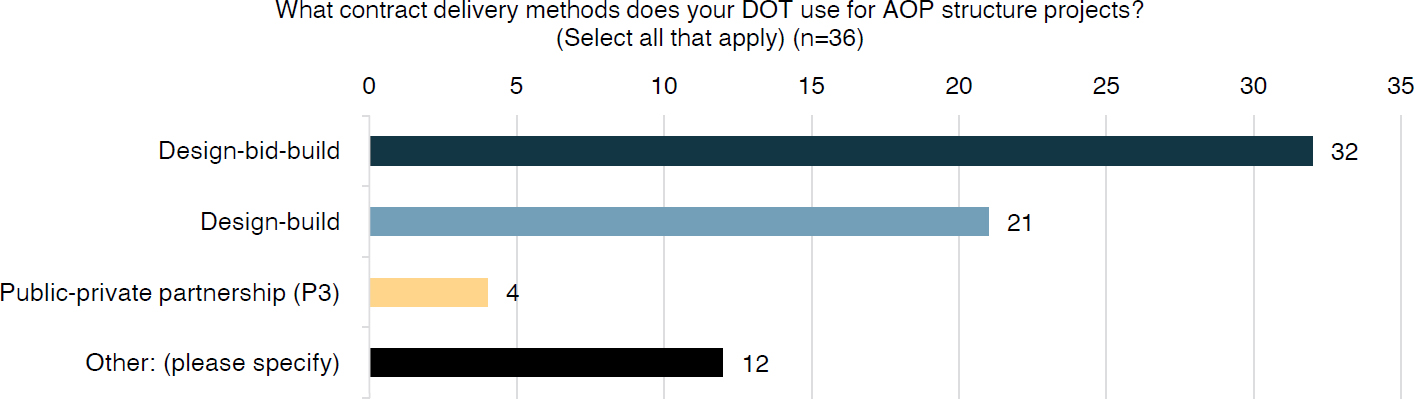
The selection of “other” authorized DOT respondents to provide further detail concerning state DOT contract delivery methods for AOP structure projects; “other” responses are provided in Appendix B.
3.6 AOP Monitoring Practices
In addition to the AOP construction practices deemed important by state DOTs, the survey collected information on AOP monitoring practices, namely inspections, typical monitoring cycles and frequency, and AOP structure post-construction monitoring program management and requirements.
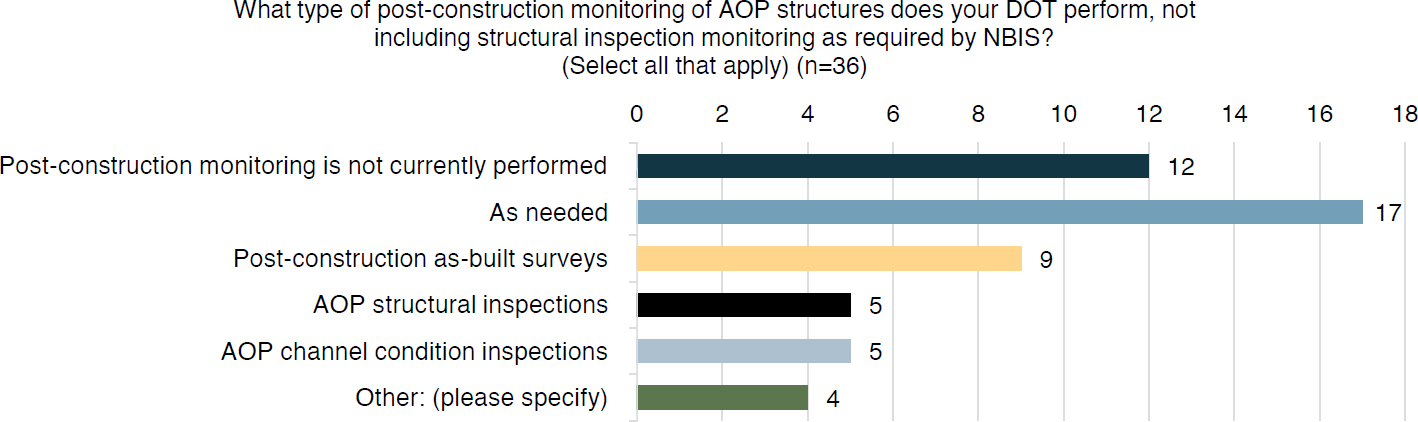
AOP monitoring practices collect data that measure progress toward achieving program objectives. AOP monitoring and evaluation reveal whether a project reached its objective or identify issues that led to facility failure. The survey asked about the type of post-construction monitoring of AOP structures being performed, excluding structural inspection monitoring required by the National Bridge Inspection Standards (NBIS). Figure 19 reveals that 17 of 36 responding DOTs (47%) conduct post-construction monitoring of AOP structures as needed, 12 of the 36 responding DOTs (33%) indicated that no post-construction monitoring of AOP structures occurs, 9 of the 36 responding DOTs (25%) conduct post-construction as-built surveys, 5 of the 36 responding DOTs (14%) conduct AOP channel condition inspections, and another 5 conduct AOP structural inspections. The remaining 4 of 36 responses (11%) were categorized as “other” and communicate that post-construction monitoring of AOP structures is executed as required by permit, by specific issue or concern, where regulatory agencies require such monitoring, and where the opportunity arises as supplementary state departments of fish and game/wildlife maintain staff who track culvert conditions with online-accessible information. The selection of “other” permitted the DOT respondent to provide additional information with respect to state post-construction monitoring of AOP structures performed, excluding that mandated by the NBIS; such responses are presented in Appendix B.
Depending on the AOP design features or structures incorporated into a design project, monitoring checks may require photo documentation, channel condition data collection, channel condition visual inspection, and structural inspection. To meet state or federal agency guidelines, monitoring efforts for any of these four categories may be required; such standards are variable from state to state. In addition to the type of typical post-construction AOP structure monitoring performed by state DOTs, responding DOTs were asked about their agency’s typical expected monitoring cycles for AOP structures (Figure 20). A decrease in AOP structure monitoring cycle checks is detected in Year-4 checks, 5-year cycle checks, and 10-year cycle checks, ranging from
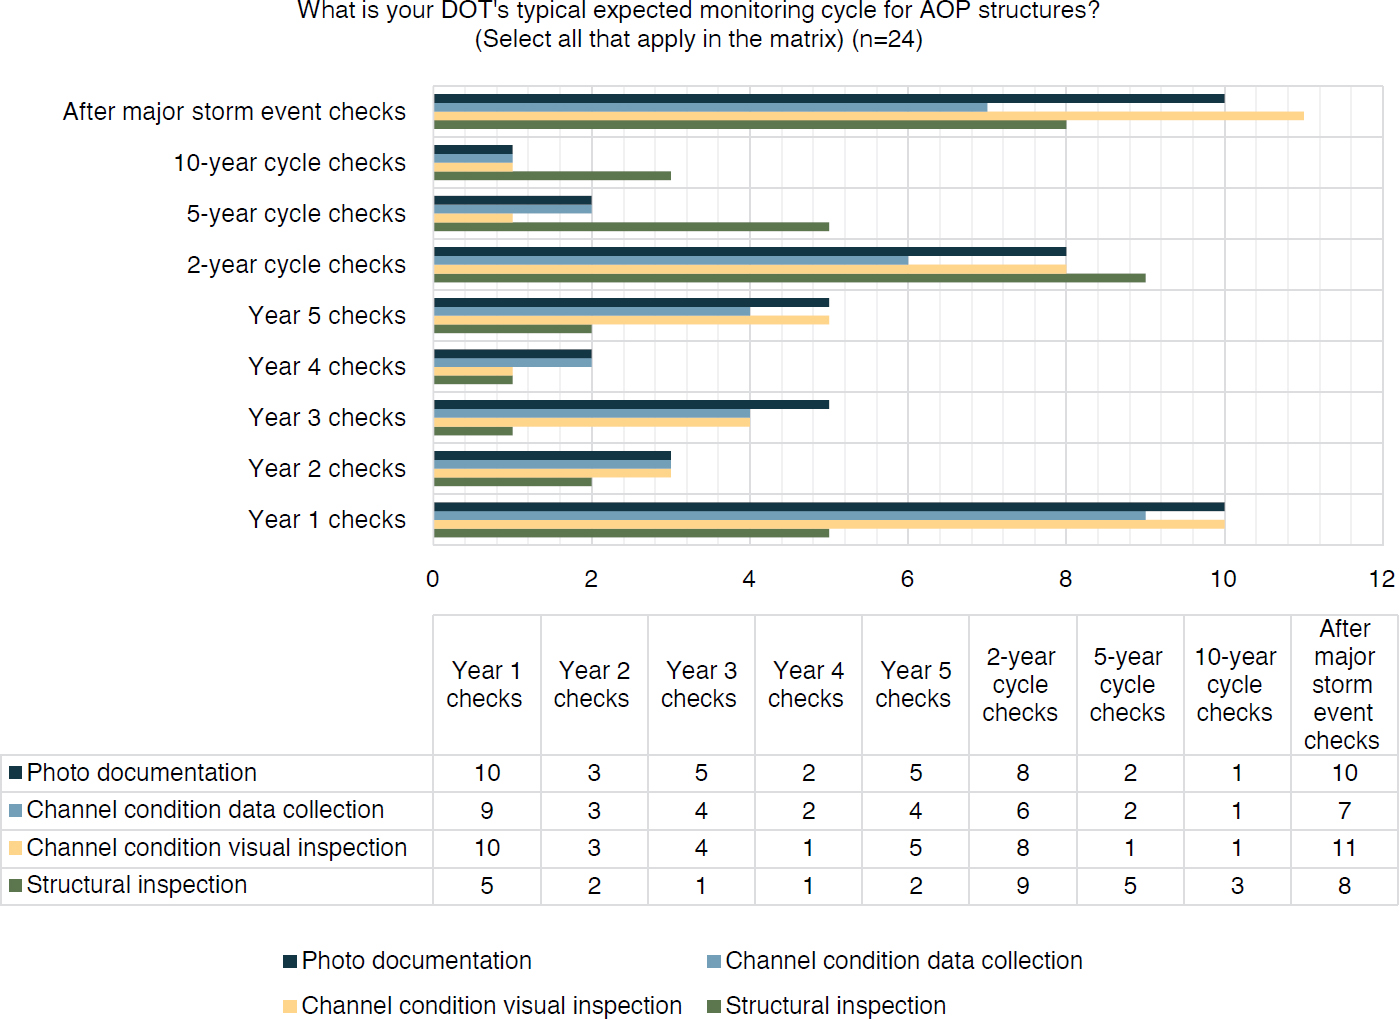
1 to 2 responses for channel condition visual inspection, channel condition data collection, and photo documentation, and from 1 to 5 responses for structural inspection.
Responding DOTs were asked what drives their AOP structure post-construction monitoring program (Figure 21). Sixteen of 23 responding DOTs (70%) consider a propelling factor to be state environmental agency requirements, 9 of 23 responding DOTs (39%) consider federal agency requirements as a driver, and 8 of 23 responding DOTs (35%) are steered to conduct AOP
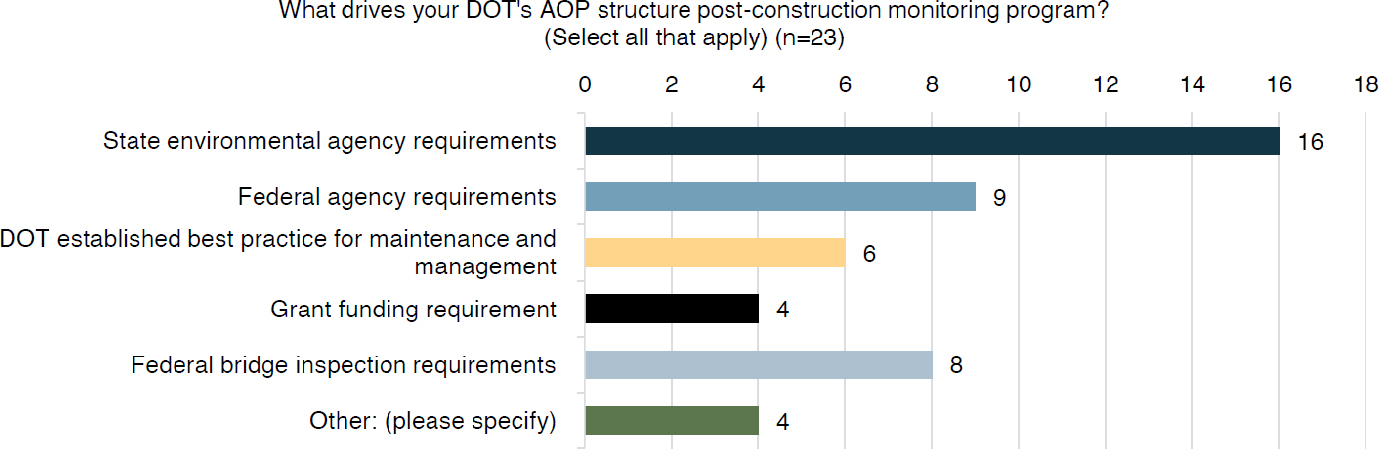
structure post-construction monitoring via federal bridge inspection requirements. The remaining responses are driven by DOT-established best practice for maintenance and management (6 of 23 responses [26%]) and grant-funding requirements (4 of 23 responses [17%]). Other driving factors identified by state DOTs include culvert injunction and permit stipulations that may require monitoring for AOP designs that incorporate complex design features or habitat objectives. Other state DOTs report having no specific AOP monitoring programs. State DOT respondents who selected “other” were able to clarify their selection by providing context regarding AOP structure post-construction monitoring program drivers; such responses are presented in Appendix B.
3.7 State DOT AOP Programmatic Considerations
The final section of the survey on design, construction, and monitoring practices for AOP expanded on state DOT AOP programmatic considerations, namely funding and delivery, secondary benefits for AOP project prioritization, asset management database system management, partnerships, staff allocation, and internal training.
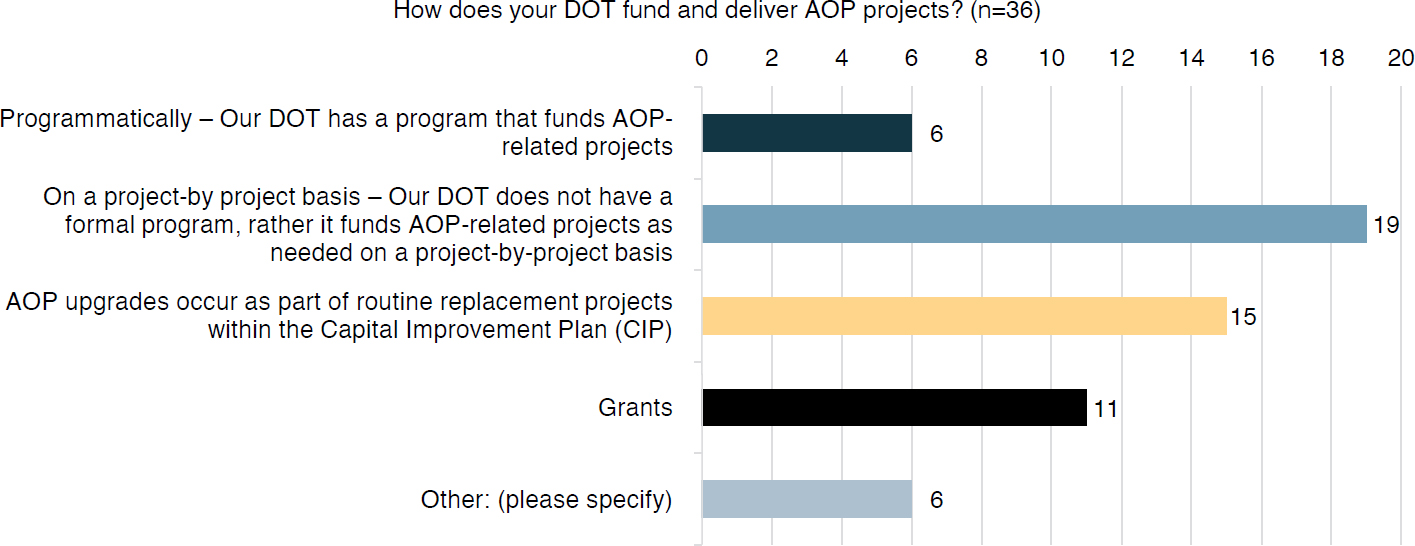
State DOTs were asked to identify the process by which AOP projects are funded and delivered (Figure 22). Nineteen of the 36 responding DOTs (53%) categorize AOP project funding and delivery as on a project-by-project basis without a formal program, 15 of the 36 responding DOTs (42%) classify such considerations as upgrades that occur as part of routine replacement projects with CIPs, 11 of the 36 responding DOTs (31%) stated that funding and delivery occurs via grants, and six of the responding DOTs (17%) state that such actions take place programmatically and their state DOT funds AOP-related projects. The selection of “other” allowed the DOT respondent to provide further detail with respect to state DOT funding and delivery of AOP projects. No further details were provided via questionnaire responses.
Secondary benefits can drive project prioritization because they encompass indirect benefits resulting from the direct primary goal or purpose of a project. Although secondary benefits may alter a project’s budget, they can increase funding and reduce overall maintenance by placing multiple improvement features at one location. Participating DOTs were asked what secondary benefits, if any, their agency considers when prioritizing or funding AOP projects (Figure 23). Fifteen of the 36 responding DOTs (42%) note each category of increased resiliency and wildlife crossing, 13 of the 36 responding DOTs (36%) consider environmental mitigation,
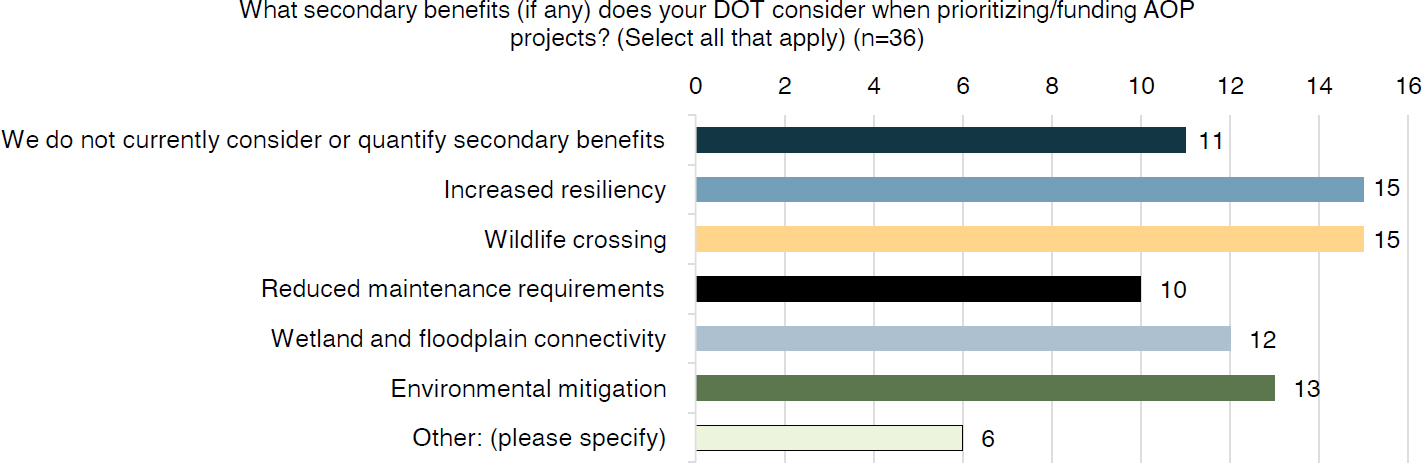
12 of the 36 responding DOTs (33%) evaluate wetland and floodplain connectivity, 10 of 36 review reduced maintenance requirements (28%), and 11 of the 36 responding DOTs (31%) do not currently consider or quantify secondary benefits. “Other” responses (6 of the 36 responding DOTs [17%]) are categorized as mammal passage and recognition of secondary benefits without impact to prioritization. Some of these responses were that their DOT’s secondary benefit program is currently under development and that their DOT has no prioritization or funding of projects based upon AOP. State DOTs that selected “other” were given the opportunity to specify the secondary benefits their DOT considers when prioritizing or funding an AOP project; “other” responses are set forth in Appendix B.
Asset management is the process of cataloging and tracking the existence, condition, and maintenance requirements of agency-owned elements of infrastructure (e.g., bridges, culverts, stormwater management facilities, road segments, retaining walls). Asset management systems are valuable tools for state DOTs because these agencies typically own a large network of infrastructure, and tracking system needs by less robust methods can lead to oversights. Participating DOTs were asked if there is an asset management database system managed by their DOT or others that includes AOP structures (Figure 24). Fifteen of the 36 responding DOTs (42%) do not have an asset management database system in place, 14 of the 36 responding DOTs (39%) have
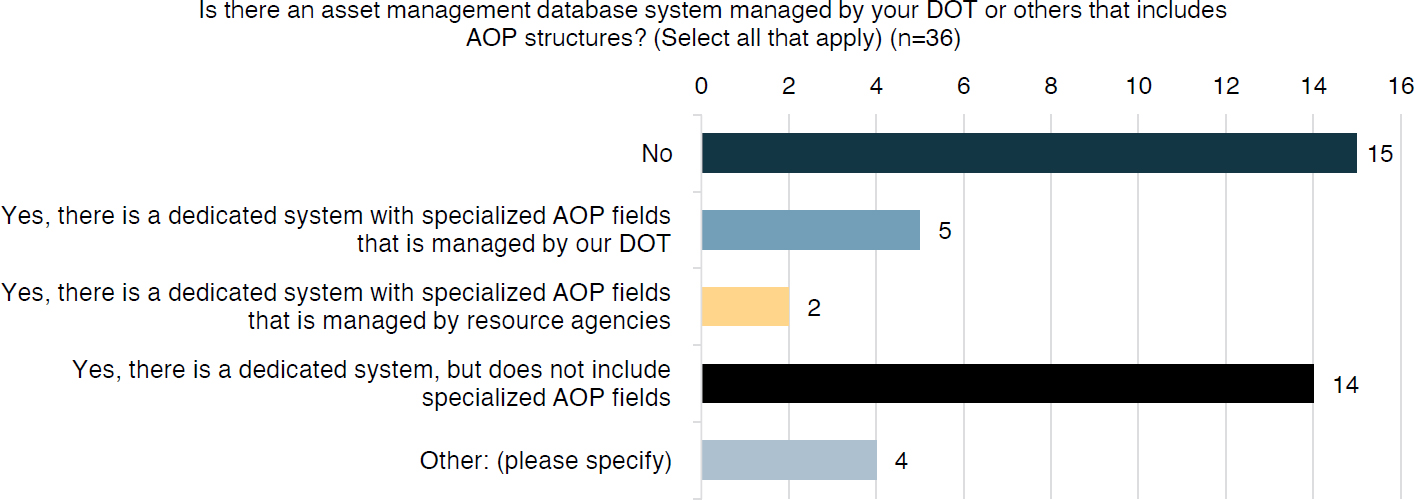
a dedicated system that does not include specialized AOP fields, 5 of the 36 responding DOTs (14%) maintain a dedicated system with specialized AOP fields managed by their state DOT, and 2 of the 36 responding DOTs (6%) have a dedicated system with specialized AOP fields managed by resource agencies. Four of the 36 DOT respondents (11%) selected “other” when questioned regarding their asset management database system; none of the four DOT respondents provided additional information.
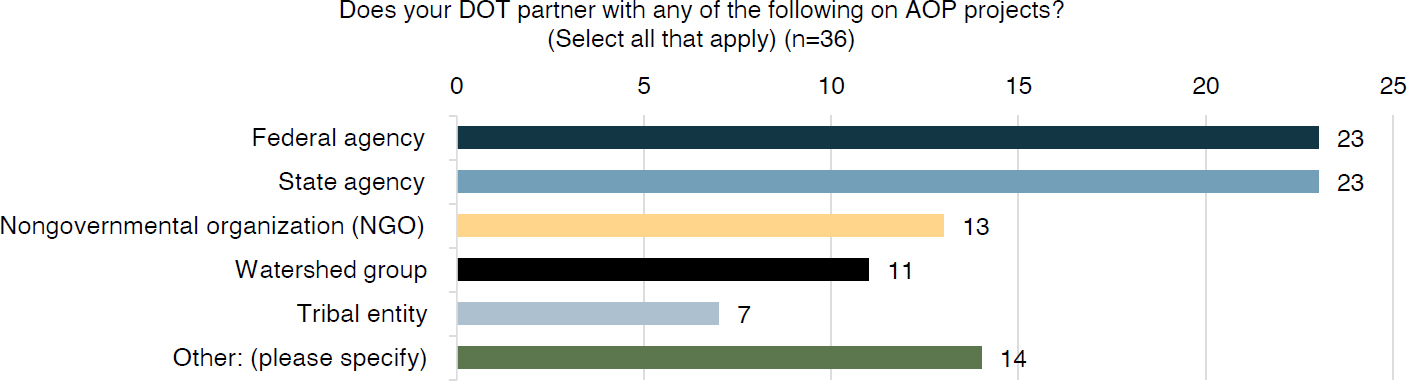
Figure 25 visually demonstrates the partnership between state DOTs and Tribal entities, watershed groups, nongovernmental organizations (NGOs), state agencies, and federal agencies on AOP projects. Depending on project location, several agencies or organizations may be invited or required to participate in stages of an AOP project to gather input. Of the 36 responses gathered, state agency and federal agency AOP project partnerships each account for 23 of 36 responses, with 64% of respondent DOTs participating in such collaborations. Of the 36 responses collected, 13 cooperate with NGOs (36%), 11 partner with watershed groups at their state or local level (31%), and seven cooperate with tribal entities (19%). Fourteen of 36 respondent state DOTs selected “other” (39%). Such survey respondents reported partnerships with the following entities:
- Local city agencies
- Universities
- Nature conservancies
- The state department of natural resources
- The state department of environmental management
- U.S. Army Corps of Engineers (USACE)
The selection of “other” allowed DOT respondents to provide context or information regarding AOP project partnerships; “other” responses are presented in Appendix B.
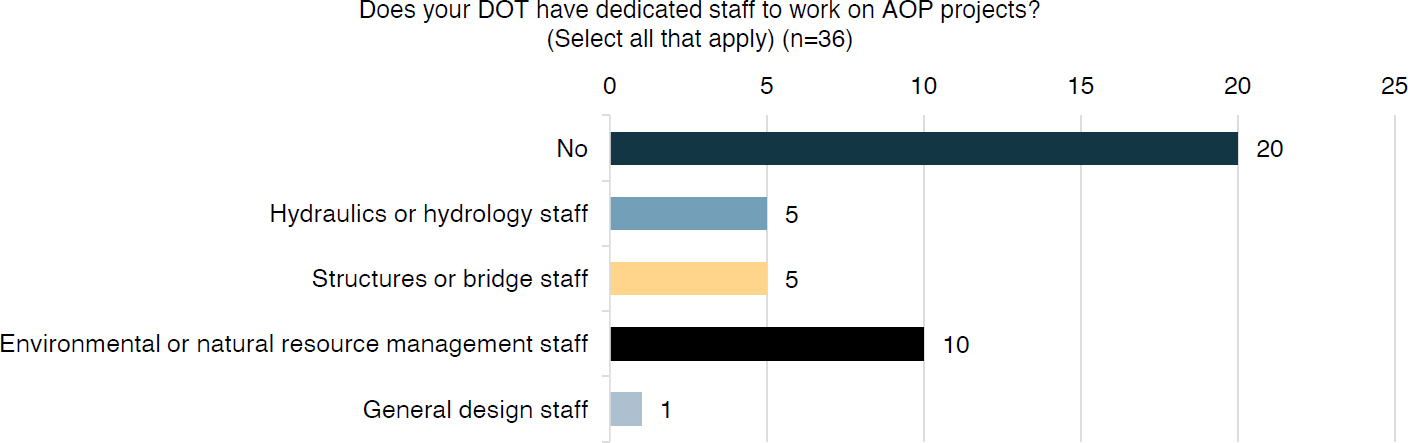
Responses revealed that 20 of 36 responding state DOTs (56%) do not maintain dedicated staff to work on AOP projects specifically, while 16 of 36 responding DOTs (44%) have staff specifically allocated as support for AOP projects. Of the responding DOTs that have dedicated staff, 10 of 16 have environmental or natural resource management staff (63%), 5 of 16 have hydraulics or hydrology staff (31%), 5 of 16 have structural or bridge staff (31%), and 1 of 16 has general design staff for dedicated work on AOP projects (6%), as shown in Figure 26.
Of the responding state DOTs that have designed, constructed, or owned water crossing structures that have been designed or retrofitted with consideration for AOP or fish passage, 25 of 36 respondents (69%) do not provide internal training to staff for AOP projects, while 11 of 36 (31%) do provide internal training to staff for AOP projects.