Visual Field Assessment and Disability Evaluation (2025)
Chapter: 1 Introduction
1
Introduction
The Social Security Administration (SSA) administers the Social Security Disability Insurance (SSDI) program (under Title II of the Social Security Act) and the Supplemental Security Income (SSI) program (Title XVI of the Social Security Act). SSDI pays monthly benefits to eligible adults with disabilities who have paid into the Disability Insurance Trust Fund and are unable to work because of severe long-term disabilities, as well as to their spouses and adult children. SSI is a means-tested program based on income and financial assets that provides income assistance from U.S. Treasury general funds to adults aged 65 and older, individuals who are blind, and adults and children with disabilities.
For adults, disability is defined by statute as the “inability to do any substantial gainful activity [defined by an earnings threshold] by reason of a medically determinable physical or mental impairment [or combination of impairments] which can be expected to result in death or which has lasted or can be expected to last for a continuous period of not less than 12 months.”1 Children under age 18 are considered disabled if they have “a medically determinable physical or mental impairment, which results in marked and severe functional limitations, and which can be expected to result in death or which has lasted or can be expected to last for a continuous period of not less than 12 months.”2 A finding of disability in both adults and children depends on the severity of functional limitations arising from the claimant’s impairment or combination of impairments.
___________________
1CFR § 404.1505
242 USC § 1382(c)
STUDY CHARGE AND SCOPE
In August 2024, SSA requested that the National Academies of Sciences, Engineering, and Medicine (National Academies) convene an ad hoc consensus study committee to review the latest published research and science on visual perimetry devices. The committee was charged with producing a report addressing best practices and known limitations in the use of visual perimeter devices to measure visual field loss in connection with the agency’s disability evaluations. This review was to include identifying the latest standards of care regarding measurement of an individual’s visual fields, as well as challenges in the provision of care. The committee also was asked to review the devices, techniques, and standards used by other federal agencies to make determinations of statutory blindness based on visual field loss. The committee’s statement of task is presented in Box 1-1. Box 1-2 provides definitions for the key terms used in this report. (Additional terms appearing in the report are defined in Appendix B.)
BOX 1-1
Statement of Task
The task order objectives for the ad hoc committee of the National Academies of Sciences, Engineering, and Medicine are to review the latest published research and science and produce a report addressing best practices and known limitations in the use of visual perimeter devices to measure visual field loss in connection with disability evaluations, including
- Describing the current practice landscape for the measurement of visual field impairment with visual perimeter devices, and recent changes or challenges in the provision of such care; and
- Answering the following questions based on published evidence (to the extent possible) and professional judgment (where published evidence is lacking):
- Is optical projection of the testing stimuli still a necessity to achieve valid and reliable results from a perimeter? How does the eye respond differently to projected stimulus vs. other types (e.g., LCD screens)?
- Do perimeters using frequency doubling technology produce substantially similar results to traditional perimeters and what differences are there?
PREVALENCE OF VISUAL FIELD LOSS AND ITS IMPACT ON QUALITY OF LIFE
The proportion of individuals impacted by visual impairment is significant (NASEM, 2016). Based on population-level studies, approximately 4.2 million adults in the United States experience visual impairment in their better-seeing eye after correction (Varma et al., 2016). Self-reported federal survey data suggest that this number may be even higher, with nearly 8 million Americans indicating blindness or difficulty seeing even while wearing corrective lenses (Rein et al., 2022). Furthermore, an estimated 7–8 million adults have uncorrectable refractive error (Flaxman et al., 2021; Varma et al., 2016). Moreover, the prevalence of visual impairment among U.S. preschool-aged children has been estimated to be as high as 5 percent (USPSTF, 2011).
There is also evidence that the prevalence of visual impairment will increase in the future. In the United States, the number of adults who are
- Is automatic kinetic perimetry a valid and reliable method of measuring visual field loss? What are the necessary device specifications and testing circumstances for automatic kinetic perimetry to produce valid and reliable visual field testing?
- What are the most widely acceptable and commonly used alternatives to kinetic perimetry, both manual and automated, for the measurement of visual field efficiency? What impacts do such alternative methods have on the validity and reliability of testing results?
- From a medical and practical perspective, is it still necessary for SSA to require three published clinical validation studies to find a perimeter acceptable or could fewer studies potentially show validity with similar reliability? If fewer validation studies could be acceptable, would there be higher requirements on the design or execution of those studies?
- What devices, techniques, and standards are other federal agencies using to make statutory blindness determinations based on visual field loss?
The report will include findings and conclusions but not recommendations.
visually impaired is projected to double by 2050, affecting nearly 7 million individuals (Varma et al., 2016).
High-quality population-based studies specifically estimating the prevalence of visual field loss are rare. However, the National Health and Nutrition Examination Survey (NHANES) included visual field examination until 2008. Of 4,897 NHANES participants over the age of 40 with complete eye examinations and eye health questionnaire data, 6.83 percent displayed unilateral or bilateral visual field loss (Bernstein et al., 2024). This represents two annual cycles of NHANES data collection, each of which enrolled a nationally representative cohort.
A wider examination of NHANES data analyzed data from 3 years of surveys, including all adults 40 years of age or older without a self-reported history of refracted surgery or age-related macular degeneration (Qiu et al., 2014). Participants needed only to successfully complete a perimetry examination to be included; thus NHANES may have included disproportionately
BOX 1-2
Definitions of Key Terms Used in This Report
Visual field is the total area of space a person can see when the eyes are focused on a central point. It includes both central vision and peripheral vision, which is the ability to see objects to the side or up and down while looking straight ahead.
Visual field meridians refer to imaginary lines that divide the visual field into equal sections, like pieces of a pie. Typically, the visual field is divided into eight equal sections, with the meridians radiating out from the central focus point. These radii are labeled in degrees moving counterclockwise from the 3 o’clock position (0, 45, 90, 135, 180, 225, 270, and 315 degrees for an eight-meridian scheme). The radii may also be labeled using anatomical references: nasally (0 degrees in the left eye and 180 degrees in the right eye), up nasally, superiorly (90 degrees in both eyes), up temporally, temporally (180 degrees in the left eye and 0 degrees in the right eye), down temporally, inferiorly (270 degrees in both eyes), and down nasally.
Visual perimeter device (perimeter) is a machine used to measure visual fields.
Visual perimetry is the systematic measurement of visual fields.
more individuals with visual field loss. This study found that 19 percent of participants had mild, moderate, or severe visual field defects (Qiu et al., 2014).
These estimates are similar to findings in other parts of the world. For example, the Rotterdam Study evaluated 6,250 older adult residents in Rotterdam, the Netherlands, and found the overall prevalence of visual field loss to be 5.6 percent (3.0 percent in those aged 55–64 and 17.0 percent in those aged 85 or older) (Ramrattan et al., 2001). The Beijing Eye Study, which included 4,369 subjects from Beijing, China, found the visual field loss prevalence to be 5.3 percent in subjects aged 40–49 and 25.4 percent in those aged 70 and older (Wang et al., 2006).
Visual field loss is associated with a number of conditions, including glaucoma, macular degeneration, retinal vascular occlusive disease, stroke, optic nerve conditions such as optic neuritis, and inherited retinal diseases such as retinitis pigmentosa. Visual field loss has a significant impact on quality of life and can result in varying degrees of disability, particularly with
Automated perimetry refers to automated presentation of the test stimulus and recording of patient responses.
Static perimetry refers to stationary stimuli presented at defined points in the visual field. Locations at which the stimulus is seen and not seen are recorded.
Threshold refers to the stimulus intensity that a person can detect on 50 percent of presentations.
Kinetic perimetry uses a moving stimulus that is generally moved from a nonseeing area to a seeing area in a systematic way to map the central and peripheral visual field boundaries, in addition to any scotomas, including blind spots. This movement can be automated, semiautomated, or manual.
Static automated threshold perimetry (static or standard automated perimetry),a or “white-on-white perimetry,” refers to the projection of a stationary white stimulus onto a white background to determine the probable threshold at chosen locations in the visual field. Blue on yellow static automated threshold perimetry is also available.
Automated (or automatic) kinetic perimetryb uses a moving stimulus of a selected size and intensity, with the speed and direction of the stimulus being automated.
Optical projection consists of projecting a light stimulus onto a background to present it to the patient’s eye in order to map the visual field.
Frequency doubling technology, used in some perimeters, is based on a flicker illusion, which essentially creates an image that appears double its actual spatial frequency. The stimulus does not move across the field, and the flickering is a proxy for the stimulus intensity used in either static or kinetic perimetry.
Visual acuity is a measure of the sharpness or clarity of vision at a given distance.
Visual acuity efficiency (Social Security Administration [SSA] definition) is expressed as a percentage corresponding to the best-corrected central visual acuity for distance in the better eye, based on a reference chart that aligns Snellen visual acuity metrics with visual acuity efficiency percentages (SSA, n.d.-a, 2.00A7b).
Visual acuity impairment value (SSA definition) is a value corresponding to the best-corrected central visual acuity for distance in the better eye, based on a reference chart using Snellen metrics.
Visual field efficiency (SSA definition) is expressed as a percentage corresponding to the visual field in the better eye, calculated by adding the number of degrees seen along the eight principal meridians found on a visual field chart and dividing by 5. For example, if the visual field is contracted down to 25 degrees in all eight meridians, the remaining visual field efficiency would be 25 × 8 ÷ 5 = 40 percent (SSA, n.d.-a, 2.00A7c).
Visual field impairment value (SSA definition) is a value corresponding to the visual field in a person’s better eye. It is calculated by dividing the
respect to daily functioning, including the ability to work; social engagement; and emotional well-being. Survey measures have been developed to quantitatively assess health-related quality of life (HRQoL) both in general and in the context of a person’s visual health. Cross-sectional and prospective studies found that both types of HRQoL measures varied linearly with visual field extent (McKean-Cowdin et al., 2007; Patino et al., 2011).
There have also been studies characterizing the impact of visual field loss on specific aspects of individuals’ lives. Individuals with moderate to
absolute value of the mean deviation from acceptable static automated threshold perimetry by 22 (SSA, n.d.-a).
Mean deviation is the average difference in visual field sensitivity across all measured locations compared with a normal, age-matched reference field.
Visual efficiency (SSA definition) is a calculated value of a person’s remaining visual function. Expressed as a percentage, it is calculated by multiplying an individual’s visual acuity efficiency percentage by their visual field efficiency percentage and dividing by 100. For example, if the visual acuity efficiency percentage is 75 and the visual field efficiency percentage is 40, the visual efficiency percentage is (75 × 40) / 100 = 30 percent (SSA, n.d.-a).
Visual impairment value (SSA definition) is a calculated value of a person’s loss of visual function, which is calculated by adding their visual acuity impairment value and their visual field impairment value (SSA, n.d.-a).
Statutory blindness refers to blindness as defined in the Social Security Act: (1) “central visual acuity of 20/200 or less in the better eye with the use of a correcting lens” or (2) “an eye that has a visual field limitation such that the widest diameter of the visual field subtends an angle no greater than 20 degrees” (Social Security Act, sections 216[i][1]; 1614[a][2]).
SOURCES: CHOP (n.d.); EyeWiki (2023, 2024); Medline Plus (2023); SSA (n.d.-a, -c).
__________________
a Multiple terms are used to refer to the same technology. This report preferentially uses the term static automated threshold perimetry to distinguish it from other types of perimetry (e.g., kinetic, manual, suprathreshold).
b Although automated (or automatic) kinetic perimetry is typically used in the literature, this report preferentially uses the term semiautomated kinetic perimetry to be more precise about the role of the technician in administering the test (see Chapter 5).
severe visual field loss may have difficulty performing routine tasks such as moving about and navigating different environments, as well as driving and reading, which leads in turn to greater reliance on others and reduced independence (Qiu et al., 2014; Turano et al., 2004). The loss can heighten the risk of injury due to impaired peripheral vision, making bumping into objects and falls more common (Patino et al., 2010; Qiu et al., 2014; Turano et al., 2004). Furthermore, studies show that people with visual field loss often suffer from a decline in mental health, including symptoms of anxiety
and depression, as they adapt to their diminished vision (Wang et al., 2017). Visual field loss also limits the ability to engage in social activities, thereby reducing overall social participation and contributing to feelings of isolation (Lange et al., 2021). The degree of impact varies depending on the severity of the field loss, with more profound impairment leading to greater disability and poorer quality of life (Qiu et al., 2014). Furthermore, when coupled with other chronic conditions that affect many working adults (e.g., depression, stroke, cardiac conditions), visual field loss significantly increases the potential impact of these conditions on a person’s ability to perform various tasks (NASEM, 2016).
SSA’S DISABILILTY EVALUATION PROCESS3
SSA uses a five-step process based on medical–vocational evaluations to determine whether an adult meets the definition of disability. After SSA determines an applicant’s administrative eligibility and the presence of a medical impairment of sufficient duration and severity in steps 1 and 2 of this process, it assesses, in step 3, whether the applicant’s impairment meets or medically equals the criteria listed for a condition in SSA’s (n.d.-b) Listing of Impairments-Adult Listings (listings). The Adult Listings are organized by major body system and describe impairments that SSA considers to be sufficiently severe to prevent an applicant from performing any gainful activity, regardless of age, education, or work experience. Step 3 is used as a “screen-in” step, meaning if an individual is not found to qualify for disability benefits at this step, they are not denied; rather, the assessment moves on to step 4. If an impairment is severe but does not meet or medically equal any listing, SSA assesses in step 4 whether the applicant’s physical or mental residual functional capacity allows the person to perform past relevant work. Applicants who are able to perform past relevant work are denied benefits, while those who are unable to do so proceed to step 5. At step 5, SSA considers, in combination with the applicant’s residual functional capacity, such vocational factors as age, education, and work experience, including transferable skills, in determining whether the individual can perform other work in the national economy. Applicants determined to be unable to adjust to performing other work are allowed benefits, while those determined able to adjust are denied.
Disability determinations in children follow a three-step sequential evaluation process. After determining administrative eligibility and the presence of a medical impairment of sufficient duration and severity, SSA assesses in step 3 whether the impairment(s) meets, medically equals (is equivalent
___________________
3The text in this section is taken from NASEM, 2022, pp. 14–15.
in severity to), or functionally equals (i.e., the impairment[s] results in functional limitations equivalent in severity to) the criteria in SSA’s (n.d.-d) Child Listings.4 If a child’s impairment or combination of impairments “does not meet or medically equal any listing, [SSA] will decide whether it results in limitations that functionally equal the listings.”5 SSA refers to limitations that functionally equal the listings as being functionally equivalent to the listings. SSA’s technique for determining functional equivalence is a “whole child” approach that “accounts for all of the effects of a child’s impairments singly and in combination—the interactive and cumulative effects of the impairments—because it starts with a consideration of actual functioning in all settings” (SSA, 2009, p. 7527).
For both adults and children, disability claims related to visual field loss are evaluated under listings for the Special Senses and Speech body system.6
SSA’S CURRENT STANDARDS FOR MEASURING VISUAL FIELDS
The Special Senses and Speech listings for both adults and children (SSA, n.d.-a, 2.00; n.d.-c, 102.00) specify criteria for the evaluation of visual disorders for the purposes of SSA disability determinations. These criteria describe the degree of impairment necessary for an individual to qualify for disability benefits because of their eyesight alone. These criteria, and the associated introductory text in the listing, include requirements for how visual field loss must be measured in order to meet the criteria. Generally, SSA requires that visual field testing, or perimetry, be carried out using automated static threshold perimetry7 performed on a perimeter meeting defined requirements. Kinetic perimetry meeting similarly defined requirements can also be used unless a specific listing states otherwise, or an applicant’s impairment results in a significant limitation in the central visual field. SSA also has a specific criterion using a metric called visual field efficiency, which can only be measured with kinetic perimetry.
Within the Special Senses and Speech listings, there are six pathways through which individuals can qualify for disability benefits because of visual impairment (see Table 1-1). Each pathway refers to a benchmark for visual acuity, visual field diameter, or both. Annex Table 1-1 contains
___________________
420 CFR § 416.926; 20 CFR § 416.926a
520 CFR § 416.926a
6The Special Senses and Speech listings for adults are available at https://www.ssa.gov/disability/professionals/bluebook/2.00-SpecialSensesandSpeech-Adult.htm (accessed January 28, 2025). Those for children are available at https://www.ssa.gov/disability/professionals/bluebook/102.00SpecialSensesandSpeech-Childhood.htm (accessed January 28, 2025).
7Automated static threshold perimetry is the same as static automated threshold perimetry, which is the term this report uses preferentially.
| SSA Listing Section | Description | Static vs. Kinetic Perimetry | Testing Requirement | Meets Criteria for Statutory Blindness | Qualifies for SSA Disability Benefits |
|---|---|---|---|---|---|
| 2.02 | Central visual acuity of 20/200 or less in the better eye with correction | n/a | Testing with Snellen eye chart or comparable testing methodology | Yes | Yes |
| 2.03A | Widest visual field diameter (through central fixation) no greater than 20 degrees | Static automated threshold perimetry; manual or semiautomated kinetic perimetry | Size III/4e stimulus and white background (31.5 asb) | Yes | Yes |
| 2.03B | Mean deviation of 22 decibels or greater in the central 30 degrees of the visual field (30 degrees from the point of fixation) | Static automated threshold perimetry | Automated static threshold perimetry with a white size III stimulus, using 30-2 pattern | No | Yes |
| 2.03C | Visual field efficiency of 20 percent or less | Manual or semiautomated kinetic perimetry | Size III/4e stimulus across 8 principal meridians | No | Yes |
| 2.04A | Visual efficiency (VAE × VFE ÷ 100) of 20 percent or less after best correction | See Section 2.03C | See Sections 2.02 and 2.03C | No | Yes |
| 2.04B | Visual impairment (VAI + VFI) of 1.0 or greater | See Section 2.03B | See Sections 2.02 and 2.03B | No | Yes |
NOTES: asb = apostilb; VAE = visual acuity efficiency; VAI = visual acuity impairment value; VFE = visual field efficiency; VFI = visual field impairment value.
SOURCES: SSA (n.d.-a, -c).
selected excerpts relevant to visual field testing from the listings and another SSA policy document.
Two of the six pathways refer to the federal definition of statutory blindness. Meeting the criteria for statutory blindness requires either “central visual acuity of 20/200 or less in the better eye with the use of a correcting lens” (SSA, n.d.-a, 2.00A2a; n.d.-c, 102.02) or “a visual field limitation such that the widest diameter of the visual field [does not exceed]
20 degrees” (SSA, n.d.-a, 2.03A; n.d.-c, 102.03A). Individuals who satisfy the criteria for statutory blindness automatically qualify for SSA disability benefits. Qualification for benefits under the visual field definition of statutory blindness in Section 2.03A requires the use of a visual field test measuring the central 24–30 degrees from the point of fixation. No specific method is mentioned beyond that requirement, meaning that any static or kinetic perimetric method otherwise accepted by SSA can be used to qualify for disability benefits under Section 2.03A.
Individuals who do not meet the criteria for statutory blindness may still qualify for disability benefits under alternative provisions, including Sections 2.03B, 2.03C, 2.04A, or 2.04B. These provisions account for cases in which visual acuity and visual field loss fall short of the stricter statutory blindness definition but still demonstrate significant impairment. Sections 2.03B and 2.03C consider visual field extent alone, while Sections 2.04A and 2.04B consider visual field extent and visual acuity combined. Importantly, SSA policies note that qualifying for disability benefits under one of these sections does not mean an applicant is legally blind, a designation that holds a specific meaning throughout the statute.
Section 2.03B refers to a metric called mean deviation or mean defect. Mean deviation, typically reported in decibels (dB), reflects the average loss of sensitivity across a person’s visual field, using the typical visual field as a standard. In perimetry, stimulus intensity is measured in dB. At different locations in the visual field, a person may not be able to see stimuli of lesser intensity. The deviation at a single location in the visual field is the difference between the minimum intensity the examinee can see and the minimum intensity a typical person can see.
Mean deviation is the average deviation in sensitivity across all measured visual field locations. For a determination of disability under Section 2.03B, SSA requires measurements from automated static threshold perimetry (SSA, n.d.-a, 2.00A6d). Section 2.03B requires “automated static threshold perimetry,” also known as static automated perimetry, which displays a stimulus at different locations in the examinee’s field of view. The examinee indicates when they see the stimulus, and the perimeter statistically calculates the extent of the examinee’s visual field. Chapter 3 provides a more detailed discussion of the methodology of static automated threshold perimetry. For the purposes of Section 2.03B, the perimeter used must also measure the central 30 degrees of the visual field. If, within those central 30 degrees, an applicant’s mean deviation is 22 dB or worse, they will qualify for disability benefits under this section.
For determination of disability under Section 2.03C, SSA considers a measurement known as visual field efficiency (SSA, n.d.-a, 2.00A7c). Visual field efficiency essentially corresponds to the percentage of a typical visual field that a person can see through their better eye. SSA calculates visual field efficiency
by summing the number of degrees at which the examinee can see a stimulus across each of eight “principal meridians” of the eye and then dividing by 5. The principal meridians are located at 0, 45, 90, 135, 180, 225, 270, and 315 degrees radially around the eye, moving counterclockwise from 3 o’clock (Figure 1-1). Since the typical visual field will have a sum of 500 degrees across its principal meridians, dividing the sum by 5 yields a percentage for visual field efficiency. A visual field efficiency of 20 percent or less qualifies an applicant for disability benefits under Section 2.03C. As noted above, measurement of visual field efficiency requires the use of kinetic perimetry, the methodology for which is discussed in Chapter 5.
Section 2.04A and 2.04B allow for a determination of disability based on combined metrics of visual acuity and visual field loss. These pathways ensure that individuals with extensive visual field loss or combined impairments can still be assessed fairly. Parallel listings for children can be found in Sections 102.03 and 102.04.
Section 2.04A references a measure called visual efficiency, not to be confused with visual field efficiency (SSA, n.d.-a, 2.00A7d). Visual efficiency is a broader measure that includes both visual field efficiency and visual acuity efficiency. Visual acuity efficiency is determined using a reference
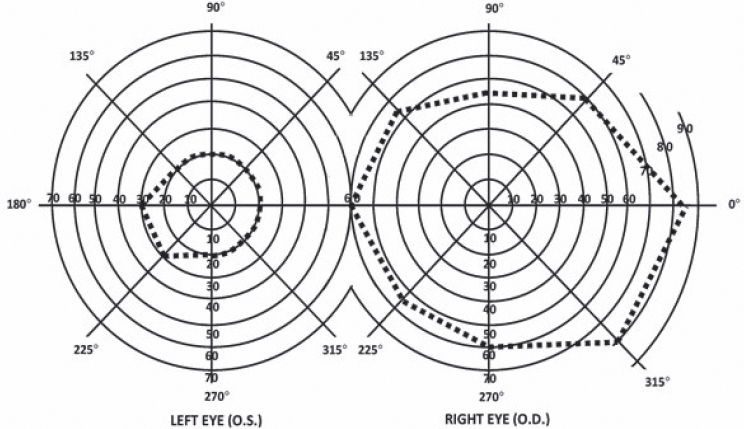
NOTE: The diagram for the right eye shows a typical visual field extent drawn in dashed lines. The diagram for the left eye shows a constrained visual field; a healthy visual field would be a mirror image of the right eye’s field shape. In addition, the degrees assigned to each meridian are not mirrored and instead remain the same.
SOURCE: SSA (n.d.-a, 2.00A7cB).
chart that aligns Snellen visual acuity metrics with visual acuity efficiency percentages (e.g., 20/20 corresponds to 100 percent; 20/100 corresponds to 50 percent) (SSA, n.d.-a, 2.00A7b). Visual efficiency is calculated by multiplying an applicant’s visual field efficiency by their visual acuity efficiency and dividing by 100. A visual efficiency of less than 20 percent after best correction qualifies a person for disability benefits under Section 2.04A. Since the calculation of visual efficiency requires a measure of visual field efficiency, it, too, requires the use of kinetic perimetry.
Finally, Section 2.04B references a measure called visual impairment value. The visual impairment value is the sum of the “impairment values” for both visual acuity and visual field (see SSA, n.d.-a, 2.00A8d). The visual field impairment value is the mean deviation, calculated using static automated threshold perimetry as for Section 2.03B, divided by 22. The visual acuity impairment value is read from a reference chart using Snellen metrics (SSA, n.d.-a, 2.00A8b). If the sum of these two impairment values is 1.00 after best correction or greater, the applicant qualifies for disability benefits.
STUDY APPROACH
To carry out its charge, the committee met four times to discuss the questions posed in the statement of task (Box 1-1). At the second meeting, a public information-gathering session was held, in which speakers were invited for three panel discussions. The discussion topics were disparities and opportunities in access to vision testing, lived experiences with visual impairment and applying for SSA disability benefits, and emerging technologies in visual field testing.
The panel on disparities and opportunities in access to vision testing, along with the lived experiences panel, guided the committee’s understanding of challenges in providing care. Through these panels, the committee heard how visual impairment can affect employment, day-to-day life, and general well-being. Specifically, the committee heard about the vastly different experiences of panelists who needed visual field tests to qualify for SSA disability benefits with respect to whether they were able to receive such tests or whether such a test was even offered. As a result, some panelists experienced increased confusion while navigating their condition and the SSDI application process, and in some cases, panelists’ diagnosis or approval for benefits was delayed. Panelists also discussed how cost, unfamiliarity with screening devices, and the possible need to visit more than one clinician for treatment were barriers to receiving vision care.
Focusing on the specific difficulties people encounter when applying for disability due to vision impairment became a helpful framing for the committee. SSA requires that applicants’ medical records include certain documentation and test results related to their disabilities. If the required
tests are not accessible, an individual may find it difficult or even impossible to be approved for disability benefits.
Some perimetry devices are less expensive than others for clinics to acquire or use, or they may not have personnel properly trained to use some perimeters. Other devices are easier for the examinee to use comfortably. In some cases, the only clinic accessible to an applicant has only a perimeter deemed unacceptable by SSA. A central goal of the committee in developing this report was to aid SSA in understanding how best to broaden the scope of acceptable perimeters while maintaining standards of reliability and validity. The committee was also guided by a previous National Academies report, Visual Impairments: Determining Eligibility for Social Security Benefits (NRC, 2002).
For each of the specific questions in the statement of task, National Academies staff aided committee members in conducting literature searches. The committee then discussed and reached consensus on conclusions for each question based on the published evidence, and where such evidence was lacking, the committee members’ professional judgment. Additionally, staff performed a broad scoping search of perimetry validation studies published since 2002. This review supported the committee’s discussion of essential elements of an effective perimetry validation study while helping to ensure that those standards were achievable. The key words used in the search were (“visual field test*” OR perimetry) AND validat*. Included were studies assessing or validating new perimeters and comparison of perimeters. Excluded were studies not analyzing perimetry, those using perimetry but that do not have a standard reference comparator, structure–function papers, analysis of data or statistical modeling of existing perimeters, deep learning models, and vision-related activity scales. Searches in Medline, Scopus, and Embase yielded 832 results after duplicates were eliminated. Committee members and staff screened those papers, narrowing those results down to 68 papers for review.
ORGANIZATION OF THE REPORT
Chapter 2 addresses the topic of which devices, techniques, and standards other federal agencies are using to make statutory blindness determinations based on visual field loss. Chapter 3 introduces basic concepts in perimetry and provides an overview of current practice in the measurement of visual fields, recent changes in practice, variability and challenges in the measurement of visual fields, and new technologies that could ameliorate some of the systems-level challenges. Chapter 4 reviews key considerations in evaluating new perimetry techniques. Chapter 5 responds to some of the specific topics in the statement of task, including optical projection, static compared with kinetic perimetry, alternatives to kinetic perimetry for
measuring visual field efficiency, frequency doubling technology, and specific considerations for pediatric populations.
REFERENCES
Bernstein, I. A., A. C. Fisher, K. Singh, and S. Y. Wang. 2024. The association between frailty and visual field loss in US adults. American Journal of Ophthalmology 257 (January):38–45.
CHOP (Children’s Hospital of Philadelphia). n.d. Functional vision. https://www.chop.edu/conditions-diseases/functional-vision (accessed January 29, 2025).
EyeWiki. 2023. Frequency doubling technology. https://eyewiki.org/Frequency_Doubling_Technology (accessed January 29, 2025).
EyeWiki. 2024. Standard automated perimetry. https://eyewiki.org/Standard_AutomatedPerimetry#Manual_vs._Automated_Perimetry (accessed January 29, 2025).
Flaxman, A. D., J. S. Wittenborn, T. Robalik, R. Gulia, R. B. Gerzoff, E. A. Lundeen, J. Saaddine, D. B. Rein, and Vision and Eye Health Surveillance System Study Group. 2021. Prevalence of visual acuity loss or blindness in the US: A Bayesian meta-analysis. JAMA Ophthalmology 139(7):717–723.
Lange, R., A. Kumagai, S. Weiss, K. B. Zaffke, S. Day, D. Wicker, A. Howson, K. T. Jayasundera, L. Smolinski, and C. Hedlich. 2021. Vision-related quality of life in adults with severe peripheral vision loss: A qualitative interview study. Journal of Patient-Reported Outcomes 5:1–12.
McKean-Cowdin, R., R. Varma, J. Wu, R. D. Hays, and S. P. Azen. 2007. Severity of visual field loss and health-related quality of life. American Journal of Ophthalmology 143(6):1013–1023.
Medline Plus. 2023. Visual field. https://medlineplus.gov/ency/article/003879.htm (accessed January 29, 2025).
NASEM (National Academies of Sciences, Engineering, and Medicine). 2016. Making eye health a population health imperative: Vision for tomorrow. Washington, DC: The National Academies Press.
NASEM. 2022. Selected heritable disorders of connective tissues and disability. Washington, DC: The National Academies Press.
NRC (National Research Council). 2002. Visual impairments: Determining eligibility for Social Security benefits. Washington, DC: The National Academy Press.
Patino, C. M., R. McKean-Cowdin, S. P. Azen, J. C. Allison, F. Choudhury, R. Varma, and Los Angeles Latino Eye Study Group. 2010. Central and peripheral visual impairment and the risk of falls and falls with injury. Ophthalmology 117(2):199–206.e1.
Patino, C. M., R. Varma, S. P. Azen, D. V. Conti, M. B. Nichol, and R. McKean-Cowdin. 2011. The impact of change in visual field on health-related quality of life the Los Angeles Latino eye study. Ophthalmology 118(7):1310–1317.
Qiu, M., S. Y. Wang, K. Singh, and S. C. Lin. 2014. Association between visual field defects and quality of life in the United States. Ophthalmology 121(3):733–740.
Ramrattan, R. S., R. C. Wolfs, S. Panda-Jonas, J. B. Jonas, D. Bakker, H. A. Pols, A. Hofman, and P. T. de Jong. 2001. Prevalence and causes of visual field loss in the elderly and associations with impairment in daily functioning: The Rotterdam study. Archives of Ophthalmology 119(12):1788–1794.
Rein, D. B., J. S. Wittenborn, P. Zhang, F. Sublett, P. A. Lamuda, E. A. Lundeen, and J. Saaddine. 2022. The economic burden of vision loss and blindness in the United States. Ophthalmology 129(4):369–378.
SSA (U.S. Social Security Administration). 2007. SRR 07-01p: Titles II and XVI: Evaluating visual field loss using automated static threshold perimetry. Federal Register 72(146):41796. https://www.ssa.gov/OP_Home/rulings/di/01/SSR2007-01-di-01.html (accessed February 3, 2025).
SSA. 2009. SSR 09-1p: Title XVI: Determining childhood disability under the functional equivalence rule—The “whole child” approach. Federal Register 74(30):7527. https://www.ssa.gov/OP_Home/rulings/ssi/02/SSR2009-01-ssi-02.html (accessed January 28, 2025).
SSA. n.d.-a. Disability evaluation under Social Security—2.00 special senses and speech—Adult. https://www.ssa.gov/disability/professionals/bluebook/2.00-SpecialSensesandSpeech-Adult.htm (accessed February 3, 2025).
SSA. n.d.-b. Disability evaluation under Social Security—Listing of impairments—Adult listings (Part A). https://www.ssa.gov/disability/professionals/bluebook/AdultListings.htm (accessed January 28, 2025).
SSA. n.d.-c. Disability evaluation under Social Security—102.00 special senses and speech—Childhood. https://www.ssa.gov/disability/professionals/bluebook/102.00-SpecialSensesandSpeech-Childhood.htm (accessed February 3, 2025).
SSA. n.d.-d. Disability evaluation under Social Security—Listing of impairments—Childhood listings (Part B). https://www.ssa.gov/disability/professionals/bluebook/ChildhoodListings.htm (accessed January 28, 2025).
Turano, K. A., A. T. Broman, K. Bandeen-Roche, B. Munoz, G. S. Rubin, S. West, and SEE Project Team. 2004. Association of visual field loss and mobility performance in older adults: Salisbury Eye Evaluation Study. Optometry and Vision Science 81(5):298–307.
USPSTF (U.S. Preventive Services Task Force). 2011. Evidence summary: Visual impairment in children ages 1-5: Screening. https://www.uspreventiveservicestaskforce.org/uspstf/document/evidence-summary5/visual-impairment-in-children-ages-1-5-screening-2011
Varma, R., T. S. Vajaranant, B. Burkemper, S. Wu, M. Torres, C. Hsu, F. Choudhury, and R. McKean-Cowdin. 2016. Visual impairment and blindness in adults in the United States: Demographic and geographic variations from 2015 to 2050. JAMA Ophthalmology 134(7):802–809.
Wang, Y., L. Xu, and J. B. Jonas. 2006. Prevalence and causes of visual field loss as determined by frequency doubling perimetry in urban and rural adult Chinese. American Journal of Ophthalmology 141(6):1078–1086.
Wang, Y., S. Alnwisi, and M. Ke. 2017. The impact of mild, moderate, and severe visual field loss in glaucoma on patients’ quality of life measured via the Glaucoma Quality of Life-15 questionnaire: A meta-analysis. Medicine 96(48):e8019.
| Reference | Excerpted text |
|---|---|
| 2.00 (Adult)a 102.00 (Child) | |
| 2.00A6a 102.00A6a | 6. How do we measure visual fields? |
| |
| 2.00A6c 102.00A6c |
|
| 2.00A6d 102.00A6d |
|
| 2.00A9 102.00A9 | 9. What are our requirements for an acceptable perimeter? We will use results from automated static threshold perimetry performed on a perimeter that:
|
| Reference | Excerpted text |
|---|---|
| 2.00A6b 02.00A6b | b. Automated static threshold perimetry requirements.
|
| 2.00A7 102.00A7 | 7. How do we determine your visual acuity efficiency, visual field efficiency, and visual efficiency?
|
| Reference | Excerpted text |
|---|---|
| 2.00A6e 102.00A6e | e. Other types of perimetry. If the evidence in your case contains visual field measurements obtained using manual or automated kinetic perimetry, such as Goldmann perimetry or the HFA “SSA Test Kinetic,” we can generally use these results if the kinetic test was performed using a white III4e stimulus projected on a white 31.5 asb (10 cd/m2) background. Automated kinetic perimetry, such as the HFA “SSA Test Kinetic,” does not detect limitations in the central visual field because testing along a meridian stops when you see the stimulus. If your visual disorder has progressed to the point at which it is likely to result in a significant limitation in the central visual field, such as a scotoma (see 2.00A6h), we will not use automated kinetic perimetry to determine the extent of your visual field loss. Instead, we will determine the extent of your visual field loss using automated static threshold perimetry or manual kinetic perimetry. |
| 2.00A6g 102.00A6g | g. Use of corrective lenses. You must not wear eyeglasses during visual field testing because they limit your field of vision. You may wear contact lenses to correct your visual acuity during the visual field test to obtain the most accurate visual field measurements. For this single purpose, you do not need to demonstrate that you have the ability to use the contact lenses on a sustained basis. |
| 2.00A6h 102.00A6h | h. Scotoma. A scotoma is a field defect or non-seeing area (also referred to as a “blind spot”) in the visual field surrounded by a normal field or seeing area. When we measure your visual field, we subtract the length of any scotoma, other than the normal blind spot, from the overall length of any diameter on which it falls. |
| 2.02 102.02 | Loss of Central Visual Acuity. Remaining vision in the better eye after best correction is 20/200 or less. |
| 2.03 102.03 | Contraction of the visual field in the better eye, with: |
| |
| OR | |
| |
| OR | |
| |
| 2.04 102.04 | Loss of visual efficiency, or visual impairment, in the better eye: |
| |
| OR | |
|
| Reference | Excerpted text |
|---|---|
| SSR 07-01p | |
| Policy Interpretation, Step 2 | Step 2—Are the test results reliable? |
| Each perimeter manufacturer will identify factors that are used to determine whether the test results are reliable. | |
| For the Humphrey Field Analyzer, the reliability factors are fixation losses, false positive errors, and false negative errors. Information about these factors is at the top of the chart (see Exhibits 1 and 2). The test results are not reliable for evaluating visual field loss if the fixation losses exceed 20 percent, or if the false positive errors or false negative errors exceed 33 percent. | |
| Even when the reliability factors are within the manufacturer’s specifications, we will not use the test results to evaluate visual field loss if there is other information in the case file that suggests that the results are not valid; for example, the test results are inconsistent with the clinical findings or the individual’s daily activities. |
a The original source contains links to other portions of the 2.00 Special Senses and Speech—Adult listing.
SOURCES: SSA (n.d.-a,-c; 2007).


