Visual Field Assessment and Disability Evaluation (2025)
Chapter: 3 Current and Emerging Practice in Visual Field Testing
3
Current and Emerging Practice in Visual Field Testing
Perimetry, also known as visual field testing, is an essential diagnostic tool for assessing various ophthalmic conditions, including glaucoma, optic neuropathies, and disorders affecting the retina and visual pathways. Box 3-1 depicts some types of field losses associated with different ophthalmic conditions. Static automated threshold perimetry (SAP), also commonly referred to as standard automated perimetry, measures the sensitivity of an individual’s visual field at specific test locations (within 10, 24, or 30 degrees from the point of central fixation1 depending on the testing pattern employed) and has the capability to compare the findings with a database of previously tested patients with normal vision. SAP employs white stimuli against white backgrounds and is valuable not only for initial diagnosis but also for monitoring disease progression and guiding treatment decisions (Ruia and Tripathy, 2023). In glaucoma care, SAP is the primary method used to assess visual field loss and monitor changes over time (AAO, 2020; AOA, 2024).
In this report, perimetry refers to the general technique of measuring visual fields by mapping threshold sensitivities in the central and peripheral fields. Perimetry utilizes a variety of specific instruments and testing protocols, including the most recognizable and conventional methods—Humphrey static automated perimetry and Goldmann manual kinetic perimetry—in addition to newer methods using novel display types, such as head-mounted virtual reality displays. In addition, optokinetic perimetry holds promise for assessing
___________________
1Point of central fixation or central fixation refers to the point where an examinee focuses their gaze during a visual field test, essentially serving as the center and reference point for mapping the extent and sensitivity of the visual field.
BOX 3-1
Types of Visual Field Losses
A variety of ophthalmic conditions can cause different types of visual field impairment, as illustrated in Figure 3-1 below. Glaucoma can lead to tunnel vision, which worsens as the condition progresses, as shown in Panel B. Glaucoma can also result in one or more typically arcuate scotomas (an area within the visual field in which stimuli are not seen at an intensity expected in that location, resulting in areas of blurry vision), and diabetic retinopathy can result in multiple scotomas, as shown in Panel C. Damage to the visual cortex on one side of the brain, such as from a stroke or head injury, can result in hemianopia, which is the loss of half the visual field, as shown in Panels D1 and D2. These panels depict different examples of hemianopia for a single eye. In D1, the affected half of the field is still visible but is very blurry; in D2, the affected left half of the field is entirely absent. Advanced age-related macular degeneration can result in a blurry area in the center of the visual field, as shown in (Panel E).
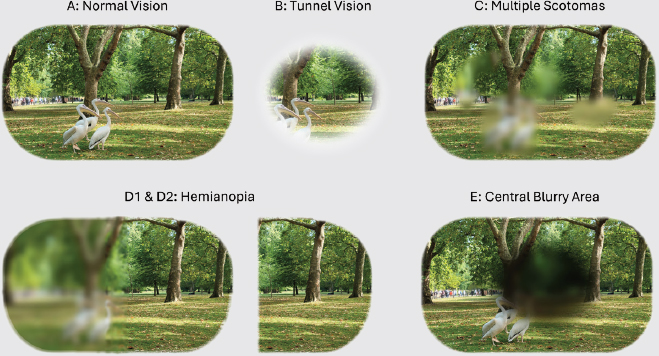
Photo credit: Tina M. Winters.
individuals who are unable to maintain fixation on a central location. This chapter presents an overview of the fundamentals of perimetry and the current practice landscape for the measurement of visual field impairment with perimetry devices, describes recent changes and challenges in the provision of such care, and provides a summary of emerging perimetry technologies.
FUNDAMENTALS OF PERIMETRY
The visual field is the extent of an area visible to an individual during steady fixation of the eye in any one gaze or direction. It can be pictured as a “hill of vision” (see Figure 3-1), a concept first introduced by Harry Traquair (1947, p. 4) that represents the visual field as a “hill of vision surrounded by a sea of blindness.” Retinal sensitivity is highest at the fovea and deceases toward the periphery (Ruia and Tripathy, 2023; Weber and Caprioli, 2000). This concept is represented in perimetry output as a central peak in sensitivity at the fixation point, with sensitivity gradually decreasing in all directions. Loci of equal sensitivity on this surface form isosensitivity contours (isopters), analogous to contour lines on a topographic map or isobars on a meteorological map. Closely spaced isopters indicate a steep slope in visual sensitivity, while widely spaced ones reflect a gentler slope. At the outermost edge of the visual field, the island of vision descends into a “sea of blindness,” signifying a complete lack of perception beyond the peripheral boundary (Schiefer et al., 2005). Temporally, or at the outer boundaries of the visual field toward the temple, the slope is less steep compared with the region immediately surrounding the fovea (see Figure 3-2).
The Social Security Administration (SSA) considers the normal visual field to extend approximately 60 degrees nasally (toward the nose) and inferiorly (downward), 45 degrees superiorly (upward), and 85 degrees
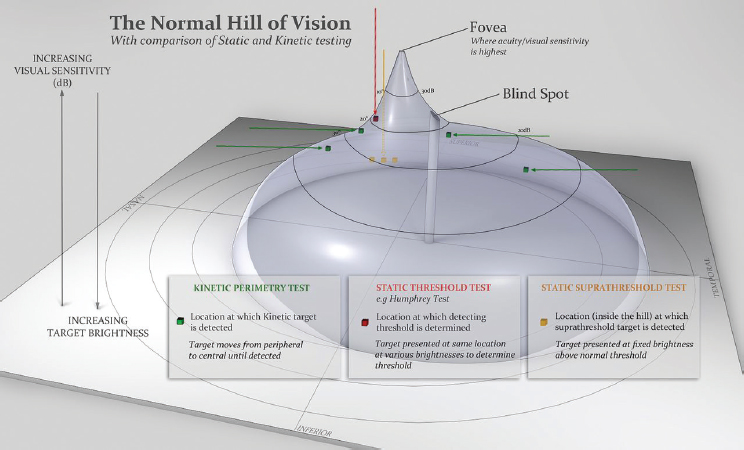
SOURCE: Wong and Plant (2015), reproduced with permission from BMJ Publishing Group Ltd.
temporally (in the opposite direction from the nose) (SSA, n.d.-a [Listings], Figure 1; see also footnote 3 in Chapter 5). The standard unit for measuring the visual field is differential light sensitivity, which defines the threshold for detecting a test object relative to its background, also known as the surround. Visual sensitivity is expressed in decibels (dB), which is a logarithmic unit. As discussed below, a larger value for the number of decibels (e.g., 35 dB vs. 15 dB) indicates greater attenuation of the stimulus and corresponds to increased visual sensitivity.
Decibels, a relative logarithmic unit of attenuation, rather than objective units of luminosity, are used because of Weber’s law. Weber’s law states that the change in light intensity required to elicit a noticeable response from the visual system is proportional to the previous light intensity. Mathematically speaking, this means that the patient’s perception of contrast during perimetry is proportional to the logarithm of the difference in intensity between the stimulus and the background. As a result, visual sensitivity is usually reported on a decibel scale. It is similar to the use of decibels to report sound intensities; sounds, like visual stimuli, are perceived as sensory signals that differ in intensity from one another. The law holds closely at normal daylight levels (known as photopic light levels) but breaks down at twilight (mesopic) and low light (scotopic) levels.
With age, visual field sensitivities and limits decline (Weber and Caprioli, 2000), illustrating the importance of normative databases that represent the full range of age and other demographic characteristics. Normative data may or may not be stratified by age, depending on which data point is being considered. Acuity norms are not age adjusted, but visual field sensitivities are.
A normal visual field relies on several anatomical factors: clear optical media, proper focus of the retinal image, and healthy afferent visual pathways. These pathways include photoreceptors and bipolar and ganglion cells in the retina, ganglion cell axons in the optic nerves and tracts, the lateral geniculate body, the optic radiations, and the neuronal components of the primary visual cortex (Schiefer et al., 2005). Figure 3-3 depicts a simplified graphic of this pathway. Note, however, that the direct connection depicted between bipolar cells and ganglion cells does not occur in mammalian eyes; instead, there are other types of cells such as AII amacrine cells involved in this pathway (Kolb, 1995).
There are two broad categories of perimetry in conventional use today: static perimetry and kinetic perimetry. In static perimetry, a stationary stimulus is presented one at a time at specific points in the visual field, and the examinee reports when they see a stimulus. In kinetic perimetry, which can be manual, automated, or semiautomated, a stimulus is typically moved from a nonseeing to a seeing area with the patient reporting when they first see it. Both are commonly conducted using a hemispherical surface onto which the visual field is mapped (see Figure 3-4). The examined eye is positioned near the geometric center of the hemisphere, ensuring that
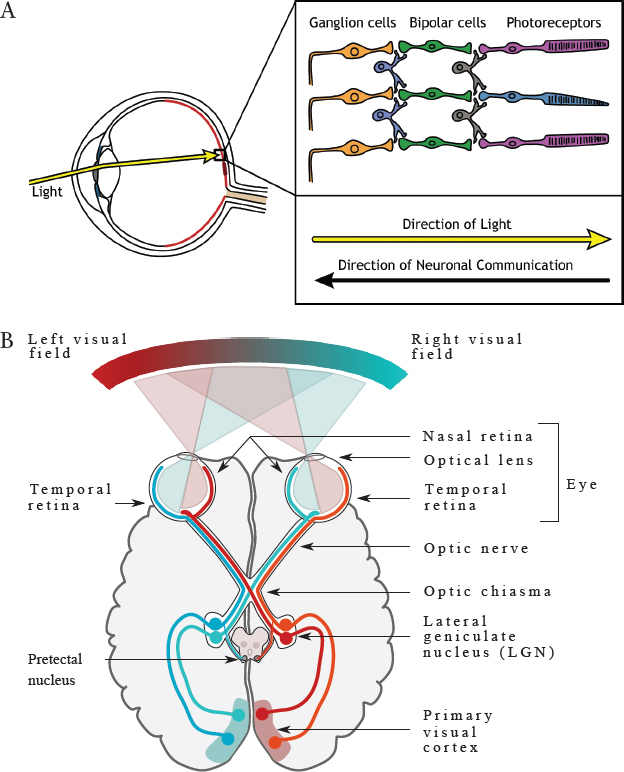
SOURCE: Panel A: Henley (2021). CC BY-NC-SA 4.0; Panel B: Nieto (2015). CC BY SA 4.0.
all points on the inner surface of the hemisphere are equidistant from the eye. The examinee is instructed to maintain their gaze on a central fixation point throughout the test.2 The surface is evenly illuminated, and test objects consist of small light spots projected onto that background (termed the surround; Schiefer et al., 2005).
In practical application, the background brightness (luminance) is kept constant while a test object (stimulus point of light) of varying size, brightness, and position is projected onto it. This can be done by moving the test
___________________
2Many perimeters offer the option of four points in a diamond format to allow individuals with central scotomata to maintain fixation.
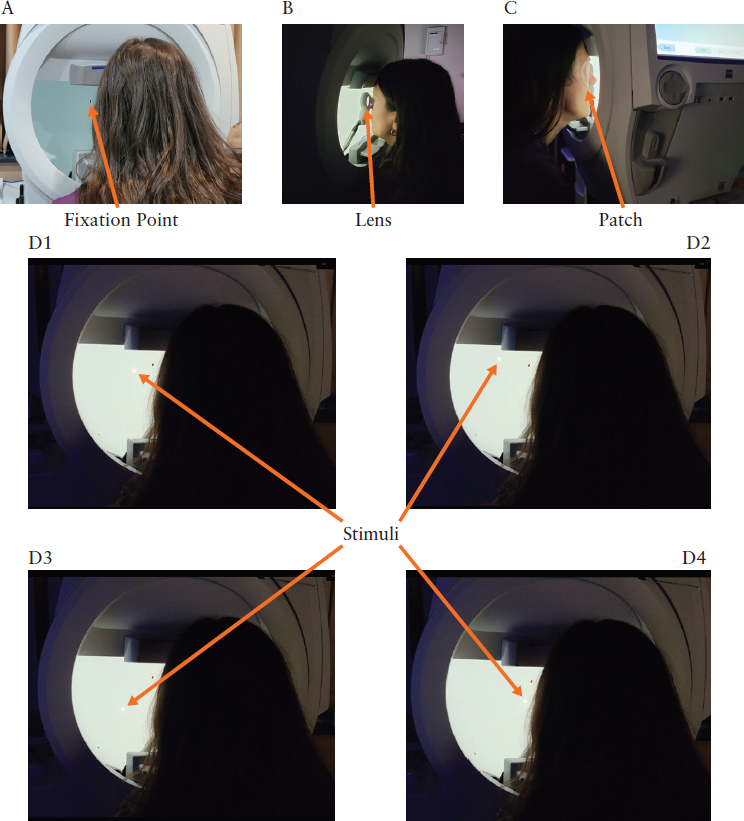
Photo credit: Tina M. Winters.
NOTE: This figure illustrates various components of static visual field testing conducted in a bowl perimetry device. The patient is instructed to maintain their gaze on a central fixation point, as shown in Panel A. Once the head is positioned correctly for the test, the lights are dimmed in the room, as shown in the subsequent panels. Each eye is tested individually; a lens is placed in front of the tested eye (Panel B), and the eye that is not undergoing testing is occluded with a patch (Panel C). Once the test begins, a series of stimuli (white lights) are projected onto the surface of the bowl (Panels D1–D4), and the patient is instructed to press a button each time they see a stimulus.
object with constant size and brightness (kinetic perimetry) or by projecting stationary stimuli one at a time at different locations on the background (static perimetry). Static threshold perimetry involves maintaining the same stimulus size and/or brightness throughout the test or adjusting the size and/or brightness over the course of the test. The threshold is probabilistically determined as the intensity or contrast that results in a 50 percent likelihood of detecting the object at a specific location within the visual field. The boundary of the visual field is considered the point in the visual field that separates the area that is seen from that which is not seen. If there is an area that falls within the boundary of the visual field in which stimuli are not seen at an intensity expected in that location, this area is referred to as a scotoma. A blind spot is an area in which a stimulus is not seen at any intensity.
As shown in Figure 3-2, normal vision includes a physiological blind spot, which corresponds to the location of the optic nerve where there is no visual sensitivity. Most diagnostic tests focus on the area within 30 degrees of central fixation because the greatest concentration of retinal ganglion cells is located in this area. The area beyond 30 degrees is considered part of the peripheral visual field, where there is greater variation in the measurement of visual sensitivity.
Perimetry testing employs standardized stimulus sizes developed by Goldmann (Figure 3-5). To determine visual sensitivity in static automated
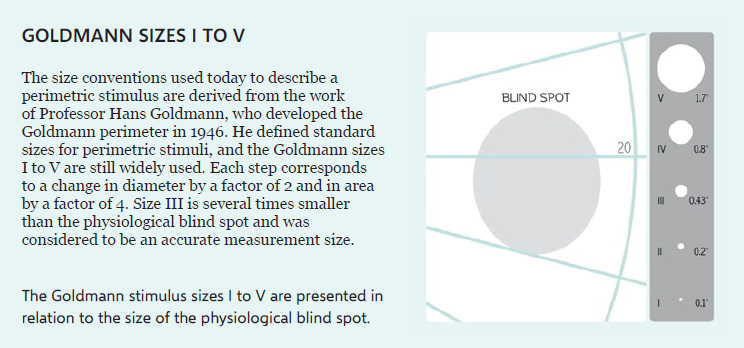
NOTE: The figure depicts the five stimulus sizes developed by Goldmann that are typically employed in perimetry, as compared with the size of the physiological blind spot. To illustrate in practical terms, Goldmann size III approximately corresponds to the size of the full moon in the sky.
SOURCE: Racette et al. (2019). Copyright © HAAG-STREIT AG.
threshold perimetry, the stimulus intensity is varied at static locations. The Humphrey static automated perimeter is capable of projecting stimuli at various intensities in Goldmann stimulus sizes of I, II, III, IV, and V—corresponding to 0.1 degree, 0.21 degree, 0.43 degree, 0.86 degree, and 1.72 degrees in diameter, respectively. While these are often used to correspond to different sizes apparent to the viewer (i.e., the Goldmann III-4e stimulus corresponding to an area of 4 mm2), people whose eyes have different axial lengths can technically perceive slightly different sizes of stimulus. The diameter of the stimulus on the perimeter’s bowl is fixed, but only for a similar bowl size; a 0.43-degree stimulus for the size III stimulus is the same no matter the bowl’s make. The Goldmann size III (0.43 degree) is most commonly used. The background illumination within the Humphrey device is uniformly set at 10 candelas per square meter (31.4 apostilbs [asb]), the level originally used in the Goldmann manual kinetic perimeter, reviewed later in this chapter. This level of illumination is thought to be less affected than other levels by change in the size of the pupil or existing lens opacification and is within the range at which Weber’s law still applies. The Humphrey perimeter projects light stimuli ranging from 0.1 to 10,000 asb or 0.03 to 3,183 candelas per square meter.
As stated, decibels are a logarithmic measurement of the attenuation of a stimulus compared to the maximum available. The contrast presented is the stimulus luminance divided by the background luminance. Thus, in perimetry, a 0-dB stimulus refers to the highest contrast stimulus that the device can present, and a 30-dB stimulus has 3 log-units lower contrast than that maximum. If a patient has a 50 percent probability of responding to the 30-dB stimulus, then that is typically referred to as the patient having a sensitivity of 30 dB at that location. As 30–35 dB is typically considered a normal level of sensitivity, having 10 dB of sensitivity is considered having 20–25 dB of impairment, approximately equivalent to SSA’s mean deviation requirement of 22 dB to qualify for disability benefits. As discussed in Chapter 1, mean deviation averages the difference between normal and observed sensitivities.
On the Humphrey perimeter, 0 dB corresponds to the maximum intensity the perimeter can present (brightest stimulus), measuring 10,000 asb; 50 dB corresponds to 0.1 asb. In other words, the lower the numeric value for dB, the brighter is the stimulus; the higher the numeric value for dB, the dimmer is the stimulus. Thus, at areas of the visual field expected to be most sensitive (i.e., the center), the visible dB range is expected to be at its highest (i.e., the dimmest stimuli can be perceived). The maximum stimulus sensitivity that would be expected in a normal individual is 40 dB (Heijl et al., 2021).
Static threshold perimetry, in which threshold sensitivities are mapped at predefined, static locations, can be either manual or automated, although
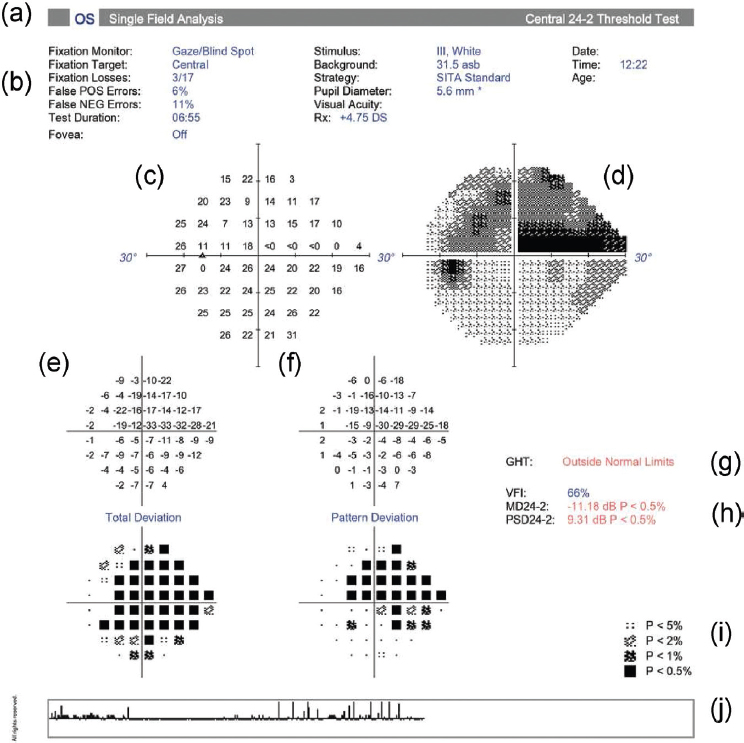
manual static threshold perimetry, in which a technician manually presents the stimulus and records the examinee’s responses, is rarely used today. In static automated threshold perimetry, test objects are presented across an area of the visual field, typically in a rectilinear grid, and a computer algorithm controls their display, minimizing examiner input. This approach allows for more efficient and consistent testing. By interpolating the differential light sensitivity values, this method generates a graphic representation of the hill of vision, resembling the polygonal facets of a geodesic dome (Schiefer et al., 2005). An example of a Humphrey visual field test printout depicting this graphic representation is shown in Figure 3-6.
NOTES: asb = apostilb; dB = decibel; MD = mean deviation; OS = oculus sinister (left eye); p = probability; PSD = pattern standard deviation; VFI = visual field index.
SOURCE: Wu et al. (2022). Reprinted with permission from Elsevier.
Humphrey visual field static automated threshold perimetry provides a comprehensive review of an individual’s visual field, yielding critical information that is useful in assessing performance, comparison with a normative database, and validity. The test printout in Figure 3-6 (a) specifies the test type and eye tested, in this case a 24-2 SITA3 Standard Test single-field analysis of the left eye (oculus sinister). This individual’s left eye demonstrates an advanced superior arcuate scotoma with split fixation and a nasal step. Figure 3-6 (b) shows that the fixation monitor was on during the test and that the fixation target was located centrally. It also specifies reliability indices, specifically fixation losses, false positives, and false negatives; the duration of the test; and the fact that foveal threshold testing was turned off (when turned on, this testing yields a metric that correlates with visual acuity and is useful in cases in which there may be nonorganic visual acuity loss). Figure 3-6 (c) shows the numeric results as a plot of sensitivities by location and measured in decibels, while Figure 3-6 (d) shows a grayscale illustration of the numeric results. Figure 3-6 (e) is a plot illustrating the deviation of the measured decibels from the expected age-adjusted levels of sensitivity relative to specific locations in the visual field and the test strategy used. Positive values denote points demonstrating better-than-normal sensitivity, while negative values represent worse-than-normal sensitivity.
The Humphrey visual field printout also provides additional statistical analysis measuring the likelihood that the observed sensitivity at a given location is likely to correspond to what was expected at that location. The results of this analysis are located below each of the numerical plots. Thus, what is illustrated is the probability according to the legend shown in Figure 3-6 (i). Deviations from expected values are highlighted when they are worse than those found in the bottom 5 percent, 2 percent, 1 percent, and 0.5 percent of normal subjects who are the same age as the patient. Figure 3-6 (f) is a plot illustrating the deviation, corrected for conditions such as a cataract, which may diffusely impact the visual field.
Figure 3-6 (g) provides the results of the Glaucoma Hemifield Test, which is based on an automated statistical analysis of patterns expected to be observed in glaucoma patients undergoing either the 24-2 or 30-2 test patterns (testing patterns are explained in the section below on current practice in perimetry assessment). Scoring differences in the upper hemifield divided into specific zones are compared with the mirror image of the same zone in the lower hemifield. In this example, the Glaucoma Hemifield Test is outside normal limits.
Figure 3-6 (h) includes the global indices of visual field index, mean deviation, and pattern standard deviation. For this test, the visual field index is 66 percent, the mean deviation is −11.18 dB, and the pattern standard
___________________
3SITA is the Swedish Interactive Thresholding Algorithm, explained later in this chapter.
deviation is −9.31 dB. Visual field index, which is less affected than mean deviation by conditions such as cataract and is considered to correspond to ganglion cell loss, is a useful metric in tracking disease progression. Mean deviation 24-2 is the average of the total deviation plotted in Figure 3-6 (e). Pattern standard deviation 24-2 peaks when there are moderate levels of localized field loss and should not be used to detect progression. As noted previously, Figure 3-6 (i) lists the probability symbols used in Figure 3-6 (e). Finally, Figure 3-6 (j) is the gaze index, which illustrates the variability in the eye gaze throughout the test. This metric is generated by a dual-variable tracker that measures gaze direction when a stimulus is projected. Taller spikes on the chart indicate periods when the patient’s focus deviated from the central fixation point by 10 degrees or more, while smaller spikes indicate smaller fixation losses. This visual display of the patient’s gaze is useful in educating individuals who are new to visual field testing about the importance of maintaining fixation throughout the test, an important lesson when additional testing is needed to confirm observed defects. In summary, the totality of the Humphrey visual field printout gives the clinician information that is important for assessing the patient’s visual function and performance and that can be used to inform future testing if needed.
In contrast to manual and automated static threshold perimetry, manual and semiautomated4 kinetic perimetry employ test objects that typically are moved from nonseeing to seeing areas of the visual field (movement in the opposite direction is possible as well and in fact can be used in conjunction with traditional kinetic perimetry to provide an average; see Chapter 5). Each isopter or island of vision can be mapped by testing variable target sizes and intensities using a moving stimulus.
The subject is asked to indicate when the moving light stimulus first becomes visible as it is presented from the periphery along different meridians (see Figure 3-7). Meridians refer to imaginary lines radiating from the central focus point, dividing the visual field into equal sections like pieces of a pie. Typically, the visual field is divided into eight equal sections, with the meridians intersecting at the central focus point. The meridians are labeled in degrees (0, 45, 90, 135, 180, 225, 270, 315, and 360), moving counterclockwise from the 3 o’clock position. The borders from not seeing to seeing at different meridians can then be connected to outline the isopter, or island of vision, using different stimuli. These stimuli are typically bright. As a result, impairments limited to dim stimuli may not be determinable using kinetic perimetry. However, individuals with such impairment are likely to qualify for Social Security Disability Insurance under a different pathway; this report is concerned with only those related to the extent of
___________________
4In this report, the term semiautomated rather than automated kinetic perimetry is used to highlight the role of the clinician.
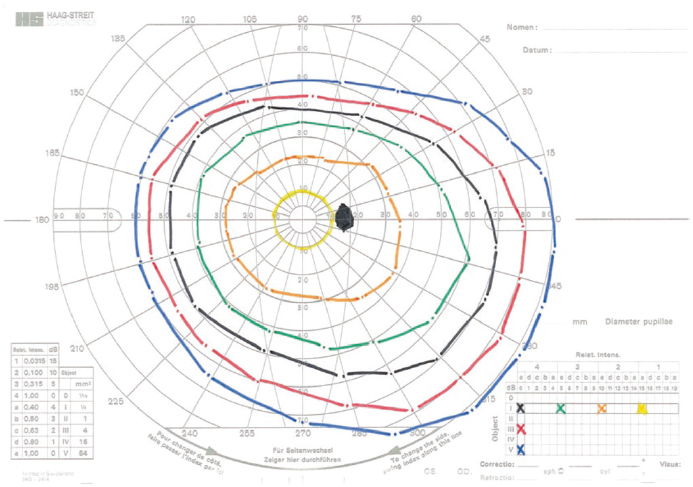
SOURCE: Tahib et al. (2018). Reproduced with permission from Springer Nature.
the visual field as defined by SSA. It is important to map the physiological blind spot to ensure the validity of the test.
This approach has advantages over static perimetry, particularly (1) when there are more complex midperipheral or peripheral scotomas (e.g., a peripheral ring scotoma) associated with retinal or neuro-ophthalmic disease, (2) when the visual field status in the far periphery needs to be investigated, (3) when individuals have difficulty responding to the stimuli and the testing pace needs to be slower, and (4) with pediatric patients because of increased engagement. Overall, relative to static perimetry, results of kinetic perimetry provide a more functional perspective and snapshot of the total visual field present in the center and periphery, and in some ways a more thorough image of the morphology of complex scotomas since the isopter borders (islands of vision) are clearly defined.
Visual field efficiency is expressed as a percentage corresponding to the visual field in the better eye, calculated by summing the number of degrees seen along the eight principal meridians found on a visual field chart and dividing by 5. For example, if the visual field is contracted down to 25 degrees in all eight meridians, the remaining visual field efficiency is 25 × 8 ÷ 5 = 40 percent (SSA, n.d.-a, 2.00A7c).
There are also devices, such as the Octopus 900, that offer semiautomated kinetic perimetry testing. They are semiautomated because they
combine manual and automated features; specifically, they allow for manual testing with customized testing patterns and focused area retesting, while controlling for the speed of kinetic stimulus presentation. Chapter 5 discusses the differences between automated and semiautomated perimetry in greater detail. When automated or semiautomated perimetry is not possible (or reliable), or when it is unavailable, other perimetry methods can be used, and their results may be analyzed together to gain a more holistic view of the total visual field function of the patient. For example, manual kinetic perimetry (or manual Goldmann perimetry) may be used along with alternative perimetry methods that may be more accessible, such as threshold frequency doubling technology (FDT). FDT uses a flickering stimulus to evaluate contrast sensitivity for specific stimuli. However, automated kinetic perimetry is commonly preferred to manual kinetic perimetry because it does not require access to trained personnel and offers the ability to standardize testing conditions (AAO, 2020; AOA, 2024; Ruia and Tripathy, 2023). FDT is discussed in greater detail in Chapter 5.
For individuals who may have a difficult time maintaining focus on a central location during the test, optokinetic perimetry may be considered rather than static threshold perimetry. Saccadic vector optokinetic perimetry (SVOP) is a novel modality for measuring visual fields, especially in younger children who cannot yet undergo quantitative visual field testing. SVOP is based on the principles of oculokinetic perimetry, a technique that provides a plotting of the visual field by having the patient move his or her eye, as described by Damato (1985), instead of presenting a static or kinetic stimulus while the patient maintains a fixed gaze and responds to stimuli based on predetermined locations. The SVOP test enables patients to respond to visual stimuli in a more natural and intuitive manner. Examinees need not focus on a specific location but instead have a response similar to that in electronic gaming. Since this technique tracks the eye position in three-dimensional space directly as it occurs throughout the testing, a more flexible testing environment is possible. Furthermore, a check is included in the SVOP system that halts the test when there is a conflict between the eye gaze data and the fixation stimuli coordinates. This allows for more accurate testing, and for a steadier interaction with visual stimuli and use of tracking in real time (Murray et al., 2009). Because of its benefit for examinees who have difficulty maintaining central fixation, this technology is theoretically beneficial for pediatric patients; however, this has not been clinically demonstrated as superior to current methods and so does not see widespread use in this population.
The visual field (the extent of an area visible to an individual during steady fixation of the eye in any one gaze or direction, as defined earlier) must be clearly distinguished from a person’s ability to see the world around them in natural conditions when both the eyes and head can
move. In everyday visual experience, these combined freedoms of movement increase total visual performance compared with the comparatively artificial concept of the visual field. In visual field testing, the diagnostic value of the data diminishes with increased degrees of movement because the performance of the ocular and somatic motor systems merges with that of the afferent sensory pathways. When movement is allowed, defects in the visual field can be concealed by compensatory movements of the eye, head, and/or body, potentially compromising the accuracy of the test results (Schiefer et al., 2005).
CURRENT PRACTICE IN PERIMETRY ASSESSMENT
Perimetry techniques include a combination of hardware, stimuli, testing patterns, and algorithms (Table 3-1). As discussed above, the stimulus is the visual signal presented during a visual field test, which can be static or kinetic. The technician administering the visual field test specifies the size of the stimulus (e.g., Goldmann size III, which has a diameter of 0.43 degree [Figure 3-5]) and the duration of the stimulus in milliseconds. Testing patterns are determined by the examiner based on clinical findings, diagnosis, and characteristics of the person being examined. The algorithm refers to the testing program, which is specific to the hardware. For example, the Humphrey Field Analyzer is generally paired with the Swedish Interactive Thresholding Algorithm (SITA).
Perimetry Hardware
Perimetry devices vary in design and portability, although the devices used most commonly tend to be large and not portable. Stimulus presentation varies across perimetry systems. While optical projection is standard, some devices now use LCD-based stimuli for consistent brightness and contrast. Sensitivity is measured in decibels, a logarithmic scale on which 0 dB represents the brightest light stimulus and 50 dB the dimmest. Knowing the brightness and luminance values of the stimulus and background of the perimeter is important for understanding the difference in dB scales among instruments when interpreting perimetry results.
The brightness capabilities of perimeters vary as well. In general, 0 dB reflects the machine’s maximum brightness rather than a standard intensity. For the purpose of reporting, the results are often, but not always, normalized to reflect the results that would have been obtained from a Humphrey Field Analyzer (static automated threshold perimeter) when the same background level (10 candelas per square meter) is used. This statistical normalization, however, is only possible when the perimeter is operating within a luminance range for which Weber’s law holds, and only under
TABLE 3-1 Field Testing Instruments, Testing Strategies, Testing Patterns, and Testing Algorithms
| Instrument / Perimeter | Testing Strategies | Testing Patterns | Testing Algorithms | Comments |
|---|---|---|---|---|
| Humphrey Field Analyzer (HFA) | Static automated (Note: some models [HFA3 and HFA840860] have kinetic testing ability) | 30-2, 24-2, 10-2, 24-2C, 120-point (Esterman) | Swedish Interactive Thresholding Algorithm (SITA) Standard, SITA Fast, SITA Faster, Esterman screening (suprathreshold) | Widely used in the United States; measures central and peripheral fields; short-wavelength automated perimetry isolates short-wavelength cones for early glaucoma detection. Projected stimuli. |
| Octopus | Static automated and semiautomated kinetic | 30-2, 24-2, 10-2, 60-4; G-program; M-Program; semiautomated kinetic testing | Full threshold, tendency-oriented perimetry, semiautomated kinetic algorithm | Common in Europe. Semiautomated kinetic testing provides controlled vector speed, reaction time compensation, and customizable templates for enhanced reliability. Projected stimuli. |
| Goldmann | Manual kinetic | Nonstandardized, technician dependent, manual testing pattern along principal meridians | [None] | Requires trained personnel. Projected stimuli. |
| Humphrey Matrix | Frequency doubling technology | N-20, C-30 | Zippy Estimation by Sequential Testing (ZEST), screening | Evaluates visual function based on the individual’s ability to detect a sinusoidal grating pattern (see Figure 5-1), but limited studies in severely affected individuals; portable device; testing can be performed in ambient lighting conditions. |
| imo Head-Mounted Perimeter | Static automated | 30-2, 24-2, 10-2, 24-plus (78 points, including 24-2 and additional central points) | Ambient Interactive ZEST (AIZE) | Portable, uses head-mounted display; tests left and right eyes separately or binocularly; LCD screen. |
| Topcon Tempo | Standard automated | 30-2, 24-2, 10-2, 24-plus | AIZE, AIZE-rapid, full threshold, two-zone (screening) | Desk-based version of imo; monocular or binocular testing; LCD screen. |
| iCare Compass | Fundus automated | 30-2, 24-2, 10-2 | ZEST, ZEST Rapid | Includes confocal retinal imaging and fixation tracking; LED screen. |
NOTE: The imo, Tempo, and iCare Compass, as well as other virtual reality–based devices, are discussed in detail later in the chapter. See Table 5-1 in Chapter 5 for background and maximum luminance levels.
similar background luminance as the Humphrey Field Anaylzer. To ensure ongoing accuracy, the brightness of the stimulus must be calibrated either manually or automatically. Furthermore, in interpreting results, floor and ceiling effects relating to the machines’ capabilities need to be considered.
Humphrey Field Analyzer
The Humphrey Field Analyzer is the static automated threshold perimeter that is currently most commonly used for visual field testing in the United States. It is especially prominent in detecting and monitoring glaucoma, given its ability to measure threshold sensitivities within the central and peripheral visual field; its reliability indices; and its specialized testing algorithms, such as SITA Standard, SITA Fast, and SITA Faster (Heijl et al., 2019; Ruia and Tripathy, 2023; Sikorsky and Laudencka, 2020). The Humphrey Field Analyzer offers 30-2, 24-2, 24-2C, and 10-2 testing patterns, allowing targeted assessment of the central visual field as well as more peripheral areas, which are essential for glaucoma and neuroophthalmologic assessments (AAO, 2020; AOA, 2024).
Octopus
The Octopus perimeter is also widely used, although it is more commonly used in Europe. It is valued for its flexibility, offering both static automated threshold and semiautomated kinetic testing options. It also employs unique algorithms, including the G-Program, which measures the sensitivity of a 30-degree field; the M-Program, which analyzes the macula area; and tendency-oriented perimetry for faster threshold testing. Octopus perimetry is often used for both general eye care and glaucoma follow-up, and it is compatible with various analysis programs, including glaucoma progression analyses and combined structure–function tests.
Goldmann
While no longer commercially available, the original Goldmann perimeter is a manual kinetic device still used by some clinicians. Because it is fully manual, it does not employ algorithms. A trained technician is needed to perform the test reliably, considering that various stimuli must be brought from the periphery to the center along a particular radian at a consistent speed. The technician must record reliably the point at which the patient first detects the stimulus. By repeating this maneuver at other angles of approach, a map of the visual field can be created. Usually, the technician will repeat a test once or twice using stimuli that require greater or lesser sensitivity. In addition to kinetic perimetric testing, the technician can test
the patient’s ability to detect specific stimuli centrally by projecting varying levels of stimulus luminosity.
Humphrey Matrix
The Humphrey Matrix evaluates contrast sensitivity using a sinusoidal flickering stimulus instead of a static circle, with available stimulus sizes of 2, 5, and 10 degrees. Testing with the Humphrey Matrix is faster but less comprehensive than testing with the Humphrey Field Analyzer and Octopus devices. Further discussion of the Humphrey Matrix, as well as frequency doubling technology in general, can be found in Chapter 5.
Testing Patterns and Strategies
In a perimetry test, the testing pattern refers to the set of points at which small lights are flashed at different intensities. As shown in Table 3-1, there are a number of testing patterns that may be employed. Testing patterns vary in the number of points and the span of the testing area. They are often noted in a #-# format, with the first # representing the extent of the field being tested in degrees, and the second # representing the specific pattern of points used during the test. For example, as shown in Figure 3-8, the 30-2 testing pattern extends 30 degrees from fixation and includes 76 points; the 24-2 testing pattern extends 24 degrees temporally and 30 degrees nasally from fixation and includes 54 points; and the 10-2 testing pattern extends only 10 degrees from fixation and includes 64 points. The 30-2 and 24-2 testing patterns present points 6 degrees apart, while the 10-2 program covers the central 10 degrees with higher resolution, presenting points spaced 2 degrees apart, and is thus better suited to detect early, subtle central defects. Recently, the 24-2C program introduced additional points within the central 10 degrees to improve the detection of paracentral scotomas, although it does not match the resolution of the 10-2 (Ruia and Tripathy, 2023).
Testing patterns can be tailored in response to the severity and location of visual field loss. For instance, central 10-degree testing patterns, such as the 10-2 test, are particularly valuable for patients with visual field damage that approaches fixation or for the detection of early central visual field defects that might not be identified by the 24-2 or 30-2 testing strategies (AAO, 2020). In such patients, focusing on the central 10 degrees using automated perimetry is useful, as it provides more sampling points close to this area than the 24-2, 24-2C, or 30-2 testing patterns. The examiner could use the 10-2 pattern for testing to identify early visual field loss in the central 10 degrees before such changes become apparent with more conventional larger-area test strategies, such as the 24-2 and 30-2 patterns.
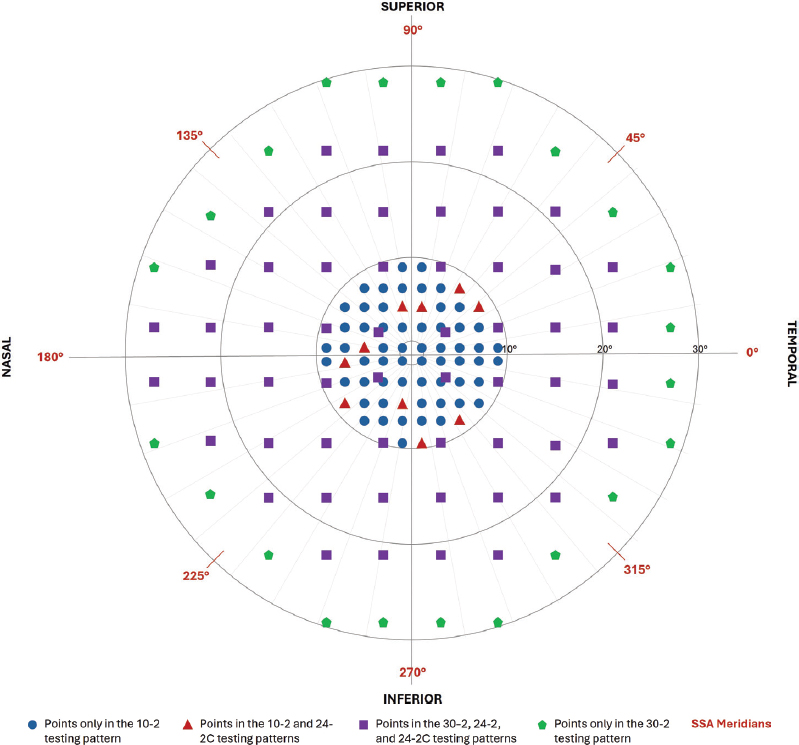
NOTES: This figure illustrates the 10-2, 24-2, 24-2C, and 30-2 testing patterns available on the Humphrey Field Analyzer, showing approximate stimulus locations for each of these patterns. As illustrated, the 10-2 pattern presents stimulus points within 10 degrees of the fixation point, with the points beginning ±1 degree from central fixation. Points in the 10-2 pattern are separated by 2 degrees. The 24-2 and 30-2 patterns present stimulus points beginning ±3 degrees from central fixation, with points separated by 6 degrees. The 24-2 pattern includes 54 points, while the 30-2 pattern includes 76 points. The 24-C pattern includes all of the 54 points in the 24-2 pattern plus an additional 10 points within the central 10 degrees from fixation. The 10-2 pattern includes 68 points. The 24-2 and 24-2C testing patterns are differentiated by right eye and left eye; this figure depicts the patterns as they would be presented in testing for the right eye. SSA = Social Security Administration.
The committee notes that the 30-2 testing pattern is used less often in routine practice now than it once was.
Algorithms
Visual field testing involves estimating the boundaries of an individual’s visual field (i.e., where their field of vision stops) as a function of the strength of the visual stimulus (e.g., stimulus size, intensity, and contrast), typically using a statistical algorithm that comes with the hardware. The testing algorithm is generally independent of an individual’s results from prior testing sessions. The SITA Standard is a standard algorithm for the Humphrey Field Analyzer; in most cases, this algorithm is used to assess patients initially. More recent algorithms, such as the SITA Fast and SITA Faster, help reduce test duration to minimize patient fatigue.
VARIABILITY AND CHALLENGES IN THE CLINICAL ASSESSMENT OF VISUAL FIELDS
Global indices and reliability indices provide important information for interpreting the results of visual field testing. Multiple factors affect test–retest reliability, and perimetry outcomes can vary as a result of patient-related factors, differences in perimeters and how perimetry is performed, and systems-level factors. Some of these factors can and should be controlled, while others cannot be. All of the factors can impact the quality of the test results, which is important to keep in mind if an individual’s results are borderline.
Global Indices
Visual field test results are often summarized using global indices, which provide quantitative measures of overall visual field performance, summarizing information from all the tested locations into a single number. The three most commonly used global indices are mean deviation, pattern standard deviation, and visual field index. Mean deviation represents the average amount of visual field loss, where a lower value indicates greater field loss. Individuals who are more sensitive to stimuli than expected for a normal person of the same age will have positive mean deviation values, whereas those who are less sensitive than expected (i.e., need a brighter stimulus) will have negative mean deviation values, indicating some degree of vision loss (AAO, 2025).
Pattern standard deviation indicates the consistency or asymmetry of the visual field loss across different areas of the field. It is calculated by summing the absolute values of the differences between the normal value for each point and the mean deviation for each point (AAO, 2025). A higher pattern standard deviation value represents a more uneven distribution of
field loss, potentially indicating localized damage. Visual field index represents the percentage of the visual field that is still functional, where a lower value represents worse field loss.
Figure 3-6 (h) of the Humphrey visual field printout contains the global indices for that test. The visual field index percent is an alternative measure of overall function, similar to mean deviation in that it reflects the centrally weighted average deviation from the age-matched normal hill of vision but adjusted for average sensitivity. It was developed to characterize diffuse loss caused by cataract and hence emphasizes localized loss more typical of glaucoma (Bengtsson and Heijl, 2008). However, for the severities of visual field loss discussed in this report, visual field index is highly correlated with mean deviation (Artes et al., 2011), and while generalized (“diffuse”) loss can be caused by a variety of conditions, removing the effect of generalized loss from nonglaucomatous causes may not always be desirable. The definition of visual field index also includes a change in the way it is calculated at mean deviation of approximately −20 dB, which is the severity of interest for this report. This discontinuity introduces variability when an eye falls just one side or the other of the −20 dB cutoff. Therefore, there are no strong reasons to consider using visual field index rather than mean deviation for SSA disability evaluation.
Reliability Indices
Test reliability in perimetry has traditionally been assessed using three indices: false positives, false negatives, and fixation losses. According to the manufacturer, reliability criteria for past models of the Humphrey Field Analyzer were established as less than 33 percent false-positive error, less than 33 percent false-negative error, and less than 20 percent fixation losses (Newkirk et al., 2006; Ruia and Tripathy, 2023). Today, this guideline exists only for tests not using the SITA family of algorithms.
To illustrate, in the printout of the Humphrey visual field 4-2 SITA Standard Test for a left eye (presented in Figure 3-6), fixation losses measure 3/17, which is less than 20 percent; this is considered a reasonable threshold for reliability based on fixation losses. The false positives measure 6 percent and false negatives 11 percent, which indicates that this test is reliable since both parameters fall below 33 percent. However, binary reliance on these indices is now discouraged, as there is strong evidence that they do not accurately relate to test reliability, as discussed in Chapter 4.
Patient-Related Variability
With respect to patient-related variability, it is important to consider first whether an examinee possesses the mental and physical capacity to participate in the testing, including maintaining a fixed head position and gaze.
Since the validity of the test depends on the person’s ability to respond to an illuminated stimulus by pressing a button, factors such as their alertness must be considered. Moreover, a learning curve is associated with perimetric testing, with accuracy of test results improving with repeated testing (Aydin et al., 2015; Heijl and Bengtsson, 1996). When the examinee’s mental status is coupled with perimetric experience, the effect on testing validity is notable, with pretest anxiety correlating with test unreliability and likely erroneously indicating the existence of more severe visual field impairment (Chew et al., 2016). Notably, individuals who have undergone ten or more perimetric tests show significantly less anxiety compared with those who have not (Chew et al., 2016).
Other examinee-related factors that can lead to reduced reliability in visual field testing include use of substances such as alcohol, use of medications such as antihistamines and other drugs that may suppress the central nervous system, and the presence of diseases such as diabetes or arthritis (Wild et al., 1988). Fatigue is another factor to be considered. Additionally, individuals with certain ocular conditions (e.g., macular degeneration, diabetic retinopathy) may not be able to fixate, which can be problematic as failure to maintain gaze fixation affects test results. It is therefore important to ensure that the patient understands the test, has the necessary experience to provide an optimal result (e.g., to compensate for the learning curve, to know how to pause the test or when to blink), and has the appropriate modifications to adjust for uncorrected refractive error and other conditions such as dermatochalasis (loose or excess eyelid skin that can result in drooping eyelids that impair the visual field).
Other anatomical factors also influence perimetry results. Chief among these factors is changing eye shape leading to refractive error (such as myopia resulting from elongation of the eye), which requires the appropriate lens correction to ensure that the patient can clearly visualize the stimuli (Johnson, 1996). For example, patients with high myopia may demonstrate less sensitivity, particularly in the cecocentral area (the area around the physiological blind spot), on visual field testing when the 30-2 and 10-2 Humphrey Field Analyzer test patterns are used (Araie et al., 1995). Other investigators have observed specific defects that may be associated with high myopia, such as aberrations around the physiological blind spot; absolute scotomas; and changes in indices such as mean deviation, pattern deviation, and short-term fluctuation (Corallo et al., 1997). Pupil size also may influence perimetric testing results (Lindenmuth et al., 1990). Other notable anatomical factors affecting perimetric reliability include cataracts (Lam et al., 1991), corneal lesions, face shape (Sadegh Mousavi et al., 2024), and dermatochalasis (Kosmin et al., 1997). These anatomical as well as nonanatomical factors have been demonstrated to significantly impact the reliability of perimetric testing (Higginbotham et al., 2003).
Given the variance between individual patient responses during perimetric testing and the difficulty of interpreting nonstereotypic field patterns, it is essential to confirm any detected visual field defects. Repeat visual field tests, using the same program, are needed to confirm visual field loss. Repeat testing is also recommended for examinees who are perimetrically naïve because of the learning curve with most visual field testing, as discussed above (Aydin et al., 2015; Heijl and Bengtsson, 1996). Individuals new to perimetry often need several sessions to achieve reliable outcomes.
Variability in the Assessor, Instrument, and Environment
Perimetry results can vary depending on choices made by practitioners, including the type of perimeter used. For example, earlier versions of the Octopus perimeter presented stimuli following a click sound, which alerted the patient that a stimulus was being projected. Additionally, the order in which the left and right eyes are tested (Searle et al., 1991), the position of the lens holder (Donahue, 1998), and the size of the stimulus (Wall et al., 1997) can each introduce variability and affect test validity.
Some investigators have suggested using different stimulus sizes, instead of the current standard of size III, in testing algorithms. Larger stimuli are easier to detect, increasing the sensitivities, and possibly reducing test–retest variability (Wall et al., 1997). Other investigators have suggested that smaller stimuli may improve the signal-to-noise ratio (Rountree et al., 2018), although those studies have so far focused on detecting early defects rather than discriminating between levels of more severe loss as required for SSA disability assessment. This again emphasizes that the full testing conditions, including the stimulus size and testing algorithm, need to be considered when deciding whether a test is suitable for assessment of disability, rather than only considering the perimeter used.
Supervision of individuals during testing has been demonstrated to ensure that they remain awake and are well positioned during the test and that unnecessary distraction is minimized (Johnson, 1996). Thus, it is generally considered important that the technician remain in the room with the examinee to ensure optimal conditions. However, if a professional staff member cannot be present, alternative strategies, such as the use of a training video before the test starts, may yield similar results (Maheshwari et al., 2023).
Challenges and Opportunities in Systems-Level Factors
Visual field testing using traditional perimeters, such as the Humphrey Field Analyzer (static automated threshold perimeter) and the Octopus
(combined static automated threshold and semiautomated kinetic perimeter), requires oversight by a vision specialist, such as an optometrist or ophthalmologist. Vision screening and care can be more difficult for some groups of people to access than others. For example, people living in rural communities and urban communities of color have individuals with more severe retinopathy and less access to eye care relative to other groups (Hale et al., 2010; Sommer et al., 1991). Fewer eye clinics accept Medicaid compared with private insurance, many clinics have appointments booked out several months, and out-of-pocket costs can be high. Lack of transportation can also be an issue. As the U.S. population ages, one can expect higher patient volumes in the next few decades without an increase in vision specialists (Hughes et al., 2022; Mehrotra and Uscher-Pines, 2022; NASEM, 2016; Sinsky et al., 2021).
One way to expand access to vision testing is through teleophthalmology. Teleophthalmology can provide evidence-based diabetic eye screening for people with diabetes by, for example, making it possible to conduct the testing in a primary care setting and send results electronically to eye specialists, who can then provide a diabetic retinopathy report and a clinical evaluation and treatment plan (Horton et al., 2020; Liu et al., 2019). This type of testing is fast and inexpensive. Other potential settings for vision screening and care include health clinics and federally qualified health centers. The latter are primary care–based, safety-net community clinics that are located throughout the United States and provide medical care regardless of insurance type or insurance status. Finally, new technologies in visual field testing that do not require expensive equipment show promise for increasing access to visual field testing. The next section introduces some of these new technologies.
RECENT CHANGES IN PRACTICE
This section reviews emerging perimetric technologies and advances in perimetric testing algorithms, as well as the implications of these advances for SSA’s disability evaluation.
Emerging Technologies
Several new perimetric technologies have been developed in recent years.
Virtual Reality Headsets
Virtual reality (VR) headsets can be used to present stimuli to individual eyes. The viewing distance is small, but with a suitably high screen resolution the stimulus can be made indistinguishable to the observer from a stimulus in a traditional bowl perimeter. Some VR systems have built-in eye tracking, which can provide an accurate measure of fixation stability and hence
ensure the reliability of test results. Certain individuals may find the weight of the headset uncomfortable, but others prefer it to a traditional perimeter because their head does not have to remain in a fixed position leaning forward onto a chin rest, a particular benefit for people with neck or back pain. The headset typically blocks out extraneous light, so the testing no longer needs be performed in a darkened room, which greatly increases flexibility for the location of the testing. Thus, the testing may be performed in waiting rooms or in settings outside of eye clinics, although it should be noted that audible distractions in those settings could themselves impact test reliability.
At the time this report was being prepared, the Food and Drug Administration (FDA) had approved three VR devices for perimetry, and more portable devices are likely to receive FDA approval in the next 5 years. A growing literature over the last decade supports the use of these new devices as valid and reliable alternatives to traditional perimetry. Chapter 4 offers insight into how those studies can be evaluated.
imo Head-Mounted Perimeter and Topcon Tempo Perimeter
The imo head-mounted automated perimeter (Figure 3-9) is an emerging technology that provides a more portable option relative to traditional perimeters such as the Humphrey Field Analyzer and Octopus (Ishibashi et al., 2022; Matsumoto et al., 2016). The device consists of a “head-mounted perimeter unit, a separate response button and a tablet which is controlled by the operator” (Wu et al., 2022). This device measures within 35 degrees of the center of the visual field (Matsumoto et al., 2016). An alternative desk-based version of the hardware has also been released as the Topcon Tempo perimeter, with the same testing algorithms. Testing with the imo can be performed as either a monocular test (since there are two testing systems, one for each eye) or a binocular random single-eye test. The imo also includes a
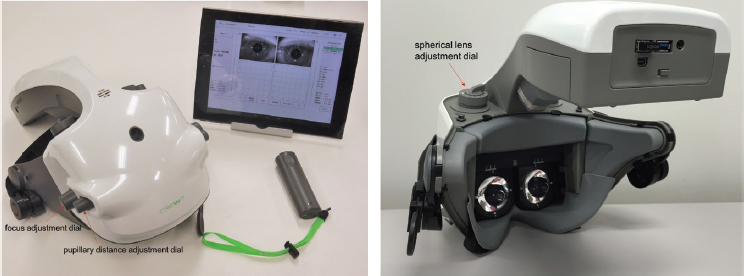
SOURCE: Matsumoto et al. (2016). CC0 1.0.
unique testing strategy—the “24 plus”—which includes 78 points, 54 within the 24-2 pattern and an additional 24 in the central 10-degree visual field. A comparison of the imo device and the Humphrey Field Analyzer in patients with glaucoma found no significant difference in mean deviation results; however, testing time was shorter for the imo than for the Humphrey Field Analyzer (Kimura et al., 2019). A new algorithm, described in the next section, was developed for use with the imo device.
iCare Compass
The iCare Compass is a static automated threshold perimeter combined with an active retinal tracker and a scanning ophthalmoscope. This design enables simultaneous retinal imaging during the visual field test, and hence more accurate comparison of structural and functional measurements. For the purposes of SSA disability evaluation, the relevant difference from the above instruments is that retinal tracking adjusts for, and so reduces, fixation losses. Mean deviation measurements tend to correlate well between the Compass and the Humprey Field Analyzer, including at the severities of interest for SSA assessment (Liu et al., 2021; Montesano et al., 2019).
Tablet and Desktop Computer–Based Testing
An alternative approach to head-mounted devices is to perform the testing on a tablet or desktop computer. These devices are widely available and already owned by a large and ever-increasing proportion of individuals, making home testing more feasible with these devices than with VR headsets, which have higher cost and far lower ownership rates. Use of such devices also expands testing availability beyond clinics with bowl perimeters.
The primary advantage of using tablets and desktop computers for visual field testing is increased accessibility. However, use of these devices has disadvantages as well. The main disadvantage is the lack of standardization of test conditions. Background light levels are not controlled; viewing distances (and hence angles) may not be consistent or accurate; the screen may not always be angled perpendicular to the viewing angle; and stimulus brightness can vary both temporally (because of hardware degradation over time) and spatially (because of dirt on the screen). A further consideration is that binocular instead of monocular viewing is often used, whether by design or as a result of test subjects not following the detailed directions. This makes it impossible to use the standard catch trial method for assessing fixation losses, since stimuli cannot be presented within the physiological blind spot; therefore, it becomes necessary to employ automated eye tracking, which is not possible with many of the commercial devices present in people’s homes. In addition, screen sizes may be too small to measure the necessary spatial
extent of the visual field. Although this issue can be ameliorated by having the test subject fixate on one side or one corner of the screen, doing so comes at the cost of increased eye movement (loss of fixation) because the examinee knows in advance the region of the visual field in which the stimulus will appear. Another caveat is that some of these devices can present only a limited range of stimulus contrasts because of hardware limitations.
Tablets and desktop computers offer other advantages over bowl perimeters. They are much cheaper and far more portable and can be more flexible with regard to testing conditions and settings. They allow use of stimulus types other than a static white-on-white circle—for example, spatially varying flickering stimuli, such as a Gabor patch (see Figure 3-10), that cannot be presented using a projection-based bowl perimeter. This feature may be particularly useful for pediatric testing since more engaging stimuli can be used. If designed and implemented well and with adequate built-in instructions, tablets and desktop computers can reduce or even eliminate the need for testing to be performed by a trained technician without precluding reliability. Given the caveats concerning reduced standardization of testing conditions, it is essential to ensure that they have equivalent reliability for assessing visual disability when used in the intended setting.
Short-Wavelength Automated Perimetry
An additional testing mode available on the Humphrey Field Analyzer is short-wavelength automated perimetry (SWAP). This test isolates cells

SOURCE: Tsushima et al. (2020). CC BY 4.0.
sensitive to short wavelengths by projecting a narrow band of blue-light stimulus on a bowl illuminated with a yellow light. The size of the target is equivalent to a Goldmann size V. The background reduces the sensitivities of the green and red cones, isolating the short wavelength–sensitive blue cones and their associated small, bistratified retinal ganglion cells. SWAP is considered to be more sensitive to early glaucoma than standard perimetry. A study designed to assess the role and diagnostic capability of optical coherence tomography and SWAP in distinguishing among normal eyes, glaucoma suspects, and diagnosed glaucomatous eyes found both to be effective tools for this purpose (Zaky et al., 2016). However, SWAP showed superior ability to detect glaucomatous changes in the glaucoma suspect group.
Despite the promise of SWAP to detect glaucomatous field loss prior to structural changes in the optic nerve, its clinical use has limitations. Greater variability in testing has been noted with SWAP compared with static automated threshold perimetry (Blumenthal et al., 2000). Moreover, limitations of previous comparative studies of SWAP and static automated threshold perimetry include the lack of a standardized age-corrected normal database for SWAP and the absence of statistically and clinically robust criteria for defining abnormality or progressive loss for SWAP. These limitations, among others, have hindered understanding of SWAP’s effectiveness in detecting progressive loss in glaucoma and have made it challenging to determine whether SWAP offers any significant advantages over white-on-white perimetry, beyond SWAP’s core function of detecting field loss earlier (Wild, 2001).
Given the above factors, as well as the fact that SWAP is designed to detect early defects in the visual field, it does not appear to be suitable for SSA’s use in determining disability benefits. However, studies conducted on SWAP over the last two decades have yielded lessons about the elements of clinical studies that are needed to assess the viability of new perimetric devices on the horizon. As described in Chapter 4, the number of studies is not as critical as their quality in ensuring that any given test provides the information needed to assess the ability of visually impaired individuals to function.
Advances in Testing Algorithms
As noted previously, the Humphrey Field Analyzer is the most commonly used perimeter in clinical practice in the United States. In most cases in current practice, the Humphrey SITA Standard Threshold Test is used for initial patient assessment. SITA shortens the number of stimuli posed to the patient relative to the original Full Threshold strategy, which is almost never used today, and quickly learns which additional points should be tested based on previous responses. SITA Fast was introduced to further shorten testing time. Both SITA Standard and SITA Fast reduce testing time and are similarly sensitive for detecting moderate and severe
glaucoma (Budenz et al., 2002). More recently, even faster algorithms have been developed to shorten the identification of defects without jeopardizing the reliability of the test (Budenz et al., 2002; Wu et al., 2022).
To reduce the variability that exists in perimetric testing when patients are fatigued because of the test’s long duration, investigators developed SITA Faster, a modified version of the SITA Fast perimetric testing strategy designed to reduce the number of stimulus presentations while maintaining accuracy in visual field testing. It incorporates several modifications to enhance efficiency and potentially increase the frequency of perimetric testing, which is important for earlier detection of progression in conditions such as glaucoma. The aim of developing this software was to provide a shorter testing duration without compromising the effectiveness of glaucoma detection compared with SITA Fast and SITA Standard. The development of SITA Faster involved simulations and clinical testing, and it has been evaluated in a multicenter clinical study (Heijl et al., 2019). That study found that the mean test times for SITA Faster were significantly shorter than for SITA Fast and SITA Standard, and the results for mean deviation were similar among all three tests at all severities. The visual field index did not differ between SITA Fast and SITA Faster, but the values were found to be lower with SITA Standard than with both SITA Fast and SITA Faster. Additionally, there was a slightly higher number of significantly damaged test points with SITA Standard than with SITA Fast and SITA Faster. All three tests exhibited similar test–retest variability across the entire range of threshold values in all groups. Overall, SITA Faster demonstrated considerable time savings while providing results comparable to those obtained with SITA Fast (Heijl et al., 2019). However, SITA Faster would not be acceptable to SSA currently because it does not automatically perform the false-negative catch trials that SSA prefers, although this function can be activated by the operator.
Another new algorithm, the Ambient Interactive Zippy Estimation by Sequential Testing (AIZE) algorithm, was developed for use with the imo head-mounted perimeter. The AIZE algorithm shortens testing time and has been demonstrated to have equivalent mean deviation as reported by the Humphrey Field Analyzer 24-2 testing strategies across the full range of damage severities (Nishida et al., 2023).
Implications for Disability Evaluation
Testing algorithms are not mentioned in SSA’s Listing of Impairments for Special Senses and Speech (SSA, n.d.-a, -b), but the choice of algorithm is potentially important, as performance is algorithm specific. As visual field loss worsens, variability in performance increases. For individuals who are sufficiently impaired to be categorized as disabled, variability will be greater. Given the learning curve, conducting multiple tests might improve the accuracy of the results. It is unclear how many visual field tests might be required to
achieve optimum accuracy, but a minimum of two tests could be expected to improve the accuracy of results. Physician notes are also important to consider.
With respect to testing patterns, SSA’s listing criteria for assessing mean deviation require a Humphrey Field Analyzer 30-2 test result. The committee points out that the 30-2 testing pattern is used less often now in routine practice than it used to be, and the 30-2 and 24-2 patterns are functionally equivalent in most cases. Nevertheless, the SITA 30-2 algorithm can be helpful in specialized clinical settings, such neuro-ophthalmology, and certain research settings. Kinetic perimetry is also not routinely used and not needed except for special circumstances, such as for SSA’s calculation of visual field efficiency, as well as special use cases detailed in Chapter 5.
SUMMARY AND CONCLUSIONS
Perimetry, also known as visual field testing, is an essential diagnostic tool for assessing various ophthalmic conditions, including glaucoma, optic neuropathies, and disorders affecting the retina and visual pathways. Perimetry techniques consist of a combination of hardware, stimuli, testing patterns, and algorithms. The Humphrey Field Analyzer (static automated threshold perimeter) is the most widely used perimeter in the United States, with the Octopus perimeter (combined static automated threshold and semiautomated kinetic perimeter) also commonly being used, particularly in Europe. The Humphrey Field Analyzer employs specialized algorithms such as SITA Standard and SITA Fast, with testing patterns such as 30-2, 24-2, and 10-2, allowing targeted assessment of the central visual field, as well as more peripheral areas. Stimulus presentation varies across perimetry systems. While optical projection is standard, some devices now use LCD-based stimuli for consistent brightness and contrast.
SAP using white-on-white stimuli measures the sensitivity of an individual’s visual field at specific test locations and has the capability to compare the findings with a database of previously tested patients with normal vision. Specific programs can be used to tailor the visual field test to focus on distinct areas of a patient’s concentrated visual field loss. Manual or semiautomated kinetic perimetry may also be used by eye care providers to assess the visual field. However, because semiautomated kinetic perimetry does not require trained personnel to conduct and because it provides the capability to standardize testing conditions, it is more commonly used.
Recent changes in practice include newer algorithms, such as SITA Fast and SITA Faster for the Humphrey Field Analyzer, that shorten the number of stimuli posed to the patient and can quickly learn which additional points should be tested based on previous responses. Shorter testing times decrease reliability, although not significantly. Generally, patients who may be suspected of conditions such as glaucoma may initially undergo a 24-2 test using the Humphrey Field Analyzer. Other potential testing protocols include
the Humphrey Field Analyzer SITA 10-2 if loss is suspected close to central fixation and the patient is suspected of demonstrating advanced field loss; the Humphrey Field Analyzer SITA 30-2, which covers a greater expanse of the visual field, can be used if more peripheral loss is expected.
Testing algorithms are not mentioned in the SSA listings, but they are important, as performance is algorithm specific. As the visual field loss worsens, variability in performance increases. For individuals who are sufficiently impaired to be categorized as disabled, variability will be greater. Given the learning curve, conducting multiple tests might improve the accuracy of the results. It is unclear how many visual field tests might be required to achieve optimum accuracy, but conducting a minimum of two tests could be expected to improve the accuracy of results, particularly in patients naïve to visual field tests.
With respect to testing patterns, SSA’s listing criteria for assessing mean deviation require a Humphrey Field Analyzer 30-2 test result. The committee points out that the 30-2 testing pattern is used less often now than it once was, and the 30-2 and 24-2 patterns are functionally equivalent in many instances. Nevertheless, the SITA 30-2 algorithm can be helpful in specialized clinical settings, such neuro-ophthalmology and certain research settings. Kinetic perimetry is also not routinely used and not needed except for special circumstances such as for SSA’s calculation of visual field efficiency.
Based on its review of the literature, the committee reached the following conclusions:
Conclusion 3.1: Measurement of visual field impairment involves components beyond the hardware or visual perimetry device, including stimuli, testing patterns, and algorithms. All components are important to consider when evaluating the validity of visual field assessment.
Conclusion 3.2: Because variability in the results of visual field assessment increases as the severity of visual field impairment increases, and given the learning curve in visual field testing, more than one visual field test may be needed to characterize an individual’s visual field impairment accurately.
Conclusion 3.3: The Social Security Administration’s listing criteria for assessing mean deviation require a Humphrey Field Analyzer 30-2 test result, but this testing pattern is used less often now in routine practice. In many instances, however, the 24-2 testing pattern is functionally equivalent to the 30-2 testing pattern and may be sufficient for assessing mean deviation.
Perimetry outcomes can vary because of patient-related factors, differences in perimeters and how perimetry is performed, and systems-level factors. Patient-level factors include whether a patient possesses the mental
and physical capacity to participate in the testing, the patient’s previous experience with perimetric testing, their use of alcohol and medications that may suppress the central nervous system, the presence of diseases such as diabetes or arthritis, fatigue, and ocular conditions that may affect their ability to fixate. Perimetry results also can vary depending on choices practitioners make, including the type of perimeter used, the order in which the left and right eyes are tested, and whether patients are supervised and well positioned during the testing. In terms of systems-level factors, visual field testing using traditional perimeters, such as the Humphrey Field Analyzer (static automated) and Octopus (combined static automated threshold and semiautomated kinetic), requires oversight by experienced technicians, creating challenges for individuals with limited access to appropriately trained eye care providers. With an aging population and insufficient numbers of eye care providers projected in the future, teleophthalmology offers a solution by enabling remote diabetic eye screenings and evaluations. Expanding vision care to settings such as primary care, health clinics, and federally qualified health centers could improve access. Emerging, cost-effective technologies, such as virtual reality headsets and tablet- and desktop-based systems, also show promise for improving accessibility. With proper design and implementation, these tools could significantly expand access to visual field testing while maintaining reliability.
Based on its review of the literature, the committee reached the following conclusion:
Conclusion 3.4: Visual field testing with traditional perimeters such as the Humphrey Field Analyzer and Octopus requires oversight by experienced technicians who may be in limited supply, creating challenges for some populations with limited access to care. Emerging cost-effective technologies, such as virtual reality headsets and tablet- and desktop-based systems, show promise for improving accessibility. With proper design and implementation, these tools may significantly expand access to visual field testing while maintaining reliability and validity, assuming studies demonstrate the ability to provide accurate, reproducible results even in an unsupervised setting and their suitability for determining SSA disability in the target population.
REFERENCES
AAO (American Academy of Ophthalmology). 2020. Primary open-angle glaucoma preferred practice pattern. https://www.aaojournal.org/action/showPdf?pii=S0161-6420%2820%2931024-1 (accessed February 25, 2025).
AAO. 2025. Standard automated perimetry. EyeWiki. https://eyewiki.org/Standard_Automated_Perimetry (accessed February 24, 2025).
AOA (American Optometric Association). 2024. Care of the patient with primary open-angle glaucoma, 1st ed. https://www.aoa.org/a/19461 (accessed March 24, 2025).
Araie, M., M. Arai, N. Koseki, and Y. Suzuki. 1995. Influence of myopic refraction on visual field defects in normal tension and primary open angle glaucoma. Japanese Journal of Ophthalmology 39(1):60–64.
Artes, P. H., N. O’Leary, D. M. Hutchison, L. Heckler, G. P. Sharpe, M. T. Nicolela, and B. C. Chauhan. 2011. Properties of the statpac visual field index. Investigative Ophthalmology & Visual Science 52(7):4030–4038.
Aydin, A., İ. Koçak, U. Aykan, G. Can, M. Sabahyildizi, and D. Ersanli. 2015. The influence of the learning effect on automated perimetry in a Turkish population. Journal Francais d’Ophtalmologie 38(7):628–632.
Bengtsson, B., and A. Heijl. 2008. A visual field index for calculation of glaucoma rate of progression. American Journal of Ophthalmology 145(2):343–353.
Blumenthal, E. Z., P. A. Sample, L. Zangwill, A. C. Lee, Y. Kono, and R. N. Weinreb. 2000. Comparison of long-term variability for standard and short-wavelength automated perimetry in stable glaucoma patients. American Journal of Ophthalmology 129(3):309–313.
Budenz, D. L., P. Rhee, W. J. Feuer, J. McSoley, C. A. Johnson, and D. R. Anderson. 2002. Sensitivity and specificity of the Swedish interactive threshold algorithm for glaucomatous visual field defects. Ophthalmology 109(6):1052–1058.
Chew, S. S., N. M. Kerr, A. B. Wong, J. P. Craig, C.-Y. Chou, and H. V. Danesh-Meyer. 2016. Anxiety in visual field testing. British Journal of Ophthalmology 100(8):1128–1133.
Corallo, G., P. Capris, and M. Zingirian. 1997. Perimetric findings in subjects with elevated myopia and glaucoma. Acta Ophthalmologica Scandinavica 75(S224):30–31.
Damato, B. E. 1985. Oculokinetic perimetry: A simple visual field test for use in the community. The British Journal of Ophthalmology 69(12):927–931.
Donahue, S. P. 1998. Lens holder artifact simulating glaucomatous defect in automated perimetry. Archives of Ophthalmology 116(12):1681–1683.
Hale, N. L., K. J. Bennett, and J. C. Probst. 2010. Diabetes care and outcomes: Disparities across rural America. Journal of Community Health 35(4):365–374.
Heijl, A., and B. Bengtsson. 1996. The effect of perimetric experience in patients with glaucoma. Archives of Ophthalmology 114(1):19–22.
Heijl, A., V. M. Patella, and B. Bengtsson. 2021. The field analyzer primer: Excellent perimetry, 5th ed. Carl Zeiss Meditec, Inc.
Heijl, A., V. M. Patella, L. X. Chong, A. Iwase, C. K. Leung, A. Tuulonen, G. C. Lee, T. Callan, and B. Bengtsson. 2019. A New SITA perimetric threshold testing algorithm: Construction and a multicenter clinical study. American Journal of Ophthalmology 198:154–165.
Henley, C. 2021. Foundations of neuroscience, open edition. Michigan State University. https://openbooks.lib.msu.edu/neuroscience/chapter/vision-the-retina/
Higginbotham, E. J., N. Ellish, and R. Kalsi. 2003. The variability of perimetry: Reassessing an important clinical tool. In Glaucoma in the new millennium: Proceedings of the 50th annual symposium on glaucoma, New Orleans, LA, USA, April 6-8, 2001, Organized by the New Orleans Academy of Ophthalmology. Monroe, NY: Kugler Publications.
Horton, M. B., C. J. Brady, J. Cavallerano, M. Abramoff, G. Barker, M. F. Chiang, C. H. Crockett, S. Garg, P. Karth, Y. Liu, C. D. Newman, S. Rathi, V. Sheth, P. Silva, K. Stebbins, and I. Zimmer-Galler. 2020. Practice guidelines for ocular telehealth—Diabetic retinopathy, 3rd ed. Telemedicine and e-Health 26(4):495–543.
Hughes, H. K., B. W. Hasselfeld, and J. A. Greene. 2022. Health care access on the line—audio-only visits and digitally inclusive care. New England Journal of Medicine 387(20):1823–1826.
Ishibashi, T., C. Matsumoto, H. Nomoto, F. Tanabe, I. Narita, M. Ishibashi, S. Okuyama, T. Kayazawa, S. Kimura, K. Yamanaka, and S. Kusaka. 2022. Measurement of fixational eye movements with the head-mounted perimeter imo. Translational Vision Science & Technology 11(8):26. https://doi.org/10.1167/tvst.11.8.26
Johnson, C. A. 1996. Standardizing the measurement of visual fields for clinical research: Guidelines from the eye care technology forum. Ophthalmology 103(1):186–189.
Kimura, T., C. Matsumoto, and H. Nomoto. 2019. Comparison of head-mounted perimeter (imo®) and Humphrey Field Analyzer. Clinical Ophthalmology 13:501.
Kolb, H. 1995. Simple anatomy of the retina. In H. Kolb, R. Nelson, E. Fernandez, and B. Jones (Eds.), Webvision: The organization of the retina and visual system. University of Utah Health Sciences Center. https://webvision.med.utah.edu/book/part-i-foundations/simple-anatomy-of-the-retina/ (accessed April 1, 2025).
Kosmin, A. S., P. K. Wishart, and M. K. Birch. 1997. Apparent glaucomatous visual field defects caused by dermatochalasis. Eye 11(5):682–686.
Lam, B. L., W. L. Alward, and H. E. Kolder. 1991. Effect of cataract on automated perimetry. Ophthalmology 98(7):1066–1070.
Lindenmuth, K. A., G. L. Skuta, R. Rabbani, D. C. Musch, and T. J. Bergstrom. 1990. Effects of pupillary dilation on automated perimetry in normal patients. Ophthalmology 97(3):367–370.
Liu, P., B. N. Nguyen, A. Turpin, and A. M. McKendrick. 2021. Increased depth, reduced extent, and sharpened edges of visual field defects measured by compass fundus perimeter compared to Humphrey field analyzer. Translational Vision Science & Technology 10(12):33.
Liu, Y., A. Torres Diaz, and R. Benkert. 2019. Scaling up teleophthalmology for diabetic eye screening: Opportunities for widespread implementation in the USA. Current Diabetes Reports 19:74.
Maheshwari, D., A. Nair, T. D. Tara, N. Pawar, R. Ramakrishnan, D. R. G. Selvi, and M. S. Uduman. 2023. Comparison of the effect of audiovisual and verbal instructions on patient performance while performing automated Humphrey Visual Field testing. Indian Journal of Ophthalmology 71(2):569–574.
Matsumoto, C., S. Yamao, H. Nomoto, S. Takada, S. Okuyama, S. Kimura, K. Yamanaka, M. Aihara, and Y. Shimomura. 2016. Visual field testing with head-mounted perimeter ‘imo’. PLoS One 11(8):e0161974.
Mehrotra, A., and L. Uscher-Pines. 2022. Informing the debate about telemedicine reimbursement—what do we need to know? New England Journal of Medicine 387(20):1821–1823.
Montesano, G., S. R. Bryan, D. P. Crabb, P. Fogagnolo, F. Oddone, A. M. McKendrick, A. Turpin, P. Lanzetta, A. Perdicchi, C. A. Johnson, D. F. Garway-Heath, P. Brusini, and L. M. Rossetti. 2019. A comparison between the compass fundus perimeter and the Humphrey field analyzer. Ophthalmology 126(2):242–251.
Murray, I. C., Fleck, B. W., Brash, H. M., Macrae, M. E., Tan, L. L., & Minns, R. A. (2009). Feasibility of saccadic vector optokinetic perimetry: A method of automated static perimetry for children using eye tracking. Ophthalmology, 116(10):2017–2026.
NASEM (National Academies of Sciences, Engineering, and Medicine). 2016. Making eye health a population health imperative: Vision for tomorrow. Washington, DC: The National Academies Press.
Newkirk, M. R., S. K. Gardiner, S. Demirel, and C. A. Johnson. 2006. Assessment of false positives with the Humphrey Field Analyzer II perimeter with the SITA algorithm. Investigative Ophthalmology & Visual Science 47(10):4632–4637.
Nieto, M. P. 2015. A simplified schema of the human visual pathway. https://commons.wikimedia.org/wiki/User:Perellonieto#/media/File:Human_visual_pathway.svg
Nishida, T., R. N. Weinreb, J. Arias, C. Vasile, and S. Moghimi. 2023. Comparison of the TEMPO binocular perimeter and Humphrey Field Analyzer. Scientific Reports 13:21189.
Racette, L., M. Fischer, H. Bebie, G. Hollo, C. A. Johnson, and C. Matsumoto. 2019. Visual field digest: A guide to perimetry and the Octopus perimeter, 8th ed. https://haag-streit.com/2%20Products/Speciality%20diagnostics/Perimetry/Category%20assets/Books/HS_perimetry_br_xxx_visual_field_digest_8th_en.pdf (accessed February 3, 2025).
Rountree, L., P. J. Mulholland, R. S. Anderson, D. F. Garway-Heath, J. E. Morgan, and T. Redmond. 2018. Optimising the glaucoma signal/noise ratio by mapping changes in spatial summation with area-modulated perimetric stimuli. Scientific Reports:8(1):2172.
Ruia, S., and K. Tripathy. 2023. Humphrey visual field. StatPearls [Internet]. https://www.ncbi.nlm.nih.gov/books/NBK585112/ (accessed February 11, 2025).
Sadegh Mousavi, S., S. Jamali Dogahe, L. J. Lyons, and C. L. Khanna. 2024. Head turn during visual field testing to minimize the influence of prominent facial anatomy. Journal of Neuro-Ophthalmology 44(2):253–258.
Schiefer, U., J. Pätzold, and F. Dannheim. 2005. Conventional perimetry I: Introduction—basics. Ophthalmologe 102(6):627–644.
Searle, A. E., J. M. Wild, D. E. Shaw, and E. C. O’Neill. 1991. Time-related variation in normal automated static perimetry. Ophthalmology 98(5):701–707.
Sikorski, B. L., and A. Laudencka. 2020. Comparison of advanced threshold and SITA fast perimetric strategies. Journal of Ophthalmology 2020:7139649.
Sinsky, C. A., J. T. Jerzak, and K. D. Hopkins. 2021. Telemedicine and team-based care: The perils and the promise. Mayo Clinic Proceedings 96(2):429–437.
Sommer, A., J. M. Tielsch, J. Katz, H. A. Quigley, J. D. Gottsch, J. Javitt, J. F. Martone, R. M. Royall, K. A. Witt, and S. Ezrine. 1991. Racial differences in the cause-specific prevalence of blindness in east Baltimore. New England Journal of Medicine 325(20):1412–1417.
SSA (U.S. Social Security Administration). n.d.-a. Disability evaluation under social security: Social Security—2.00 special senses and speech—Adult. https://www.ssa.gov/disability/professionals/bluebook/2.00-SpecialSensesandSpeech-Adult.htm (accessed February 3, 2025).
SSA. n.d.-b. Disability evaluation under Social Security—102.00 special senses and speech—Childhood. https://www.ssa.gov/disability/professionals/bluebook/102.00-SpecialSensesandSpeech-Childhood.htm (accessed February 3, 2025).
Talib, M., G. Dagnelie, and C. J. F. Boon. 2018. Recording and analysis of Goldmann kinetic visual fields. Methods in Molecular Biology 1715:327–338.
Traquair, H. M. 1947. An introduction to clinical perimetry, 6th ed. London: Henry Kimpton Press.
Tsushima, Y., Y. Sawahata, and K. Komine. 2020. Task-dependent fMRI decoder with the power to extend Gabor patch results to natural images. Scientific Reports 10(1):1382. https://doi.org/10.1038/s41598-020-58241-x
Wall, M., K. E. Kutzko, and B. C. Chauhan. 1997. Variability in patients with glaucomatous visual field damage is reduced using size V stimuli. Investigative Ophthalmology & Visual Science 38(2):426–435.
Weber, J., and J. Caprioli. 2000. Atlas of computerized perimetry. Saunders.
Wild, J., T. Betts, K. Ross, and C. Kenwood. 1988. Influence of antihistamines on central visual field assessment. Perimetry Update 1989:439–445.
Wild, J. M. 2001. Short wavelength automated perimetry. Acta Ophthalmologica Scandinavica 79(6):546–559.
Wong, S. H., and G. T. Plant. 2015. How to interpret visual fields. Practical Neurology 15(5):374–381. https://doi.org/10.1136/practneurol-2015-001155
Wu, Y., M. Szymanska, Y. Hu, M. I. Fazal, N. Jiang, A. K. Yetisen, and M. F. Cordeiro. 2022. Measures of disease activity in glaucoma. Biosensors and Bioelectronics 196:113700.
Zaky, A. G., A. T. Yassin, and S. H. El Sayid. 2016. Short wave–automated perimetry (SWAP) versus optical coherence tomography in early detection of glaucoma. Clinical Ophthalmology 19(10):1819–1824.


