Visual Field Assessment and Disability Evaluation (2025)
Chapter: 5 Special Topics
5
Special Topics
The Social Security Administration (SSA) asked the committee to address several special topics in perimetry that pertain primarily to the acceptability of various technologies and techniques for assessing visual field loss for disability determination:
- Is optical projection of the testing stimuli still necessary to achieve valid and reliable results from a perimeter?
- How does the eye respond differently to projected versus other types of stimuli (e.g., liquid-crystal display [LCD] screens)?
- Do perimeters using frequency doubling technology produce results substantially similar to those obtained with traditional perimeters, and what differences are there?
- Is semiautomated kinetic perimetry a valid and reliable method of measuring visual field loss? What are the necessary device specifications and testing circumstances for semiautomated kinetic perimetry to produce valid and reliable visual field testing?
- What are the most widely acceptable and commonly used alternatives to kinetic perimetry, both manual and automated, for the measurement of visual field efficiency?
- What impacts do such alternative methods have on the validity and reliability of testing results?
This chapter also contains a section highlighting special considerations for evaluating perimetry in children. When developing perimetry guidelines, understanding differences related to pediatric versus adult populations is
crucial because visual field testing in children presents unique challenges and requires age-appropriate strategies. Additionally, tailoring perimetric approaches to a child’s specific developmental stage and cognitive ability ensures more reliable and informative results. This context is essential for accurately determining the role and interpretation of perimetry in children.
OPTICAL PROJECTION VERSUS SCREEN-BASED STIMULI
Across the Special Senses and Speech listings (SSA, n.d.), current SSA perimetric requirements specify the use of a white size III Goldmann stimulus against a 31.5-apostilb or 10-candela-per-square-meter (cd/m2) white background. Recent developments in perimetry, however, have included new ways to present stimuli. These include desk-based instruments that utilize screen-based stimuli (e.g., Tempo), smartphones, tablets, and virtual reality (VR) headsets. Screens on these devices use either LCDs or organic light-emitting diode (OLED) microdisplays. LCDs use passive backlit illumination, while OLED displays use active illumination.
Screen-based perimeters are typically smaller than traditional perimeters and are based on technology available to consumers at lower prices. They may therefore be cheaper, although screen-based perimeters are a relatively new technology and so at present may still be expensive. Since these perimeters are similar to consumer technology, examinees may find them easier to use than traditional perimeters. Some studies have found that acceptability for VR-based perimeters is similar to or better than that for traditional perimeters (Ahmed et al., 2022; Wroblewski et al., 2014). While some individuals may not be familiar with them, evidence also suggests that people can feasibly be trained to complete perimetry examinations successfully with VR headsets (Chia et al., 2024).
One potential downside of screen-based perimeters is that screens rely on pixelation, or the creation of images from an aggregate of individual, small points of light. This may introduce technical limitations for the presentation of perimetric stimuli. For example, a screen cannot illuminate an image smaller than the size of the pixels supported by that screen (typically, the size of an individual diode or LCD crystal). Similarly, a screen may not be able to display a perfectly circular stimulus, depending on the pixel size. However, if demonstrated to be valid and reliable with respect to disability classification tasks, these stimuli could be used in place of optical projection for visual field testing.
Effect of Stimulus Luminance on Vision
To increase the possible contrast between background and stimulus, background luminance has been lowered for some screen-based devices.
Table 5-1 summarizes the luminance of the backgrounds and stimuli used in both standard and a selection of novel perimeters.
Table 5-1 is not intended to be a complete list of the screen-based perimeters currently being developed or used; rather, it is meant to illustrate the considerable variance in parameters across such devices. Some perimeters also have unique design features. For example, Vivid Vision and C3 perform suprathreshold tests, which present stimuli significantly brighter than the expected threshold of visual detection. In other words, these stimuli can be expected to always be seen by a person of the patient’s age.
TABLE 5-1 Summary of Stimuli in Standard and Selected Novel Perimeters
| Device Name | Type | Background Luminance | Maximum Luminance | Stimulus Used |
|---|---|---|---|---|
| Humphrey Field Analyzer 3 | Standard | 10 cd/m2 | 3,183 cd/m2 | Variable |
| Octopus 900 | Standard | 1.27–10.00 cd/m2 | 1,260 cd/m2 | Variable |
| Oculus | VR | 10 cd/m2 | 88 cd/m2 | Goldmann size III |
| SmartCampiTracker | Smartphone | 0.05 cd/m2 | 500 cd/m2 | Goldmann size III |
| Toronto Portable Perimeter | VR | 10 cd/m2 | NR | Goldmann size III, IV, or V |
| Virtual Eye | OLED VR | NR | NR | Goldmann size III |
| Advanced Vision Analyzer | VR | 9.6 cd/m2 | NR | Goldmann size III |
| Olleyes VisuALL | VR | 1–3 cd/m2 | 120 cd/m2 | Goldmann size III |
| Vivid Vision | VR | 25 cd/m2 | NRa | Goldmann size III (black) |
| C3 Field Analyzer | VR | 4 cd/m2 | NRb | Goldmann size III |
| Virtual Field | VR | 0.218 cd/m2 | 87 cd/m2 | 0.55-mm circular stimuli |
| Radius | VR | 10 cd/m2 | 85 cd/m2 | Goldmann size II and III |
| TEMPO | Tabletop binocular | 10 cd/m2 | 3,183 cd/m2 | Variable (Goldmann size I through >V) |
a In contrast to most screen-based perimeters, the Vivid Vision perimeter presents small black spots of luminance 0.2 cd/m2 against a white background, rather than brighter white spots against a white background.
b Stimuli brightness was set at 60 cd/m2.
NOTES: Some articles reported using a stimulus size of 0.43°, which is equivalent to Goldmann size III. NR = not reported; OLED = organic LED; VR = virtual reality.
SOURCES: Ahmed et al. (2022); Berneshawi et al. (2024); Bradley et al. (2024); Chia et al. (2024); Grau et al. (2023); Greenfield et al. (2022); Grobbel et al. (2016); Mees et al. (2020); Narang et al. (2021); Phu et al. (2025); Razeghinejad et al. (2021); Stapelfeldt et al. (2021); Topcon Healthcare (2025); Wroblewski et al. (2014).
Suprathreshold tests are generally used as screening tests or in settings where a complete field cut (an area of blindness) is expected. Vivid Vision also employs a black stimulus on a white background. The Advanced Vision Analyzer and Virtual Field devices include built-in hardware to allow for the use of trial lenses, while the Olleyes VisuALL allows examinees to wear their own glasses, though bifocals and trifocals are not recommended for use alongside this perimeter due to possible effects on retinal sensitivity. Finally, many of these devices, especially the VR-based platforms, include fixation tracking.
Note that many novel screen-based perimeters are unable to achieve the same range of luminance as traditional perimeters. However, in theory, similar relative brightnesses can still be achieved between the background and stimulus luminance, allowing for measurement against the SSA criteria. To be able to do so, the perimeter must be able to present a contrast equivalent to 10 decibels (dB) (in turn corresponding to approximately 22 dB of sensitivity loss if the respondent cannot see it) on the Humphrey Field Analyzer. In other words, it must be equivalent to a stimulus luminance of 318 cd/m2 against a 10 cd/m2 background on the Humphrey Field Analyzer. A lower maximum stimulus intensity may be adequate if the background luminance is reduced; however, the background must still be of sufficient luminance to remain within the photopic range of sight.1 Not all of the perimeters in Table 5-1 meet both these requirements, but more may be developed in the future.
Changes in stimulus size can also be made equivalent to changes in stimulus intensity. Whether a stimulus is perceived or not depends on the number of photons stimulating the retina and the area of the retina being stimulated. The likelihood of perception can be increased by increasing either stimulus intensity or stimulus size. Some testing protocols, such as the protocol used by the Toronto Portable Perimeter, involve using a larger stimulus size to test lower-threshold sensitivity (Ahmed et al., 2022), although the data on this change in stimulus size are still emerging. A more detailed discussion of the effect of stimulus size can be found later in this chapter.
It is also necessary to consider that perimetric data are conventionally reported in decibels, which is a measure of stimulus luminance relative to the maximum that can be produced in a specific device. A higher decibel value reflects greater attenuation, or dimming, of the eye’s ability to perceive stimuli. If two devices use different background luminances, use of the same stimulus luminance on these different devices will result in a different contrast. Thus, decibel measurements produced by devices with different luminances may not be directly comparable (Phu et al., 2025). However, if the luminosity, background, perceived color, and size of a stimulus are all
___________________
1This sentence was changed after release of the report to correct the description of the range of sight.
held equal, that stimulus should be seen similarly by the eye regardless of whether the stimulus is projected or displayed on a screen, as long as the background luminance is within the limits of Weber’s law. In other words, in photopic light conditions, the smallest noticeable difference between two stimuli will be proportional to the original stimulus’s intensity, not a constant absolute difference. Under less luminant mesopic conditions, Weber’s law does not hold, but because standard methods of perimetry are performed under photopic conditions, this concern should not affect disability determination. Screen-based perimeters can strengthen this consistency by accurately measuring and reporting these metrics.
Luminance changes can cause people to use the mesopic range of vision (0.01–3.00 cd/m2) rather than the photopic range (>3.00 cd/m2). Both rods and cones are active in the mesopic range, while only cones are active in the photopic range (Bradley et al., 2024).2 The direct clinical significance of this nuance in evaluating visual field loss is currently unclear for people with glaucoma, but this can have marked effects in patients lacking rod function, as these patients may use cones only at conditions that would otherwise be in the mesopic or high scotopic range. Similarly, people who are color-blind or otherwise lacking cone function may also be affected differentially by changes in luminance. When performing perimetry tests in both of these populations, examiners need to be aware of how different light levels may affect their results.
For the purposes of identifying visual field loss as part of disability determination, clinical validation data for newer testing platforms relevant to SSA criteria for visual disability are more important than strict requirements based on stimulus type (i.e., projected versus nonprojected). Other differences in devices (e.g., background luminance, black versus white stimulus, colored stimuli) are of little importance if the validity and reproducibility of the clinical test results are demonstrated.
Conclusions
A strong and growing body of literature supports the acceptable clinical performance of perimeters that do not use optical stimulus projection. While theoretically the perception of projected and nonprojected stimuli that are otherwise similar should be the same, scientific evidence specifically evaluating the consistency of testing results using different types of stimuli is limited. Future clinical studies may fill this gap in the literature.
Screen-based perimeters may become more acceptable and reliable for the average patient, as they are both cheaper than traditional perimeters
___________________
2Rods are the cells in the retina that are sensitive to low-light conditions and are responsible for night vision. Cones are the cells that are sensitive to bright light and are responsible for color vision and seeing fine detail.
and based on common consumer electronics. VR perimeters, in particular, may be able to include eye tracking and ensure fixation, which would increase their reliability. As these technologies develop, allowing their use for SSA disability determination would make perimetry easier, more available, and less costly for more people.
At the same time, however, these new technologies come with substantial uncertainties in performance. Luminance varies significantly between different screen-based perimeters, and stimuli may not be exactly the same as in traditional perimeters because of limitations in modern screen-based technology. Many screen-based perimeters are also not able to achieve the range of luminance (especially at the dim end) that is achieved in table-top perimeters.
Device manufacturers can mitigate these challenges in a variety of ways, such as by modifying the stimulus intensity, size, and duration. Different test patterns may also be feasible in the future. In theory, variations in these design factors could result in stimuli that are functionally equivalent to those presented by traditional perimeters. As discussed in Chapter 4, effective validation of these novel technologies for use in SSA disability determination would likely involve comparing their performance on classification tasks directly to that of currently accepted projection-based methods.
Based on its review of the evidence and the committee’s expert assessment, the committee reached the following conclusions:
Conclusion 5.1: The technology used to present stimuli and backgrounds during perimetry, such as optical projection or video screens, is unlikely to have a substantial effect on visual perception or test results. However, because perimeters using nonprojected visuals have been developed only relatively recently, evaluation studies of such perimeters will be most useful if they robustly report specific testing parameters and the technical details of the device.
Conclusion 5.2: The suitability of novel perimeters for SSA’s use in disability determination is affected by their performance relative to that of current methods; comparative validation studies, ideally using SSA-relevant classification tasks, will therefore be the best way to assess suitability.
FREQUENCY DOUBLING TECHNOLOGY
Frequency doubling technology (FDT), or frequency doubling perimetry, has been used for decades, primarily as a screening device for visual impairment in the community. As in static automated threshold perimetry (SAP) protocols, FDT entails asking examinees to fixate on a central point
and indicate when they see a stimulus beyond that point. The patient indicates when they perceive the flickering stimulus, and the system records these responses. Areas where the patient fails to detect the stimulus indicate potential visual field loss.
Unlike SAP, FDT presents a pattern of alternating light and dark bars called a “sinusoidal grating.” This grating is typically set at a specific spatial frequency (e.g., 0.25 cycles per degree). The key feature of the stimulus is that it is flickered at a high temporal frequency (usually around 25 hertz [Hz]; see Figure 5-1). The visual system perceives this as a single pulse of light flickering at twice the true spatial frequency, an effect known as frequency doubling. Differences in examinees’ sensitivity to these stimuli are therefore related to the frequency of this flickering, not the luminance of the stimulus.
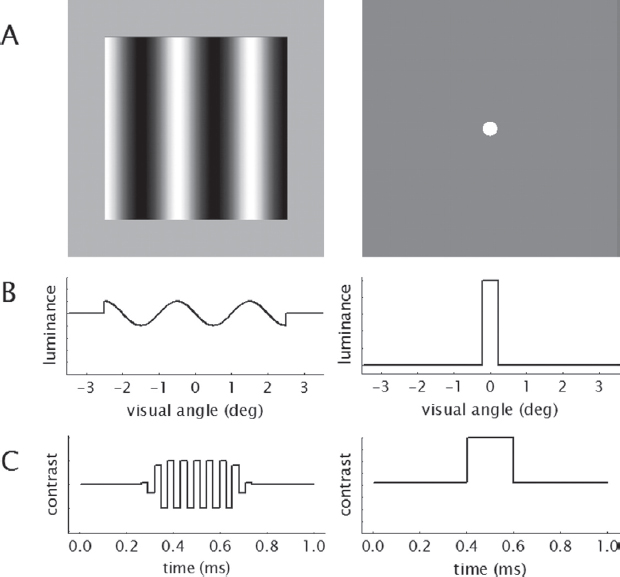
NOTES: Compared with stimuli (A) for SAP (right), those for FDT2 (left) display a “flickering” effect in bands across a subsection of the field of vision rather than appearing at a single point (B). The contrast of FDT2 stimuli with the background also flickers over time rather than appearing consistently for a brief span (C).
SOURCE: Artes et al. (2005), reproduced with permission from ARVO.
The FDT perimeter has the capacity to test with both suprathreshold strategies (such as the C-20-1 and C-20-5 patterns in the central 20 degrees) and threshold strategies (such as the N-20 and N-30). A total of 17 points are tested in the C-20 and N-20 programs. When the N-30 program is used, additional points are added nasally. When a threshold program is used, the test may take as long as 4–5 minutes; on the other hand, a suprathreshold test requires less than 1 minute per eye.
Research has demonstrated that the first-generation FDT device performs well in detecting glaucomatous visual field loss (Artes et al., 2005; Cello et al., 2000). The second generation of FDT (FDT2), also known as the FDT Matrix, presents these stimuli on a cathode ray tube with a background luminance of 100 cd/m2 for 500 milliseconds each (Artes et al., 2005).
The main difference between FDT2 and the first-generation FDT device (FDT1) is the size of the stimuli used. The stimuli in FDT2 are smaller than those used in FDT1, allowing for examination of a larger number of visual field locations (Artes et al., 2005). The result is greater detail on the spatial distribution of visual field loss, allowing greater similarity to the 24-2 and 30-2 patterns used in SAP. Moreover, while FD1 tested only 17–19 locations, FDT2 assesses contrast sensitivity at as many as 54–69 locations (corresponding to 24-2 or 30-2 SAP, respectively). FDT2 uses Bayesian statistical estimation to select stimulus locations based on the examinee’s previous responses. This testing strategy has been demonstrated to reduce the variability in testing as well as the duration of testing by 40–50 percent (Shaarawy et al., 2015). Moreover, it is recommended that refractive errors should be corrected prior to testing, since FDT2 devices may cause a loss of optical focus.
This strategy of basing an examinee’s threshold using statistical modeling based on their responses is similar to that seen in current versions of SAP. However, in contrast with Humphrey’s Swedish Interactive Threshold Algorithm (SITA) algorithm for estimating field loss in SAP, FDT2 presents four stimuli at each location regardless of the level of field loss. This ensures a uniform test duration, whereas SITA ceases to test at locations in the visual field when it determines statistically that an examinee’s threshold does not reach that location (Artes et al., 2005).
The results from FDT are typically displayed as a map of the visual field, known as a pattern deviation plot, that highlights areas of normal and abnormal sensitivity. Like the output from SAP, sensitivity (and therefore deviation) is reported in decibels (see Figure 5-2). Clinicians can analyze these data points quantitatively to assess the presence and extent of visual field defects, which can be critical for diagnosing conditions such as glaucoma and monitoring disease progression, thus assisting physicians in clinical decision making.
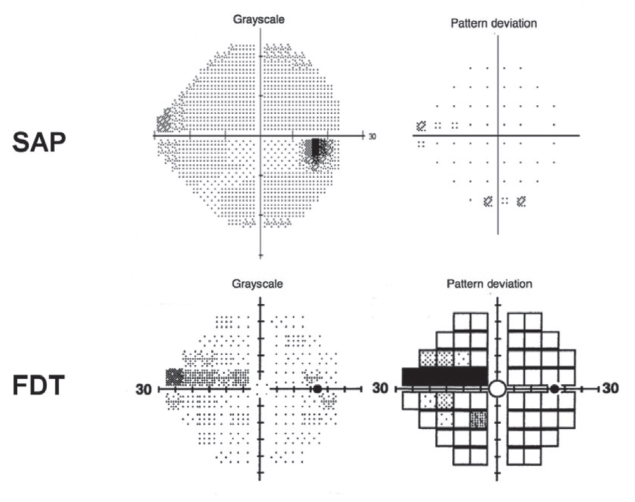
NOTES: The figure presents the visual field from a Humphrey Field Analyzer demonstrating a superior nasal step in the right eye of a patient (SAP) and a representation of the visual field from the FDT device, also showing a superior nasal step. Both visual fields are drawn from early in the disease course of glaucoma.
SOURCE: Tatham et al. (2015). Reprinted with permission from Elsevier.
FDT has several advantages compared with other devices or techniques, such as the Humphrey Field Analyzer and the Octopus. These advantages include the instrument’s portability, the ability to perform the test in ambient light, and the added comfort of allowing examinees to wear their own spectacles during testing. FDT also generally requires less training for examiners, and machines using FDT tend to be less expensive. Another advantage of FDT over SAP is that FDT features less response variability along the range of visual field losses it can measure, which makes it particularly useful for monitoring changes in visual field sensitivity over time (Spry et al., 2001). In particular, this explains FDT’s effectiveness at detecting early glaucomatous loss, when the differences from a healthy visual field are smaller and less likely to be detected. As a result, FDT features less response variability along the range of visual field losses it can measure; this makes it particularly useful for monitoring changes in visual field sensitivity over time.
The human visual system has different pathways for processing visual information, including the magnocellular (M) and parvocellular (P) pathways. The M-pathway is particularly sensitive to motion and flickering,
while the P-pathway is more sensitive to color and fine detail. FDT primarily stimulates the M-pathway, which is thought to be affected more in conditions such as glaucoma. As a result, FDT is often more sensitive to early visual field loss caused by these conditions as compared with traditional perimetry methods. Other approaches can be used for individuals with deficits in the P-pathway.
Because FDT reports sensitivity similarly to traditional perimetry techniques such as SAP, SSA could theoretically use it for disability determination. However, assessing the accuracy and similarity of the results obtained with the two technologies will be important to determining whether such use is feasible.
Comparison of FDT with Traditional Perimeters
The majority of research comparing FDT with standard perimetry has been conducted in the context of detecting early glaucomatous field loss. For early or otherwise mild glaucoma-related visual field loss, studies have shown that FDT performs as well as or better than SAP (Burnstein et al., 2000; Ferreras et al., 2007). FDT has also been shown to display results comparable to those obtained with SAP when used with people who have optic nerve disorders or postchiasmal visual field defects (Huang et al., 2008; Wall et al., 2002; Yoon et al., 2012).
Since people applying for SSA disability benefits will typically have relatively more severe impairments, the relevance of these findings to accuracy in SSA disability determinations is unclear at best. In populations with more severe conditions, comparisons between SAP using the Humphrey Field Analyzer and FDT have yielded mixed results, with some studies showing lower levels of agreement and others showing higher levels of agreement between the two (Artes et al., 2005; Casson and James, 2005; Clement et al., 2009; Doozandeh et al., 2017; Haymes et al., 2005).
Because of its portability and ease of use in the community, FDT has held promise for screening populations. However, some studies suggest that this application of FDT may not be the most effective approach. For example, Boland and colleagues (2016) concluded that FDT, as a standalone test, does not have the sensitivity and specificity necessary to detect conditions that may cause serious impairment, such as glaucoma and retinal degeneration, because it likely underestimates the degree of field loss in such examinees. FDT may also not provide sufficiently reliable results in patients with cataracts, making it difficult to determine whether there is a defect using this technology (Casson and James, 2006). On the other hand, there may be some benefits to using FDT with individuals who are inexperienced with perimetric testing (Pierre-Filho Pde et al., 2006).
Conclusions
In summary, FDT is a specialized method that utilizes high-frequency flickering stimuli to assess the integrity of the visual field. It is typically used as a screening test, especially for early or mild visual field impairment caused by glaucoma. Perimeters using FDT tend to be less expensive and easier to use than SAP for both clinicians and examinees.
FDT and SAP tend to display similar results for early or mild glaucomatous impairment. Although findings across studies are mixed regarding FDT’s sensitivity, specificity, and agreement with SAP, these differences are greatest in cases of severe impairment. FDT also gives very poor results in patients with cataracts, making it difficult to interpret results and potentially leading to results that may not reflect a true defect. Ultimately, more research validating the use of FDT for diagnostic tasks such as those performed by SSA is needed.
Based on its review of the literature and the committee’s expert assessment, the committee reached the following conclusions:
Conclusion 5.3: Second-generation frequency doubling technology (FDT2) devices have demonstrated similarity to traditional perimeters in the measurement of visual field contrast sensitivity; however, most studies thus far have been conducted in individuals with mild to moderate visual impairment. Additional studies are needed to determine the suitability of these devices for assessing visual function in individuals with severe visual impairment.
Conclusion 5.4: Because of its portability and lower cost, frequency doubling technology is likely to be particularly useful in settings where patients have limited access to static automated threshold perimetry and other traditional perimeters.
SEMIAUTOMATED KINETIC PERIMETRY3
As discussed in Chapter 3, the stimulus presented in a perimetry test can be either static or kinetic. In static perimetry, stimuli are presented one at a time at defined points in the visual field, and examinees are asked to indicate when they see a stimulus. Stimuli presented for longer durations of time may be seen better as a result of temporal summation of information,
___________________
3In much of the literature, as well as in the SSA listings and in this report’s statement of task, the term automated kinetic perimetry is commonly used as interchangeable with semiautomated kinetic perimetry. However, this report uses the term semiautomated kinetic perimetry to make clear the role of the examiner in performing this type of examination.
although limited additional benefit is derived beyond times over 0.1 second. Most commonly used static perimeters, such as the Humphrey Field Analyzer and the Octopus, are automated. Before the test, the examiner typically selects the size of the stimulus, and then the visual field test is executed using the instrument’s software and algorithm. Static perimeters are widely available, relatively fast, and particularly sensitive to detecting early visual field loss from glaucoma. Compared with kinetic perimeters, however, they require greater patient concentration and may be less efficient in delineating complex lesions that extend into the peripheral field and localizing occipital lobe lesions.
In kinetic perimetry, the stimulus is usually moved from an area without vision (“subthreshold”) to one with vision (“suprathreshold”), and the examiner records the location at which the stimulus is first seen. To test different areas of the visual field, this process is repeated along multiple meridians (i.e., differently angled lines through the center of the visual field). The speed at which the stimulus is moved should be standardized and typically ranges from 2 to 4 degrees per second. This technique tests the thresholds of a person’s visual field directly.
The stimulus can also be moved from a seeing area to a nonseeing area, which may be especially helpful in mapping out more complex ring scotomas. Employing both methods may minimize the bias in outlining intricate islands of vision, such as those associated with conditions such as retinitis pigmentosa. Testing in both directions can therefore provide useful clinical information in some cases.
Even so, it is relatively uncommon; losing out on this information (such as by only performing the typical method of kinetic perimetry) is unlikely to affect Social Security disability benefits eligibility for the vast majority of applicants. Since the measurement of disability requires estimating the extent of the visual field along standardized meridians, the usual subthreshold-to-suprathreshold method is unlikely to underestimate visual field loss as it relates to disability, except for people with central visual loss, such as might be seen with macular degeneration, and those people often have disabling levels of visual acuity or would qualify for disability benefits otherwise.
Unlike static perimeters, most kinetic perimetry techniques, including Goldmann perimetry and tangent screening (detailed in Chapter 2), are manual; that is, the examiner physically moves the stimulus and records the examinee’s responses. This makes the test relatively time consuming, and the manual element creates a risk of bias and nonreproducibility in the results (Bevers et al., 2019). However, a skilled examiner can assess the likelihood of error during the test based on the plausibility of reported results (Mönter et al., 2017). This capability can mitigate the
possible response bias introduced by single self-reported responses close to a threshold.
Fully automated, computer-guided kinetic perimetry may theoretically eliminate examiner bias, but it would not be able to mitigate response bias. Moreover, preset automated kinetic testing patterns, such as those available for the Humphrey Field Analyzer, may not offer the flexibility to search for more central scotomas. As a result, fully automated kinetic perimetry has not been widely validated in the literature, nor is it widely available (Bevers et al., 2019; Mönter et al., 2017).
Semiautomated kinetic perimetry is more common. In this method, the examiner still sets the size and intensity of the stimulus, while the pattern and movement of stimuli are controlled by a computer. This method combines automated features with manual retest and customized testing patterns to allow for greater flexibility. The speed and test pattern are standardized, and greater accuracy in examinee responses is achieved (Barnes et al., 2019). By comparing the advantages and disadvantages conferred by this type of automation with manual methods, SSA can consider the additional value that semiautomated kinetic perimetry can bring to disability determinations.
Kinetic Perimetry for Social Security Disability Determinations
For SSA disability determination, manual or semiautomated kinetic perimetry is used primarily for assessing visual field efficiency pursuant to Section 2.03C of the listings. Under this section, SSA calculates a person’s “visual field efficiency,” which corresponds to the percentage of a typical visual field that a person can see through their better eye. Specifically, visual field efficiency is calculated by adding the number of degrees a patient sees along the eight “principal” meridians found on a visual field chart (Figure 5-3), each located 45 degrees apart, in their better eye, and dividing by five. Since the extent of the normal visual field at each meridian adds up to 500,4 the sum of the patient’s extent along each meridian is divided by five to calculate their visual field efficiency. To meet the minimum listing criteria for disability in Section 2.03C, the visual field efficiency in the better eye must be 20 percent or less after this calculation. A more detailed discussion of SSA’s methodology can be found in Chapter 1.
___________________
4SSA’s normal visual field extent at the eight principal meridians is 85 degrees (temporally), 60 degrees (up temporally), 45 degrees (superiorly), 55 degrees (up nasally), 60 degrees (nasally), 55 degrees (down nasally), 60 degrees (inferiorly), and 80 degrees (down temporally) (SSA, n.d., 2.00A7cB).
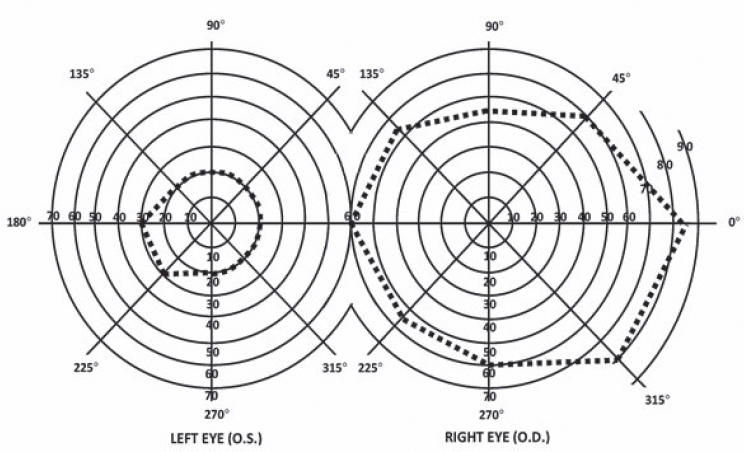
NOTE: The diagram for the right eye shows a typical visual field extent drawn in dashed lines. The diagram for the left eye shows a constrained visual field; a healthy visual field would be a mirror image of the right eye’s field shape. In addition, the degrees assigned to each meridian are not mirrored and instead remain the same.
SOURCE: SSA (n.d., 2.00A7cB).
Validity and Reliability of Semiautomated Kinetic Perimetry
Results obtained with semiautomated kinetic perimetry are similar to those obtained with typical manual kinetic perimetry. Differences found in the literature between visual fields measured with semiautomated and manual kinetic methods are generally either small or not statistically significant (Barnes et al., 2019; Hashimoto et al., 2017; Nowomiejska et al., 2005; Rowe and Rowlands, 2014). The two types of kinetic perimetry have similar test durations (Patel et al., 2018; Rowe and Rowlands, 2014).
More important, however, is the ability of semiautomated kinetic perimetry to yield results similar to those obtained with the “gold standard” Humphrey Field Analyzer and other static automated threshold perimeters. If the outputs are similar, then SSA’s assessment of disability is likely to be similar using either technique. As discussed in Chapter 4, studies comparing disability evaluation findings using each method would have been the most informative for this report; however, the committee found no such studies in the literature. Direct comparisons of field size or radius found via static and kinetic perimetry are similarly difficult because of mathematical differences in the respective methodologies
(Christoforidis, 2011). Therefore, comparisons between semiautomated kinetic perimetry and SAP tend to focus on diagnostic agreement, test duration, and test–retest reliability.
It is important to note that diagnostic agreement between semiautomated kinetic perimetry and SAP may be condition dependent. Studies assessing diagnostic agreement compare perimeters across several measures, such as match rate of visual field identification as normal or abnormal, defect type, and defect severity. Table 5-2 summarizes such studies comparing semiautomated kinetic perimetry from an Octopus perimeter with SAP from a Humphrey Field Analyzer.
| Study | Year | N | Clinical Context | Metric | % Agreement | Notes |
|---|---|---|---|---|---|---|
| Rowe et al. | 2013 | 64 patients, 113 eyes | Neuro-ophthalmic disease | Normal/abnormal | 73.5% | I4e target |
| Normal/abnormal | 80% | I2e target | ||||
| Normal/abnormal | 87% | Combined | ||||
| Nowomiejska et al. | 2009 | 13 patients, 26 eyes | Bilateral visible optic nerve head drusen | Clinical description | 73% | |
| Bhaskaran et al. | 2021 | 17 patients, 26 eyes | Various | Normal/abnormal | 88% | |
| Normal/abnormal | 80%–89% | By quadrant | ||||
| Diagnostic pattern | 54%–65% | |||||
| Diagnostic pattern | 95% | Central and paracentral scotomata excluded | ||||
| Rowe et al. | 2015 | 50 patients, 100 eyes | Pituitary disease | Defect type | 58% | |
| Defect severity | 50% | |||||
| Patel et al. | 2019 | 30 patients, 60 eyes | Pediatric neuro-ophthalmic disease | Defect type | 69% | |
| Defect severity | 50% |
The agreement found in the literature between these two types of perimeters ranges from moderate to good. Semiautomated kinetic perimetry demonstrates a good ability to differentiate between normal and abnormal visual fields as compared with the same identification performed with SAP (Bhaskaran et al., 2021; Rowe et al., 2013). However, results are less similar when clinical features such as defect type and severity are matched (Bhaskaran et al., 2021; Nowomiejska et al., 2009; Patel et al., 2015; Rowe et al., 2015).
It is important to note that while semiautomated kinetic perimetry tests along an entire meridian and can test the full visual field, static perimetry of all types samples individual points in the visual field and typically tests only the central portion of the field. Some of the differences in agreement between the techniques may be due to the differences in how each technique measures the visual field rather than potential weaknesses in a technique’s ability to perform such measurement.
Bhaskaran and colleagues (2021), however, found that once readings featuring central and paracentral scotomatas were excluded, the sensitivity of the Octopus (semiautomated kinetic) perimeter for detecting defects increased to 95 percent when the Humphrey Field Analyzer (static automated threshold perimeter) was used as a baseline. This finding is consistent with findings that semiautomated kinetic perimetry performs best at assessing the peripheral visual field, findings that are also reflected in SSA’s preference for manual kinetic perimetry or SAP when scotomatas or other severe constrictions in the central visual field are indicated. Weaknesses of SAP in measuring visual field loss at the periphery, as well as their implications for measuring against the SSA criteria, are discussed in a later section.
With respect to differences in test duration between static and kinetic methods, evidence is mixed as well (Nowomiejska et al., 2015; Rowe et al., 2013, 2015, 2021).
Finally, the test–retest reliability of semiautomated kinetic perimetry is similar to that of SAP (Mönter et al., 2017; Nevalainen et al., 2008).
In general, despite some findings of only moderate agreement, kinetic perimetry offers several unique advantages over static perimetry, many of which have been specifically demonstrated in semiautomated kinetic perimetry. For example, because static perimetry typically tests only the central visual field, it may fail to detect “residual islands of sensitivity” in the mid-periphery or periphery (Patel et al., 2018). This may occur with conditions such as retinitis pigmentosa or other retinal dystrophies commonly needing disability determination. On the other hand, because kinetic perimetry can test the full field of vision, it is preferred for testing the peripheral visual field (Keltner et al., 1999; Simpson, 2017). Semiautomated kinetic perimetry also can supplement static perimetry when additional information about
the periphery would be clinically useful (Ma et al., 2021; Patel et al., 2018; Rowe et al., 2021). Kinetic perimetry may also be preferred for examining visual fields in children. Even though semiautomated kinetic perimetry can entail longer test durations in a pediatric setting, they tend to be more feasible for children compared with SAP (Patel et al., 2015; Wilscher et al., 2010).
However, the primary advantage of semiautomated kinetic perimetry is its ability to standardize the movement of a stimulus. In manual kinetic perimetry, the examiner moves the stimulus, which leads to considerable interoperator variability in stimulus velocity and examiner reaction time. While patient reaction time remains a factor in both semiautomated and manual kinetic perimetry, examiner biases can be reduced with semiautomated methods (Bhaskaran et al., 2021; Nowomiejska et al., 2010). Further standardization of measurement procedures has eliminated differential results between semiautomated kinetic perimetry and SAP in some studies (Phu et al., 2016, 2018).
Conclusion
Semiautomated kinetic perimetry can be used to determine disability as defined by SSA. It can be used to evaluate peripheral defects outside the central 30 degrees of the visual field (i.e., to the full 90 degrees with a range of 47 dB), a requirement for calculating visual field efficiency as defined by SSA (Section 2.03C). Regarding other pathways to qualifying for disability benefits, semiautomated kinetic perimetry adds value over manual kinetic perimetry because the learning curve is shorter, and operators require less technical expertise and training.
At the same time, however, kinetic perimetry (either manual or semiautomated) has limitations. It tends to be less concordant with static methods when the central visual field is being assessed and, therefore, is often suggested in the literature to be used at the periphery (Mönter et al., 2017; Rowe et al., 2015). To realize the full potential of kinetic perimetry for full-field and peripheral visual field assessment, an examiner needs experience and training beyond that required by static perimetry. A skilled technician can monitor for fixation loss, check for false negatives or positives, and plot more complicated scotomas. In particular, ineffective monitoring of fixation can lead to overestimation of visual field performance. As a result, static perimetry may be preferred if there is generalized constriction of the visual field, and neither peripheral “islands of vision” nor ring scotomas are likely. SAP uses standardized algorithms to plot threshold sensitivities within the central 48–60 degrees of the visual field automatically.
Acquiring an Octopus perimeter (the most common platform capable of performing semiautomated kinetic testing) may be prohibitively
expensive, and even where these perimeters are available, adequately trained technicians may not be available outside specialized clinics. If Octopus perimeters were the only machines SSA considered acceptable for employing semiautomated kinetic strategies, then given the associated cost and training constraints, permitting the use of semiautomated kinetic perimetry could lead to only modest improvements in the availability of visual field testing. On the other hand, some clinics may have only an Octopus or other semiautomated kinetic perimeter, or an individual clinician may prefer using semiautomated kinetic perimetry.
Based on its review of the literature, the committee reached the following conclusion:
Conclusion 5.5: When administered by a skilled technician, semiautomated kinetic perimetry has sufficient accuracy in quantifying visual field efficiency for use by SSA in disability determinations.
ALTERNATIVES TO KINETIC PERIMETRY FOR TESTING VISUAL FIELD EFFICIENCY
As discussed above and in Chapter 1, the SSA listings allow for a determination of disability with the finding of a visual field efficiency of less than or equal to 20 percent in the better eye after SSA’s calculation in Section 2.03C is applied. Manual kinetic perimetry (most commonly performed with a Goldmann perimeter) and semiautomated kinetic perimetry (most commonly performed with an Octopus perimeter) are the two types of tests SSA permits for measurement of visual field efficiency. Other tests, including SAP and those considered to be screening methods, such as confrontation tests or tangent screens, are not currently permitted for measurement of visual field efficiency.
Results from SAP could theoretically be used to calculate visual field efficiency. An examiner could use a transparent overlay outlining the eight principal meridians on the results (or printout) from a Humphrey Field Analyzer or similar static automated threshold perimeter to calculate the visual field limits as required under Section 2.03C. This approach would be in line with disability determination procedures of other agencies (see Chapter 2), which allow for the use of other methods, including SAP.
These automated static methods can consist of either threshold tests, which calculate the precise sensitivity of various locations in the eye, or suprathreshold tests, which instead make a binary determination as to whether a stimulus is visible at the same locations. While SSA typically uses threshold testing, such as most perimetry performed using a Humphrey Field Analyzer, an alternative could be the use of tests that display suprathreshold stimuli (i.e., stimuli that are significantly brighter than the
expected threshold of visual detection) at every test location. The goal of this testing would not be to determine the precise sensitivity at any specific spot in the visual field but would be to make a simple binary determination as to whether an examinee could see at that location. As a result, suprathreshold tests are typically used as screening tests.
Utility of Screening Tests in SSA Disability Determination
Screening tests usually take less time than threshold tests. Furthermore, they can measure the periphery farther out than is possible with threshold tests. In addition, screening tests can be performed with both eyes to evaluate for binocular field loss, such as might be seen from postchiasmatic (i.e., farther down the optic nerve) damage to the visual pathways. Indeed, a recent survey of neuro-ophthalmologists indicated that the Esterman (monocular and binocular) and 120-point screening strategies were on the “short list” of preferred methods for evaluating the visual sequelae of common conditions such as stroke, optic neuropathy, and chiasmic compression (Hepworth and Rowe, 2019).
Since screening tests employ suprathreshold brightness, they may underestimate the full extent of visual field loss (i.e., have lower sensitivity) compared with a threshold test (Ayala, 2012). In the appropriate clinical setting, a screening test demonstrating sufficient visual field loss for a determination of disability under SSA policy would not require further testing with a threshold test. However, a patient with suspected or known visual field loss whose screening test did not demonstrate sufficient field loss to support a disability claim might require further testing with a threshold strategy. In summary, screening methods may yield reliable results depending on the details of the screening method and the examinee’s circumstances.
Differences between Static and Kinetic Perimetry Relevant to Disability Determination
A detailed comparison of the use of static and kinetic perimetry for visual field assessment and disability determination can be found in the prior section. When multiple methods are permitted for disability evaluation, it is important that they either yield similar results in similar circumstances or have distinct advantages in evaluating different clinical presentations. In either case, all acceptable methods would ideally qualify and disqualify the same people for SSA disability benefits. However, static perimetry faces two methodological challenges as a potential alternative to kinetic perimetry for measurement of visual field efficiency: First, as noted earlier, static perimetry used in the clinical setting typically measures only the central 60 degrees of the visual field. Second, SSA requires that static perimetry tests use the size III Goldmann stimulus.
Peripheral Visual Field Measurement
As discussed in the previous section, SSA defines visual field efficiency as the sum of the extent of a person’s visual field across each of eight principal meridians divided by five. In other words, it is the percentage of a typical visual field that a person can see through their better eye. Calculating visual field efficiency requires an assessment of the full visual field, since vision along some meridians typically extends out to 85 degrees from the point of central fixation.
Current algorithms for visual field threshold estimation, such as the SITA available on Humphrey and Octopus perimeters, generally do not support measurement at the outer peripheral fields. Examiners can use these algorithms for peripheral threshold testing, but the mathematical models are not as well validated for the periphery. The result is longer testing times, even with ideal testing methodology for the far periphery (Wall et al., 2019). Test duration, in turn, is inversely related to reliability (Yohannan et al., 2017). As a result, many automated static perimeters provide test patterns that do not extend to the farthest reaches of the periphery. However, they may be still labeled as “full field” patterns. Examples include the following:
- The Humphrey Field Analyzer’s 60-4 test measures 60 points from 30 to 60 degrees (Carl Zeiss Meditec, 2003).
- The Octopus perimeter’s N pattern measures 71 points extending from 40 degrees nasally to 67 degrees temporally and 40 degrees vertically (Racette et al., 2019).
- The Octopus perimeter’s 07 pattern measures 130 points extending from 70 degrees temporally to 55 degrees nasally (Racette et al., 2019).
Notably, these strategies do not fully contain all the points required by SSA for the calculation of visual field efficiency.
Stimulus Size
SSA currently requires that SAP tests use a white size III Goldmann stimulus, which is 0.43 degrees in diameter and 4 mm2 in area. Although no type of static perimetry is currently allowed for the measurement of visual field efficiency (it is used primarily in other methods for visual field–based disability evaluation), the requirement for a size III stimulus would make such assessments difficult if they were allowed.
Most static perimeters can also use a Goldmann size V stimulus, which is 1.72 degrees in diameter and 64 mm2 in area. Size V stimuli are used most commonly to test people with extremely low vision (Morgan et al., 2019). However, when used for routine perimetric testing and monitoring
of people with various visual impairments, size V stimuli have been found to maintain several advantages over size III stimuli.
Because size V stimuli are larger, they are easier to notice when all else is held equal. Since the examinee is able to respond to more stimuli, using a size V stimulus increases test duration (Sood et al., 2021). Typically, a longer test duration reduces reliability (Yohannan et al., 2017). However, studies of perimetry using size V stimuli consistently report lower test–retest variability and higher repeatability (Davis et al., 2011; Flanagan et al., 2016; Gardiner et al., 2013; Wall et al., 2008, 2013). This is likely because using a size V stimulus increases sensitivity; a person who has sight in a part of their visual field is more likely to notice a larger stimulus than a smaller one (Gardiner et al., 2013; Morgan et al., 2019).
In theory, larger stimuli may be more apparent to people with early impairment. For example, larger stimuli could stimulate the healthy, seeing regions surrounding a scotoma (Gardiner et al., 2015). However, several studies have found no significant difference between size III stimuli and size V stimuli in the number of points detected (Flanagan et al., 2016; Phu et al., 2017; Wall et al., 2013). When stratifying by the examinee’s mean deviation (i.e., average sensitivity deviation from normal values for all measured visual field locations), Wall and colleagues (2013) found that size V stimuli were the most sensitive. While these larger stimuli may result in slightly different mean deviation scores, the committee believes that this difference will not impact determination outcomes for most people with severe enough defects to be evaluated by SSA. Moreover, when size V stimuli are used because of a person’s poor visual acuity, that visual acuity may qualify them for disability benefits anyway. As a result, reliability for the classification task considered in this report is unlikely to be affected by underestimations of defect depth.
Larger stimuli may perform better in particular at the far periphery. Flanagan and colleagues (2016) found that a size V stimulus was detectable at more locations outside the central visual field, a finding consistent with findings that outside of the central 30 degrees from the point of central fixation, size III stimuli have worse variability and sensitivity (Wall et al., 2019). Given that measurement of visual field efficiency requires assessment of the full visual field, use of a size V stimulus would likely result in more reliable results for disability determination purposes.
Conclusion
While SAP is available to measure peripheral vision, it may not suffice for measuring the full extent of the visual field as required by SSA for the calculation of visual field efficiency. For most people seeking disability benefits, however, this limitation does not make much of a difference; a person
found to qualify for disability benefits using a 60 degree perimeter likely would have a sufficiently constrained visual field to qualify, and would not need additional testing with a perimeter to test further boundaries. Furthermore, SAP is far more commonly available today than semiautomated kinetic perimetry, and it can be performed with more consistency and less examiner bias than manual kinetic perimetry.
Allowing the use of static automated threshold perimetry for assessing visual field efficiency may yield uncertain or inadequate results in some scenarios. Since all of the current commercially available instruments and testing methods have their own limitations with respect to the clinical information they provide, multiple tests with the same method or an array of methods may be required to provide a better understanding of the extent of visual field loss. For example, kinetic perimetry could be used to determine the extent of the peripheral visual field, while a more centrally focused SAP test could be used to establish the extent of the central field.
Although SAP is not a “one-to-one” substitution for manual or semiautomated kinetic perimetry, it usually can provide the data required to calculate visual field efficiency. However, there may be rare exceptions. It is theoretically possible that a ring scotoma, such as those seen in retinitis pigmentosa, could leave the entire visual field past 60 degrees unaffected. Using SAP for visual field efficiency measurement could result in a technical “false positive” that would result in approving that person for disability benefits. However, the committee believes that the overall disability experienced by such a patient with significant ring scotomas or midperipheral visual field loss is otherwise likely to provide sufficient evidence to result in a disability determination.
Use of a larger stimulus size can increase the reliability of SAP at the periphery. The currently mandated size III Goldmann stimulus has resulted in increased intertest variability and lower sensitivity, especially at the periphery. Size III stimuli may be sufficient for testing the central visual field, and therefore sufficient for disability determinations not based on visual field efficiency. However, a size V stimulus would be more feasible and reliable if SAP were used to assess visual field efficiency.
Based on its review of the literature, the committee reached the following conclusions:
Conclusion 5.6: Despite the limitations of static automated threshold perimetry (SAP) in measuring peripheral field loss, this method can usually provide the data necessary to calculate the visual field efficiency of an applicant for SSA disability benefits.
- Visual field efficiencies calculated using SAP will generally be diagnostically equivalent to those calculated using currently approved manual (Goldmann) kinetic or semiautomated kinetic
- perimetry; applicants who qualify for benefits using one will almost always qualify using the other.
- Even in exceedingly rare scenarios in which a person qualifies for disability benefits based on SAP assessment of visual field efficiency whereas in fact, the regions of the peripheral visual field outside the region mapped by SAP have preserved vision to a degree that the true visual field efficiency would not meet SSA requirements, the overall disability experienced by the applicant is likely to provide sufficient evidence to result in a disability determination.
Conclusion 5.7: The use of larger stimuli, further diagnostic tests, and other clinical data can improve the diagnostic reliability of static automated threshold perimetry for the calculation of visual field efficiency.
PEDIATRIC CONSIDERATIONS
Childhood visual disability is a significant public health concern in the United States. The number of pediatric ophthalmologists is limited nationally, and access to pediatric eye care is particularly poor in rural and other medically underserved areas (Oatts et al., 2023; Walsh et al., 2023). Lack of access to timely vision screenings or eye care can lead to unnecessary vision loss; approximately half of all childhood blindness is preventable or treatable (Lim et al., 2023).
In the present context, obtaining diagnoses and information necessary to meet SSA’s disability criteria may also be delayed. These diagnoses are already challenging; perimetry has several limitations when performed in children, which can further exacerbate their difficulties in receiving disability benefits for visual field loss.
Equipment Challenges in Pediatric Perimetry
Device-specific considerations relevant to children include physical discomfort; lack of age-specific normative databases; and the role of emerging technology, such as VR perimetry.
Standard perimetry hardware, such as the Humphrey Field Analyzer, was developed for adults, which makes positioning a child for perimetry difficult. Often, for example, children’s feet cannot reach the ground. This physical discomfort can have a negative influence on test reliability. As mentioned previously, VR perimetry is an emerging technology that holds significant promise for use in children for this reason. VR devices eliminate the ergonomic concerns related to larger, traditional perimeters. Children can sit or stand comfortably, although very young children may find the VR headset
heavy or too large. VR perimetry may also appeal to children because of its novelty and similarity to other technologies they enjoy, such as screen- and VR-based games. Child-specific algorithms, such as those asking examinees to land a rocket spaceship on a planet, can incorporate elements of game playing and keep the child engaged during testing (Groth et al., 2023).
The literature evaluating the use of VR perimetry in children is nascent but growing (Groth et al., 2023; Mesfin et al., 2024; Wang et al., 2023). Generally, these studies have shown good correlation with traditional perimetry, as well as high levels of acceptability in children. The same limitations of these devices in adults—the validity of screen-based stimuli and the presence or absence of eye-tracking technology to ensure fixation—apply also to children.
Statistical Challenges in Pediatric Perimetry
Another limitation entailed in interpreting the results of perimetry in children is the absence of comprehensive normative databases specifically for this population. Such databases offer a statistical profile of a typical population with regard to visual field extent. Automated static perimeters, such as the Humphrey Field Analyzer, use these databases as part of their mathematical modeling of the examinee’s visual field.
Adult normative databases may not be directly applicable to younger populations. Several independent research groups have worked to publish normative databases for children using both standard and emerging technologies (Groth et al., 2023; Patel et al., 2015). While these efforts are important, they may not readily or automatically be integrated into the test printouts from device manufacturers. Until the typical visual field extents for children are better understood and normative databases have been published, however, greater methodological flexibility may make it easier for children with visual field loss to access disability benefits.
The reliability of visual field tests is a special consideration in children as well. Younger children may not be able to complete a visual field test because of lack of understanding or cooperation, and children who do complete the testing may produce unreliable results based on traditional reliability metrics. A study of more than 100 children aged 18 and younger with glaucoma or suspected glaucoma found that only approximately half of their visual field tests were considered reliable in this population based on manufacturer-recommended reliability guidelines (Kumar et al., 2024).
Additionally, a significant learning effect was not observed, meaning that children whose first visual field test was unreliable were unlikely to produce reliable tests on subsequent examinations. Factors associated with greater odds of test reliability included older age, better best-corrected visual acuity, and speaking English as the primary language. Finally, the
setting for visual field testing can impact results in children. Creating a child-friendly environment can improve test performance, as can the presence of a skilled technician familiar with pediatric patients. These skilled technicians can also offer insight as to a child’s visual status, especially when the child is unable to comply with perimetric testing.
Conclusion
Given the practical considerations involved in evaluating visual fields in children across a range of ages and developmental statuses, there is particular value in providing increased flexibility in perimetry requirements in this population. Additionally, newer technologies have the potential to address challenges associated with performing perimetric examinations in children. For example, VR-based platforms may be more comfortable for children than larger traditional perimeters, and they can incorporate design features, such as game-like features and eye tracking, that can keep the child engaged during the test. Saccadic vector optokinetic perimetry, based on principles of oculokinetic perimetry (see Chapter 3), is another option for measuring visual fields in pediatric patients, especially younger children who are not yet able to perform quantitative visual field testing.
In contrast to adults with visual impairment, many children with visual impairment severe enough to qualify for SSA disability benefits have other comorbid health conditions (Salt and Sargent, 2014). In evaluating perimetry to determine visual disability in children, flexibility is needed in the requirement for formal visual field testing in those children who cannot comply with this requirement because of their developmental or health status.
Based on its review of the literature, the committee reached the following conclusion:
Conclusion 5.8: There is particular value in increased flexibility in perimetry requirements for children, given the practical considerations involved in evaluating visual field in this population across a range of ages and developmental and health statuses. Newer technologies, such as screen-based perimeters using perimetry methods that incorporate game-like features or oculokinetic perimetry, have the potential to address these challenges in pediatric perimetry and yield valid information for the identification of SSA-qualifying visual field loss.
SUMMARY
In considering expansion of the perimetric devices allowed as part of SSA’s disability determinations, the primary factors to balance are the accessibility of tests and equipment currently required and the ability of a
new technique to assess visual field loss accurately, as compared with current methods. While it is important that all approved methods yield results as similar to one another as possible, even the “gold standard” Humphrey Field Analyzer displays intertest variation and sensitivity concerns in certain clinical contexts. While SAP (for visual field efficiency measurement) and frequency doubling technology (for general perimetric use) may not have full concordance with the methods currently preferred by SSA, they are far more available and less expensive, and evidence suggests that they yield measurements similar to those of the currently preferred perimeters. If an individual visual field test does not provide enough information, SSA can request further tests to confirm borderline results. Allowing these alternative techniques would help more people acquire the medical information they need to apply for SSA disability benefits.
Other technologies remain promising but currently lack the evidence base needed to determine their diagnostic agreement with standard methods. In theory, stimuli displayed on LCD and OLED displays can be modified for functional equivalence with Goldmann size III stimuli, but validation studies into screen-based perimetry are nascent. Of particular interest is that emerging technologies such as VR and other screen-based methods can be adapted for use in the pediatric setting. As child-specific perimeters are developed using these platforms, more data will be available to determine their acceptability for disability determination.
REFERENCES
Ahmed, Y., A. Pereira, S. Bowden, R. B. Shi, Y. Li, I. I. K. Ahmed, and S. A. Arshinoff. 2022. Multicenter comparison of the Toronto portable perimeter with the Humphrey field analyzer: A pilot study. Ophthalmology Glaucoma 5(2):146–159.
Artes, P. H., D. M. Hutchison, M. T. Nicolela, R. P. LeBlanc, and B. C. Chauhan. 2005. Threshold and variability properties of matrix frequency-doubling technology and standard automated perimetry in glaucoma. Investigative Ophthalmology & Visual Science 46(7):2451–2457.
Ayala, M. 2012. Comparison of the monocular Humphrey visual field and the binocular Humphrey Esterman visual field test for driver licensing in glaucoma subjects in Sweden. BMC Ophthalmology 12:1–7.
Barnes, C. S., R. A. Schuchard, D. G. Birch, G. Dagnelie, L. Wood, R. K. Koenekoop, and A. K. Bittner. 2019. Reliability of semiautomated kinetic perimetry (SKP) and Goldmann kinetic perimetry in children and adults with retinal dystrophies. Translational Vision Science & Technology 8(3):36–36.
Berneshawi, A. R., A. Shue, and R. T. Chang. 2024. Glaucoma home self-testing using VR visual fields and rebound tonometry versus in-clinic perimetry and Goldmann applanation tonometry: A pilot study. Translational Vision Science & Technology 13(8):7–7.
Bevers, C., G. Blanckaert, K. Van Keer, J. F. Fils, E. Vandewalle, and I. Stalmans. 2019. Semi-automated kinetic perimetry: Comparison of the Octopus 900 and Humphrey visual field analyzer 3 versus Goldmann perimetry. Acta Ophthalmologica 97(4):e499–e505.
Bhaskaran, K., S. Phuljhele, P. Kumar, R. Saxena, D. Angmo, and P. Sharma. 2021. Comparative evaluation of octopus semi-automated kinetic perimeter with Humphrey and Goldmann perimeters in neuro-ophthalmic disorders. Indian Journal of Ophthalmology 69(4):918–922.
Boland, M. V., P. Gupta, F. Ko, D. Zhao, E. Guallar, and D. S. Friedman. 2016. Evaluation of frequency-doubling technology perimetry as a means of screening for glaucoma and other eye diseases using the national health and nutrition examination survey. JAMA Ophthalmology 134(1):57–62.
Bradley, C., I. I. K. Ahmed, T. W. Samuelson, M. Chaglasian, H. Barnebey, N. Radcliffe, and J. Bacharach. 2024. Validation of a wearable virtual reality perimeter for glaucoma staging, the nova trial: Novel virtual reality field assessment. Translational Vision Science & Technology 13(3):10.
Burnstein, Y., N. J. Ellish, M. Magbalon, and E. J. Higginbotham. 2000. Comparison of frequency doubling perimetry with Humphrey visual field analysis in a glaucoma practice. American Journal of Ophthalmology 129(3):328–333.
Carl Zeiss Meditec. 2003. Humphrey Field Analyzer II - i Series User’s Guide. https://acmerevival.com/wp-content/uploads/2021/05/Zeiss-Humphrey-HFA-II-720i-Visual-FieldAnalyzerUserManual.pdf (accessed February 3, 2025).
Casson, R. J., and B. James. 2006. Effect of cataract on frequency doubling perimetry in the screening mode. Journal of Glaucoma 15(1):23–25.
Cello, K. E., J. M. Nelson-Quigg, and C. A. Johnson. 2000. Frequency doubling technology perimetry for detection of glaucomatous visual field loss. American Journal of Ophthalmology 129(3):314–322.
Chia, Z. K., A. W. Kong, M. L. Turner, M. Saifee, B. E. Damato, B. T. Backus, J. J. Blaha, J. S. Schuman, M. S. Deiner, and Y. Ou. 2024. Assessment of remote training, at-home testing, and test-retest variability of a novel test for clustered virtual reality perimetry. Ophthalmology Glaucoma 7(2):139–147.
Christoforidis, J. B. 2011. Volume of visual field assessed with kinetic perimetry and its application to static perimetry. Clinical Ophthalmology 5:535–541.
Clement, C. I., I. Goldberg, P. R. Healey, and S. Graham. 2009. Humphrey matrix frequency doubling perimetry for detection of visual-field defects in open-angle glaucoma. The British Journal of Ophthalmology 93(5):582–588.
Davis, C. E., C. K. Doyle, G. J. Zamba, C. A. Johnson, and M. Wall. 2011. The effect of stimulus size on repeatability in glaucoma using Goldmann sizes III, V, VI and STP. Investigative Ophthalmology & Visual Science 52(14):5508–5508.
Doozandeh, A., F. Irandoost, A. Mirzajani, S. Yazdani, M. Pakravan, and H. Esfandiari. 2017. Comparison of matrix frequency-doubling technology (FDT) perimetry with the Swedish interactive thresholding algorithm (SIYA) standard automated perimetry (SAP) in mild glaucoma. Medical Hypothesis, Discovery and Innovation in Ophthalmology 6(3):98.
Ferreras, A., V. Polo, J. M. Larrosa, L. E. Pablo, A. B. Pajarin, V. Pueyo, and F. M. Honrubia. 2007. Can frequency-doubling technology and short-wavelength automated perimetries detect visual field defects before standard automated perimetry in patients with preperimetric glaucoma? Journal of Glaucoma 16(4):372–383.
Flanagan, J. G., P. H. Artes, M. Wall, E. Young, T. Callan, V. M. Patella, M. Monhart, and G. C. Lee. 2016. The influence of perimetric stimulus size on defect detectability in early glaucoma. Investigative Ophthalmology & Visual Science 57(12).
Gardiner, S., D. Goren, C. Goldman, W. Swanson, and S. Demirel. 2013. The effect of stimulus size on the relation between sensitivity and variability in perimetry. Investigative Ophthalmology & Visual Science 54(15):2636–2636.
Gardiner, S. K., S. Demirel, D. Goren, S. L. Mansberger, and W. H. Swanson. 2015. The effect of stimulus size on the reliable stimulus range of perimetry. Translational Vision Science & Technology 4(2):10.
Grau, E., S. Andrae, F. Horn, B. Hohberger, M. Ring, and G. Michelson. 2023. Teleglaucoma using a new smartphone-based tool for visual field assessment. Journal of Glaucoma 32(3):186–194.
Greenfield, J. A., M. Deiner, A. Nguyen, G. Wollstein, B. Damato, B. T. Backus, M. Wu, J. S. Schuman, and Y. Ou. 2022. Virtual reality oculokinetic perimetry test reproducibility and relationship to conventional perimetry and OCT. Ophthalmology Science 2(1):100105.
Grobbel, J., J. Dietzsch, C. A. Johnson, R. Vonthein, K. Stingl, R. G. Weleber, and U. Schiefer. 2016. Normal values for the full visual field, corrected for age and reaction time, using semiautomated kinetic testing on the Octopus 900 perimeter. Translational Vision Science Technology 5(2):5.
Groth, S. L., E. F. Linton, E. N. Brown, F. Makadia, and S. P. Donahue. 2023. Evaluation of virtual reality perimetry and standard automated perimetry in normal children. Translational Vision Science Technology 12(1):6.
Hashimoto, S., C. Matsumoto, M. Eura, S. Okuyama, and Y. Shimomura. 2017. Evaluation of kinetic programs in various automated perimeters. Japanese Journal of Ophthalmology 61:299–306.
Haymes, S. A., D. M. Hutchison, T. A. McCormick, D. K. Varma, M. T. Nicolela., R. P. LeBlanc, and B. C. Chauhan. 2005. Glaucomatous visual field progression with frequency-doubling technology and standard automated perimetry in a longitudinal prospective study. Investigative Ophthalmology & Visual Science, 46(2):547–554.
Hepworth, L., and F. Rowe. 2019. Short-listing the program choice for perimetry in neurological conditions (PoPiN) using consensus methods. The British and Irish Orthoptic Journal 15(1):125.
Huang, C. Q., J. Carolan, D. Redline, P. Taravati, K. R. Woodward, C. A. Johnson, M. Wall, and J. L. Keltner. 2008. Humphrey matrix perimetry in optic nerve and chiasmal disorders: Comparison with Humphrey SITA standard 24-2. Investigative Ophthalmology & Visual Science 49(3):917–923.
Keltner, J. L., C. A. Johnson, J. O. Spurr, and R. W. Beck. 1999. Comparison of central and peripheral visual field properties in the optic neuritis treatment trial. American Journal of Ophthalmology 128(5):543–553.
Kumar, A., N. Hekmatjah, Y. Yu, Y. Han, G.-S. Ying, and J. T. Oatts. 2024. Factors associated with visual field testing reliability in children with glaucoma or suspected glaucoma. American Journal of Ophthalmology 264:187–193.
Lim, H. W., S. Pershing, D. M. Moshfeghi, H. Heo, M. E. Haque, and S. R. Lambert. 2023. Causes of childhood blindness in the United States using the IRIS® registry (Intelligent Research in Sight). Ophthalmology 130(9):907–913.
Ma, X., L. Tang, X. Chen, and L. Zeng. 2021. Periphery kinetic perimetry: Clinically feasible to complement central static perimetry. BMC Ophthalmology 21(1):343.
Mees, L., S. Upadhyaya, P. Kumar, S. Kotawala, S. Haran, S. Rajasekar, D. S. Friedman, and R. Venkatesh. 2020. Validation of a head-mounted virtual reality visual field screening device. Journal of Glaucoma 29(2):86–91.
Mesfin, Y., A. Kong, B. T. Backus, M. Deiner, Y. Ou, and J. T. Oatts. 2024. Pilot study comparing a new virtual reality-based visual field test to standard perimetry in children. J AAPOS 28(3):103933.
Mönter, V. M., D. P. Crabb, and P. H. Artes. 2017. Reclaiming the periphery: Automated kinetic perimetry for measuring peripheral visual fields in patients with glaucoma. Investigative Ophthalmology & Visual Science 58(2):868–875.
Morgan, A. M., L. S. Mazzoli, C. Caixeta-Umbelino, and N. Kasahara. 2019. Expediency of the automated perimetry using the Goldmann V stimulus size in visually impaired patients with glaucoma. Ophthalmology and Therapy 8(2):305–311.
Narang, P., A. Agarwal, M. Srinivasan, and A. Agarwal. 2021. Advanced vision analyzer-virtual reality perimeter: Device validation, functional correlation and comparison with Humphrey field analyzer. Ophthalmology Science 1(2):100035.
Nevalainen, J., J. Paetzold, E. Krapp, R. Vonthein, C. Johnson, and U. Schiefer. 2008. The use of semi-automated kinetic perimetry (SKP) to monitor advanced glaucomatous visual field loss. Graefe’s Archive for Clinical and Experimental Ophthalmology 246:1331–1339.
Nowomiejska, K., R. Vonthein, J. Paetzold, Z. Zagorski, R. Kardon, and U. Schiefer. 2005. Comparison between semiautomated kinetic perimetry and conventional Goldmann manual kinetic perimetry in advanced visual field loss. Ophthalmology 112(8):1343–1354.
Nowomiejska, K., R. Rejdak, Z. Zagorski, and T. Zarnowski. 2009. Comparison of static automated perimetry and semi-automated kinetic perimetry in patients with bilateral visible optic nerve head drusen. Acta Ophthalmologica 87(7):801–805.
Nowomiejska, K., R. Vonthein, J. Paetzold, Z. Zagorski, R. Kardon, and U. Schiefer. 2010. Reaction time during semi-automated kinetic perimetry (SKP) in patients with advanced visual field loss. Acta Ophthalmologica 88(1):65–69.
Nowomiejska, K., D. Wrobel-Dudzinska, K. Ksiazek, P. Ksiazek, K. Rejdak, R. Maciejewski, A. G. Juenemann, and R. Rejdak. 2015. Semi-automated kinetic perimetry provides additional information to static automated perimetry in the assessment of the remaining visual field in end-stage glaucoma. Ophthalmic and Physiological Optics 35(2):147–154.
Oatts, J. T., M. Indaram, and A. G. de Alba Campomanes. 2023. Where have all the pediatric ophthalmologists gone? Pediatric eye care scarcity and the challenge of creating equitable health care access. JAMA Ophthalmology 141(3):249–250.
Patel, D. E., P. M. Cumberland, B. C. Walters, I. Russell-Eggitt, M. Cortina-Borja, J. S. Rahi, and OPTIC Study Group. 2015. Study of optimal perimetric testing in children (OPTIC): Feasibility, reliability and repeatability of perimetry in children. Ophthalmology 122(8): 1711–1717.
Patel, D. E., P. M. Cumberland, B. C. Walters, I. Russell-Eggitt, J. Brookes, M. Papadopoulos, P. T. Khaw, A. C. Viswanathan, D. Garway-Heath, M. Cortina-Borja, J. S. Rahi, and Optimal Perimetric Testing in Children study group. 2018. Comparison of quality and output of different optimal perimetric testing approaches in children with glaucoma. JAMA Ophthalmology 136(2):155–161.
Patel, D. E., P. M. Cumberland, B. C. Walters, M. Cortina-Borja, and J. S. Rahi. 2019. Study of optimal perimetric testing in children (OPTIC): Evaluation of kinetic approaches in childhood neuro-ophthalmic disease. British Journal of Ophthalmology 103(8):1085–1091.
Phu, J., N. Al-Saleem, M. Kalloniatis, and S. K. Khuu. 2016. Physiologic statokinetic dissociation is eliminated by equating static and kinetic perimetry testing procedures. Journal of Vision 16(14):5.
Phu, J., S. K. Khuu, B. Zangerl, and M. Kalloniatis. 2017. A comparison of Goldmann III, V and spatially equated test stimuli in visual field testing: The importance of complete and partial spatial summation. Ophthalmic and Physiology Optics 37(2):160–176.
Phu, J., M. Kalloniatis, H. Wang, and S. K. Khuu. 2018. Differences in static and kinetic perimetry results are eliminated in retinal disease when psychophysical procedures are equated. Translational Vision Science & Technology 7(5):22.
Phu, J., S. K. Khuu, L. Nivison-Smith, and M. Kalloniatis. 2025. Standard automated perimetry for glaucoma and diseases of the retina and visual pathways: Current and future perspectives. Progress in Retinal and Eye Research 104:101307.
Pierre-Filho Pde, T., R. B. Schimiti, J. P. de Vasconcellos, and V. P. Costa. 2006. Sensitivity and specificity of frequency-doubling technology, tendency-oriented perimetry, SITA standard and SITA fast perimetry in perimetrically inexperienced individuals. Acta Ophthalmology Scandinavica 84(3):345–350.
Racette, L., M. Fischer, H. Bebie, G. Hollo, C. A. Johnson, and C. Matsumoto. 2019. Visual field digest: A guide to perimetry and the Octopus perimeter, 8th ed. https://haag-streit.com/2%20Products/Speciality%20diagnostics/Perimetry/Category%20assets/Books/HS_perimetry_br_xxx_visual_field_digest_8th_en.pdf (accessed February 3, 2025).
Razeghinejad, R., A. Gonzalez-Garcia, J. S. Myers, and L. J. Katz. 2021. Preliminary report on a novel virtual reality perimeter compared with standard automated perimetry. Journal of Glaucoma 30(1):17–23.
Rowe, F. J., and A. Rowlands. 2014. Comparison of diagnostic accuracy between Octopus 900 and Goldmann kinetic visual fields. BioMed Research International 2014 (1):214829.
Rowe, F. J., C. Noonan, and M. Manuel. 2013. Comparison of Octopus semi-automated kinetic perimetry and Humphrey peripheral static perimetry in neuro-ophthalmic cases. International Scholarly Research Notices 2013(1):753202.
Rowe, F. J., C. P. Cheyne, M. García-Fiñana, C. P. Noonan, C. Howard, J. Smith, and J. Adeoye. 2015. Detection of visual field loss in pituitary disease: Peripheral kinetic versus central static. Neuro-Ophthalmology 39(3):116–124.
Rowe, F. J., G. Czanner, T. Somerville, I. Sood, and D. Sood. 2021. Octopus 900 automated kinetic perimetry versus standard automated static perimetry in glaucoma practice. Current Eye Research 46(1):83–95.
Salt, A., and J. Sargent. 2014. Common visual problems in children with disability. Archives of Disease in Childhood 99(12):1163–1168.
Shaarawy, T. M., M. Sherwood, R. Hitchings, and J. Crowston. 2015. Glaucoma: Medical Diagnosis and Therapy, vol. 1, 2nd ed. London: Elsevier Limited.
Simpson, M. J. 2017. Mini-review: Far peripheral vision. Vision Research 140:96–105.
Sood, D., G. Czanner, T. Somerville, I. Sood, and F. J. Rowe. 2021. Standard automated perimetry using size III and size V stimuli in advanced stage glaucoma: An observational cross-sectional comparative study. BMJ Open 11(9):e046124.
Spry, P. G., C. A. Johnson, A. M. McKendrick, and A. Turpin. 2001. Variability components of standard automated perimetry and frequency-doubling technology perimetry. Investigative Ophthalmology & Visual Science 42(6):1404–1410.
SSA (U.S. Social Security Administration). n.d. Disability Evaluation Under Social Security—2.00 Special Senses and Speech—Adult. https://www.ssa.gov/disability/professionals/bluebook/2.00-SpecialSensesandSpeech-Adult.htm (accessed February 3, 2025).
Stapelfeldt, J., Ş. S. Kucur, N. Huber, R. Höhn, and R. Sznitman. 2021. Virtual reality–based and conventional visual field examination comparison in healthy and glaucoma patients. Translational Vision Science & Technology 10(12):10.
Tatham, A. J., F. A. Medeiros, L. M. Zangwill, and R. N. Weinreb. 2015. Strategies to improve early diagnosis in glaucoma. Progress in Brain Research 221:103–133. https://doi.org/10.1016/bs.pbr.2015.03.001
Topcon Healthcare. 2025. Tempo Perimeter. https://cdn.brandfolder.io/I6S47VV/at/xv4jqq9tgvcnkrkb2fpt9n/TEMPO_Brochure.pdf (accessed February 3, 2025).
Wall, M., R. K. Neahring, and K. R. Woodward. 2002. Sensitivity and specificity of frequency doubling perimetry in neuro-ophthalmic disorders: A comparison with conventional automated perimetry. Investigative Ophthalmology & Visual Science 43(4): 1277–1283.
Wall, M., C. F. Brito, K. R. Woodward, C. K. Doyle, R. H. Kardon, and C. A. Johnson. 2008. Total deviation probability plots for stimulus size V perimetry: A comparison with size III stimuli. Archives of Ophthalmology 126(4):473–479.
Wall, M., C. K. Doyle, K. Zamba, P. Artes, and C. A. Johnson. 2013. The repeatability of mean defect with size III and size V standard automated perimetry. Investigative Ophthalmology & Visual Science 54(2):1345–1351.
Wall, M., A. Subramani, L. X. Chong, R. Galindo, A. Turpin, R. H. Kardon, M. J. Thurtell, J. A. Bailey, and I. Marin-Franch. 2019. Threshold static automated perimetry of the full visual field in idiopathic intracranial hypertension. Investigative Ophthalmology & Visual Science 60(6):1898–1905.
Walsh, H. L., A. Parrish, L. Hucko, J. Sridhar, and K. M. Cavuoto. 2023. Access to pediatric ophthalmological care by geographic distribution and US population demographic characteristics in 2022. JAMA Ophthalmology 141(3):242–249.
Wang, B., S. Alvarez-Falcón, M. El-Dairi, and S. F. Freedman. 2023. Performance of virtual reality game-based automated perimetry in patients with childhood glaucoma. Journal of American Association for Pediatric Ophthalmology and Strabismus 27(6):325.e1–325.e6.
Wilscher, S., B. Wabbels, and B. Lorenz. 2010. Feasibility and outcome of automated kinetic perimetry in children. Graefe’s Archive for Clinical and Experimental Ophthalmology 248:1493–1500.
Wroblewski, D., B. A. Francis, A. Sadun, G. Vakili, and V. Chopra. 2014. Testing of visual field with virtual reality goggles in manual and visual grasp modes. BioMed Research International 2014:206082.
Yohannan, J., J. Wang, J. Brown, B. C. Chauhan, M. V. Boland, D. S. Friedman, and P. Y. Ramulu. 2017. Evidence-based criteria for assessment of visual field reliability. Ophthalmology 124(11):1612–1620.
Yoon, M. K., T. N. Hwang, S. Day, J. Hong, T. Porco, and T. J. McCulley. 2012. Comparison of Humphrey matrix frequency doubling technology to standard automated perimetry in neuro-ophthalmic disease. Middle East African Journal of Ophthalmology 19(2):211–215.


