Liquid Transportation Fuels from Coal and Biomass: Technological Status, Costs, and Environmental Impacts (2009)
Chapter: Appendix I: Modeling of Capital and Operating Costs and Carbon Emissions of Ethanol Plants with SuperPro Designer®
I
Modeling of Capital and Operating Costs and Carbon Emissions of Ethanol Plants with SuperPro Designer®
The Panel on Alternative Liquid Transportation Fuels developed a model to simulate the capital and operating costs and the carbon emissions of ethanol plants. The model simulations were used to compare process economics and environmental effects in different scenarios of technological developments and improved efficiencies, with different feedstocks, and in ethanol plants of various sizes. SuperPro Designer®, chemical-process simulation software, was used by the panel to run the model simulations because it contains a set of unit procedures that can be customized to the specific modeling needs of the corn grain-to-ethanol and cellulosic biomass-to-ethanol processes. It was also used in another study (Kwiatkowski et al., 2005). The software includes a well-developed economic-evaluation package with such parameters as financing, depreciation, running royalty expenses, inflation rate, and taxes. This appendix will first discuss the composition of different biomass feedstocks, then the ethanol-plant simulation models that the panel used, and finally an example of an economic analysis generated by SuperPro Designer.
BIOMASS COMPOSITION
Feedstock Description: Poplar and High-Sugar/Glucan Biomass
Poplar woodchips were used as biomass feedstock for all initial analyses. Composition was obtained from M. Ladisch and colleagues (Purdue University) and is summarized in Table I.1. “Wet” woodchips, which are unprocessed as provided by the forestry-products industry as by-products, were used in the analyses. They
TABLE I.1 Composition of Poplar Woodchips and High-Sugar/Glucan Biomass (percentage)
|
|
Poplar Woodchips |
HGBM |
|
Acetic acid |
1.95 |
1.08 |
|
Ash |
0.60 |
0.33 |
|
Cellullose |
23.70 |
25.00 |
|
Extractives |
1.95 |
1.08 |
|
Lignin |
15.75 |
10.00 |
|
Water |
18.00 |
50.00 |
|
Xylan |
8.06 |
12.50 |
contain about 48 percent water, and the concentrations of sugars and lignin are 61 and 30 percent wt/wt, respectively, on a dry-weight basis. Because a high lignin content is not typical of all cellulosic biomass, the panel generated a “high-sugar/glucan biomass” (HGBM) feedstock to analyze the effects of a different biomass composition. HGBM has sugar and lignin concentrations of 75 and 20 percent, respectively. All other components were kept at the same relative percentages as in the poplar woodchips; water content was set at 50 percent (instead of the 48 percent in poplar) for simplicity.
Cellulosic-Biomass Feedstock Alternatives
The composition of the feedstock used in the analyses could affect capital and operating costs. For example, a biorefinery that uses poplar woodchips as a feedstock has to include a burner and a steam electrical generator to burn the lignin residue for electricity generation; in contrast, wheat straw does not have enough lignin to provide any energy for the biorefinery. Therefore, the panel also assessed the process economics and environmental effects of biorefineries using different feedstocks. The different biomass compositions are shown in Table I.2. All compositions, apart from the case of poplar, are on a dry-weight basis. References obtained for these biomass compositions were inconsistent and had large ranges. The ranges of values overlap for some individual components, such as glucan or lignin. The most consistent and credible values were selected for the analysis, and they were mostly averages of the maximum and minimum for the spreads. The problem of mass closure was resolved by including a trace amount of water to reach 100 percent, and the price basis for the biomass was adjusted to reflect that. For example, if the initial price was $70/ton—(2)($35/ton of poplar woodchips on
TABLE I.2 Composition of Different Feedstocks (percentage)
|
|
Poplar Woodchips |
Wheat Straw Dry |
Dry Switchgrass |
Dry Corn Stover |
Miscanthus |
|
Acetic acid |
1.9 |
0.0 |
0.3 |
0.0 |
0.0 |
|
Ash |
0.6 |
6.4 |
6.0 |
7.0 |
2.0 |
|
Cellulose |
23.7 |
39.3 |
32.2 |
35.0 |
38.2 |
|
Extractives |
1.9 |
4.2 |
13.6 |
5.0 |
6.9 |
|
Lignin |
15.7 |
14.5 |
17.3 |
18.5 |
25.0 |
|
Water |
48.0 |
5.0 |
0.0 |
2.5 |
3.6 |
|
Xylan |
8.1 |
30.6 |
27.9 |
28.0 |
24.3 |
|
Glucose |
— |
0.0% |
2.7% |
4.0% |
|
a wet-weight basis)—a 2 percent water content would reduce the price to ($70/ton)(0.98) = $68.60/ton. Another alternative would have been to augment every percentage composition proportionally so that the sum reached 100 percent. The two approaches have the same effect, but the former is more efficient.
ETHANOL-BIOREFINERY SIMULATION MODELS
Model for Corn-Grain-to-Ethanol Plants
The corn-grain-to-ethanol process is well developed and understood and is used by 130–150 ethanol plants in the United States alone; hence, it is a good starting point to evaluate the modeling method with SuperPro Designer. Because a previous study analyzed the corn-to-ethanol process with SuperPro Designer (Kwiatkowski et al., 2005), it was thought best to remodel the process with the panel’s simplification constraints (discussed in Chapter 3) and any price changes in costing and to compare the results with those of the prior study. The panel’s initial model would not only validate the approach but also verify that it calculated all the mass balances correctly and performed consistent energy-balance calculations for the process.
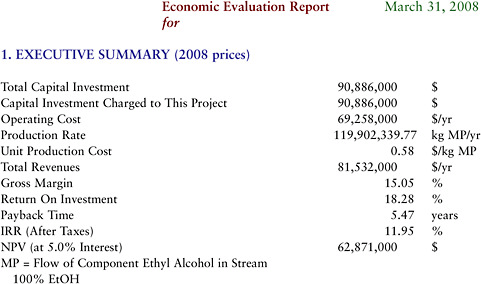
Figure I.1 shows a simple schematic of the corn-grain-to-ethanol manufacturing process, and Figure I.2 shows the corresponding schematic in SuperPro Designer. For adequate separation of concerns, the process was divided into three sections: preprocessing, production (fermentation), and recovery, including

FIGURE I.1 Schematic of processing steps for converting corn to ethanol.
Source: Schwietzke et al., 2008. Reprinted with permission from IEA Bioenergy.
recovery of ethanol as the major product, distillers dry grain solids (DGGS) as a by-product, and water (hot condensate and backset1). The economic evaluation report generated by SuperPro Designer is shown at the bottom of Figure I.2.
Cellulosic-Plant Model
Process Overview
There are a lot of similarities between the cellulosic-ethanol and dry-grind corn-ethanol manufacturing processes, and they share at least five main basic unit operations (Figure I.3): size reduction, saccharification, fermentation, distillation, and solids separation (centrifugation). In some plant configurations, saccharification is attempted simultaneously with fermentation, but such a design is independent of whether corn or cellulosic biomass is used as feedstock, so it is not treated as a difference between the two processes. Both systems also need some form of solids feedstock handling and storage. A variety of alternatives can be used for feedstock handling; the simplest, and the one modeled in this analysis, is a single storage bin.
One important difference between the two ethanol-manufacturing alternatives lies in the initial pretreatment of the feedstock after size reduction (grinding or chopping) for the mash to be saccharified and fermented in the later steps. Different pretreatments are used because of the difference in resilience with respect
to “liquefaction” or “softening” of the feedstock. In the case of the cellulosic-biomass process, there are a options to pretreat the lignocellulosic material to make the glucan and xylan or arabinan fibers available for enzyme degradation into monomers in the saccharification step.
A second difference has to do with the by-products of the process. More work and energy are used in the dry-grind corn-based case to produce DGGS of adequate quality, requiring both an evaporator and a drying step. In the case of the cellulosic alternative, only a dryer is needed to retrieve the residual solids—rich in lignin—that are then burned in a boiler to meet the energy requirements of the biorefinery. Some designs, such as that in the study of Aden et al. (2002), avoid this drying step and therefore reduce the capital cost further. However, that type of plant would depend more heavily on external sources of energy for the plant’s heating and electricity needs.
A third difference is the inclusion of a lignin-based burner and boiler for the generation of steam and a steam turbine for the generation of electricity in a cellulosic-ethanol biorefinery. Those are included in the design to take advantage of the relatively high content of lignin in the feedstock and the ease with which the lignin in the residual solids can be combusted by simply providing air. The energy in the lignin is about 11.5 kbtu/lb (26.7 kJ/g).
In summary, the panel’s simulation model for a cellulosic biorefinery has 10 major unit operations. They are basic and well-characterized units and modeled as shown in the SuperPro Designer schematic for the plant (Figure I.3). Even if all the units vary in their complexity (for example, a typical distillation unit includes a beer column, a rectifier column, a molecular sieve, and a stripper column), for the sake of simplicity they can be treated as simple “black boxes” that are connected to each other by one or two streams. Each unit operation is treated as a single model unit with all its details encapsulated by the single-unit “box,” so that, for example, in the distillation operation, instead of six units having to be resized with all the required heat exchangers and other components, only one unit is given the value of the whole set and resized. Included are also the few heat exchangers outside the units that were difficult to model otherwise and that seem to be present in most of the currently explored configurations both in the literature and in discussions with industry. SuperPro Designer probably models some units—such as the centrifuge, the fermentor and reaction bins, and the drum dryer—after the actual physical units. The biggest simplifications are the burner, the steam turbine, and the propagation system; the first two are modeled as simple generic reaction or separation boxes. The third is modeled as a single seed fermentor. In reality, it is a

system of many seed-fermentor units and cleaning and sterilization systems. That level of detail is encapsulated in the current unit, which, in essence, is used only for overall cost-estimation purposes.
SuperPro Designer® Network Model Description
The process is modeled in SuperPro Designer® as a batch process of 19 unit operations (including heat exchangers and flow splitters and mixers) in which some units run in continuous mode (see Figure I.4). The longest process, and therefore the one that defines the length of each batch, is fermentation, which takes 72 h. The size of the fermentors was set at 800,000 gal for all scenarios, and there can be anywhere from 5 to 23 fermentor units. The fermentors can run in a staggered fashion so that the average time to fill them and to empty the ones that have completed their fermentation is 4 h for the entire set. Thus, the whole process takes 80 h (4 h + 72 h + 4 h).
With respect to the overall batch process, it might be optimistic to consider the possibility of only 4 h in the front and back ends of the staggered fermenta-

FIGURE I.3 Simple schematic of cellulosic-ethanol manufacturing process. Courtesy of M. Ladisch and colleagues (Purdue University).
tions in the case of 23 fermentors. However, there are only two cases in which many fermentors were used. For the sake of comparison of different batch efficiencies and sizes, the overall time was set at 80 h for all cases. Given the assumptions that the plant produces all year and that each batch takes 80 h, 109 batches could be processed per year. That number was used for all scenario analyses.
It is important to note that many unit operations in the process network have been considered to operate continuously rather than in a batched mode. The reason is that apart from the first batch, in which the completion of fermentation is the step that delays the beginning of other processes—such as distillation and drying—all the batches allow the processes to be aligned. The products of previous fermentations are fed into downstream processes in the network, so they never need to be stopped. The same is true of processes before fermentation, such as size reduction and shredding. After the first batch—for which shredding must take place before preprocessing—each batch can be shredded while the preceding batch is being processed. In this way, all units for continuous processes are sized according to their volumetric throughput per batch, assuming a run time of 80 h/batch. The processing units that have been set as continuous in the network are storage, the shredder, distillation, centrifugation, the drum dryer, the burner, the steam-turbine generator, and all mixers, splitters, and heat exchangers.
In contrast, reactor-vessel procedures, such as preprocessing and saccharification, could not be resized according to their shorter processing time with respect to fermentation. In theory, because the processing time for those steps is shorter

than that for fermentation, it would be possible to have smaller vessels that are used more times for each batch while products are stored until the appropriate volume for the next fermentation is reached. The panel decided, however, to avoid the use of smaller vessels and, in essence, to use the reactor vessels themselves as the storage vessels for two reasons. First, it is usually not advisable to leave the saccharification mash idle in storage for any extended period, because the mix could spoil and create difficulties for later fermentation. Second, it is unclear whether having additional storage bins for the different pretreated or saccharified mixtures would result in substantial cost savings.
As can be seen in Figure I.3 for the case of poplar woodchips as lignocellulosic feedstock, the woodchips are deposited into a solids bin that is just big enough to hold the biomass required for each batch. The feedstock is passed through a grinder-shredder that works full-time and then is mixed with water to reach an approximate solids loading of 30 percent. After being heated by a heat-exchange element with the output stream of this step, the mixture is fed into the pretreatment vessel with the hot thin stillage backset. Of the many possible options, the pretreatment chosen for this model is the hot-water method in which the mash—now with a 21 percent solids loading after mixing with the backset—is heated with steam to 200°C for 5 min.
After pretreatment, the mash is transferred into a new reaction vessel, where it is cooled down to 65°C and mixed with cellulases at 12.6 percent wt/wt glucan. The mix is stirred for 36 h to achieve about 80–90 percent sugar yields from the total cellulose and hemicellulose in the biomass. Once that stage is complete, the mix is transferred into the fermentor, where it is cooled to 32°C and mixed with yeast at a concentration of 0.125 percent wt/wt fermentable sugars. As mentioned before, 72 h is allowed for fermentation in which 80–90 percent of the available fermentable sugar is converted into ethanol. The resulting mixture, which contains about 4–8 percent ethanol, is then passed through the distillation system. The distillation system is modeled by a single column with the assumption that 99.99 percent of the ethanol can be recovered in the distillate. In this design, the fermented mixture distilland is heated as much as possible before entering the distillation system by heat exchange with both the bottoms stream and the residual liquid stream not used as backset and by the evaporated water stream from the drying step. This approach saves as much heat energy as possible for the model.
The bottoms stream, cooled after exchanging heat with the distillation input stream, is then passed through the centrifuge. For this step, the distribution of compounds between the water stream and the solids stream is set as a percent-
age distribution as indicated by Ladish and colleagues, Purdue University. Fifty percent of the liquid stream, called thin stillage, is recycled as backset to be mixed with the ground or shredded feedstock for the next batch. The other 50 percent is treated as the residual liquid stream and for the model’s purposes disposed of and not included in this analysis. In a real setting, that liquid stream would most likely be recovered via a water-purification system.
The residual solids coming out of the centrifuge are dried in a drum dryer to about 15 percent water content with 242°C high-pressure steam as the source of heat to allow better burning. Once dried, the solids are fed into a burner or boiler and completely burned in air to CO2 and water. It is assumed that all compounds other than the ash already in the solids residue are hydrocarbons and are fully reacted with oxygen to CO2 and water. Nonetheless, in the reaction enthalpy calculations, only lignin is assumed to release heat of reaction. The other compounds are not included but contribute slightly as a heat sink because they (or their products) have to be heated to the final exhaust temperature. For the sake of simplicity and because of some particularities of the program, the water to be heated to the final steam temperature used throughout the plant is mixed with the solids to be burned even though in reality these would be in separate chambers.
The generated steam is then passed through a steam turbine to generate electricity. This unit operation, however, could not be modeled adequately, because it was unclear whether and how it would be possible in the SuperPro Designer program to deduct the steam needs of the plant from the steam output of the boiler. If all generated steam were available for this unit, it would be generating at least twice the electricity that would be available to the real plant. This unit, nonetheless, was used for separating the real steam generated from the CO2 and water stream resulting from the residual solids burn and was also used to cost the steam turbine. That was achieved after further calculations to find the real available steam for electrical-power output—and therefore the size of the unit—were carried out separately in an Excel spreadsheet.
Plant Cost Calculations
A sample detailed cost analysis for the “base-case” cellulosic plant (poplar feedstock and medium case-performance assumptions) is shown in Box I.1 at the end of this appendix.
Equipment
With respect to the major equipment specifications and freight on board (FOB) costs, there is only one unit of every unit operation (or stage)—except perhaps for one or two heat-exchanger stages that were doubled under some circumstances—in which the maximum size specifications for a unit were below the throughput for a particular case. Notable exceptions are the vessels for pretreatment, saccharificaton, and fermentation, which have constraints on how large they can be made. Therefore, although costs of all other equipment increase with size to the power of 0.6–0.7, the equipment for those three stages correlates linearly with the number of units required. The maximum and therefore the chosen working size of each vessel was selected by virtue of consolidating the decisions of industry on sizing vessels, after talks with representatives in charge of these projects, with the maximum possible size of 1 million gallons reported in the Aden et al. (2002) study. The current estimate of the base cost of these vessels was also validated in those talks.
As mentioned before, the single distillation column is a proxy for a more detailed distillation unit that to a good approximation follows single-unit comparison with Schwietzke et al.’s model (2008). The actual distillation stage would include a beer column, a rectifier column, a molecular sieve, and a stripper column, but the value and the behavior of this set of components were appropriately emulated by the single column modeled in this analysis. The overall cost of this stage was also validated by talks with industry and by the costs of such units as the centrifuge and the dryer. Scaling exponent values were also fine-tuned after discussions with industry. The scaling exponent value varies: distillation grows approximately with a scaling exponent of 0.55, and the centrifuge with 0.8. The default value was taken as 0.7.
Although the burner or boiler and steam-turbine generator help to create a more efficient biorefinery from an energy point of view, it is not obvious whether this is the most economical choice relative to the use of natural gas or coal for the energy needs of the plant. They have been included here to minimize reliance on fossil fuels. The sum of the costs of the boiler and turbine was validated independently and, on the basis of usual estimates, is 40–50 percent of total equipment costs. It varied from case to case, however, because the turbine cost for different cases was re-estimated according to the amount of available steam for electricity generation.
It should be noted that the FOB cost of equipment is about 25 percent of the total plant cost. In addition to the costs of the basic units, adding such items as piping, instrumentation, insulation, electrical facilities, buildings, and “yard improvement” (here taken as the initial landscaping needed for the construction of the facility) increases the cost. All those values are taken as percentages of the cost of the units and have been validated with industry. In addition, the percentage cost of engineering and construction and the contractor’s fee and contingency have to be included. The sum is the total “direct fixed capital cost” (DFC). Finally, there are the startup costs and the initial working capital, which are expressed as percentages of the DFC (in Section 10A of the SuperPro Designer Economic Analysis Report Sample). Royalty fees, fixed at about $4 million and not based directly on the DFC, still need to be added to the DFC to provide the figure for total capital investment.
REFERENCES
Aden, A., M. Ruth, K. Ibsen, J. Jechura, K. Neeves, J. Sheehan, B. Wallace, L. Montague, A. Slayton, and J. Lukas. 2002. Lignocellulosic Biomass to Ethanol Process Design and Economics Utilizing Co-Current Dilute Acid Prehydrolysis and Enzymatic Hydrolysis for Corn Stover. Golden, Colo.: National Renewable Energy Laboratory.
Kwiatkowski, J., A.J. McAllon, F. Taylor, and D.B. Johnston. 2005. Modeling the process and costs of fuel ethanol production by the corn dry-grind process. Industrial Crops and Products 23:288-296.
Schwietzke, S., M.R. Ladisch, L. Russo, K. Kwant, T. Makinen, B. Kavalov, K. Maniatis, R. Zwart, G. Shahanan, K. Sipila, P. Grabowski, B. Telenius, M. White, and A. Brown. 2008. Gaps in the research of 2nd generation transportation biofuels. IEA Bioenergy T41:2008:2001.
|
|
|
|||||||||||||||||||||||||||||||||||||||||||||||||||||||||||||||||||||||||||||||||||||||||||||||
|
 |
|