Communicating a Balanced Look at Local Airport Activity and Climate Change (2025)
Chapter: 2 Climate Change and Airports
CHAPTER 2
Climate Change and Airports
Background on Climate Change
Climate change is one of the most pressing issues of our time. Human activities have already caused approximately 1°C of global warming, and at current rates, will likely cause 1.5°C of temperature increase above pre-industrial levels between 2030 and 2050 (1). Even 1.5°C of temperature rise exposes infrastructure and humans to substantial risk. With the Paris Agreement, governments have committed to limiting the temperature increase to well below 2°C above pre-industrial levels and to pursuing efforts to limit it to 1.5°C (2).
Currently, the world is set to experience temperature increases far more than 1.5°C. According to the United Nations Environment Programme, without further action, there will be a 2.5°C to 2.9°C temperature rise above pre-industrial levels this century (3).
Keeping global warming below target levels will require global greenhouse gas (GHG) emissions to decline quickly. According to the Fifth National Climate Assessment, this means setting an economy-wide target of reducing all its net-GHG emissions by 50% to 52% below 2005 levels in 2030, roughly −6% per year beginning in 2022, putting the country on a path to achieve the goal of reaching net-zero GHG emissions by no later than 2050 (4).
Between 1990 and 2016, global emissions per unit of real gross domestic product (GDP) decreased only by 1.8% per year.
Aviation and Climate Change
The overall emissions attributable to the aviation industry include all of the emissions produced at airports from aircraft on the ground and en route plus the emissions from industries providing inputs to the aviation industry and people accessing the airport. However, the main focus of concern is the combustion of jet fuel in aircraft engines, especially combustion at cruising altitude, which has a more deleterious effect on the environment.
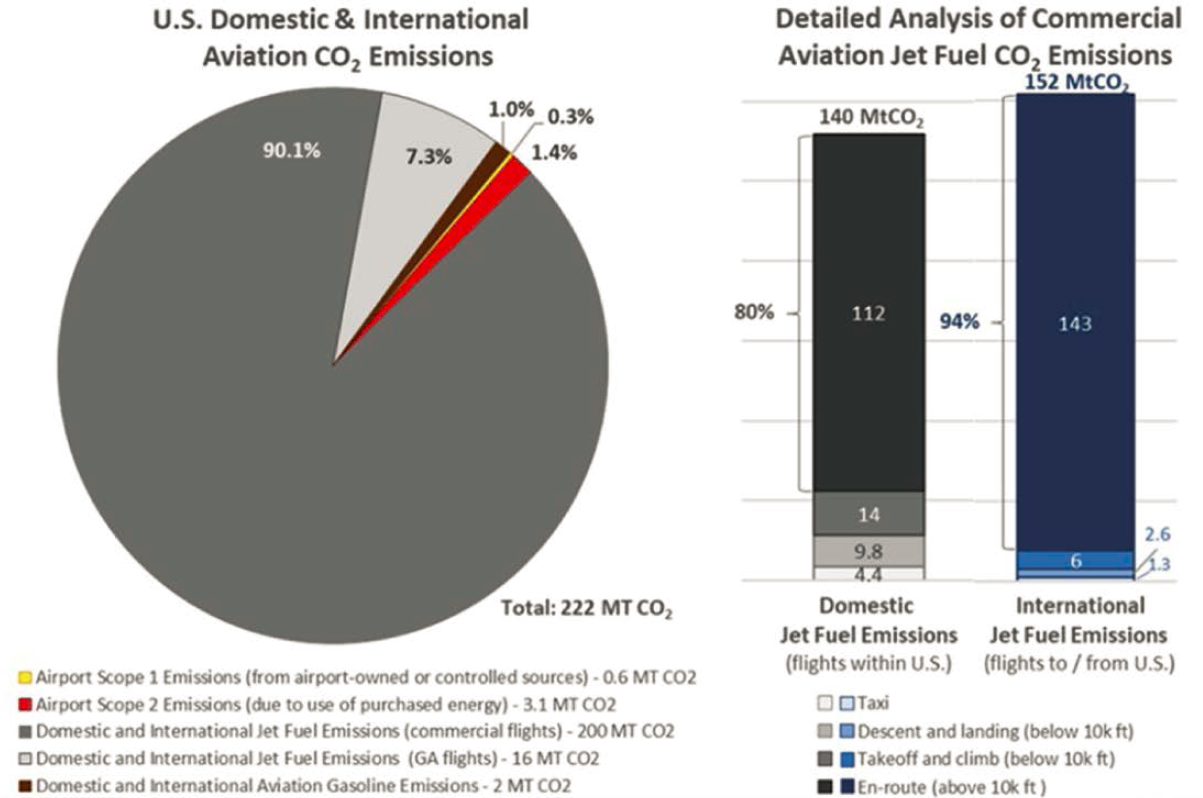
As discussed in Figure 2-1, based on the way the United Nations and others account for emissions, aircraft operators, including airlines, are responsible for most emissions from jet engine combustion; airports are not, but this does not prevent the public from making airports the focus of their concern about climate change.
Figure 2-2 shows that in 2019, airports accounted for only about 2% of aviation emissions (labeled in the figure as Airport Scope 1 and Airport Scope 2 Emissions), while over 97% were attributable to jet fuel combustion.
Aviation’s Share of Global Emissions
According to the International Energy Agency, aviation’s share of global CO2 emissions is between 2% and 3% (5, 6). However, the impact on global warming due to aviation may be greater because emissions of nitrogen oxides at altitude can cause complex chemical reactions in the atmosphere and cirrus cloud formation (7).

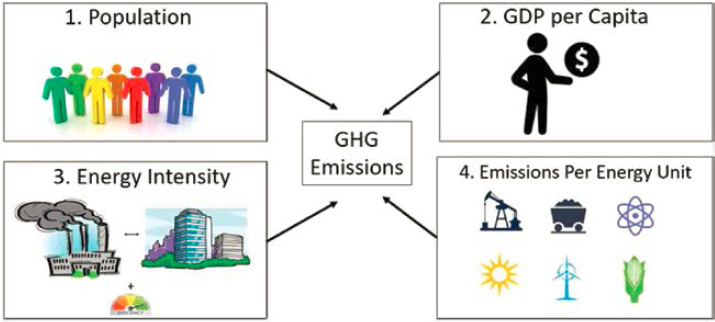
The emissions from jet fuel combustion in the United States in 2019 [including foreign airlines and general aviation (GA)] can be roughly estimated as the product of four factors: population, GDP per capita, gallons of jet fuel consumed per dollar of GDP, and the emissions of CO2 per gallon of jet fuel (Table 2-1).
Table 2-1 shows that there were 328 million people in the United States in 2019 who, on average, used 0.0012 gallons of jet fuel to produce each dollar of GDP, which averaged $65,183 per person; each gallon of jet fuel produced 8.06 kilograms of carbon dioxide (CO2) when burned in an engine. When the four values are multiplied together and divided by 1,000 (to convert kilograms to metric tons), it is estimated that almost 207 million metric tons of CO2 were emitted by jet airplanes in the United States in 2019.
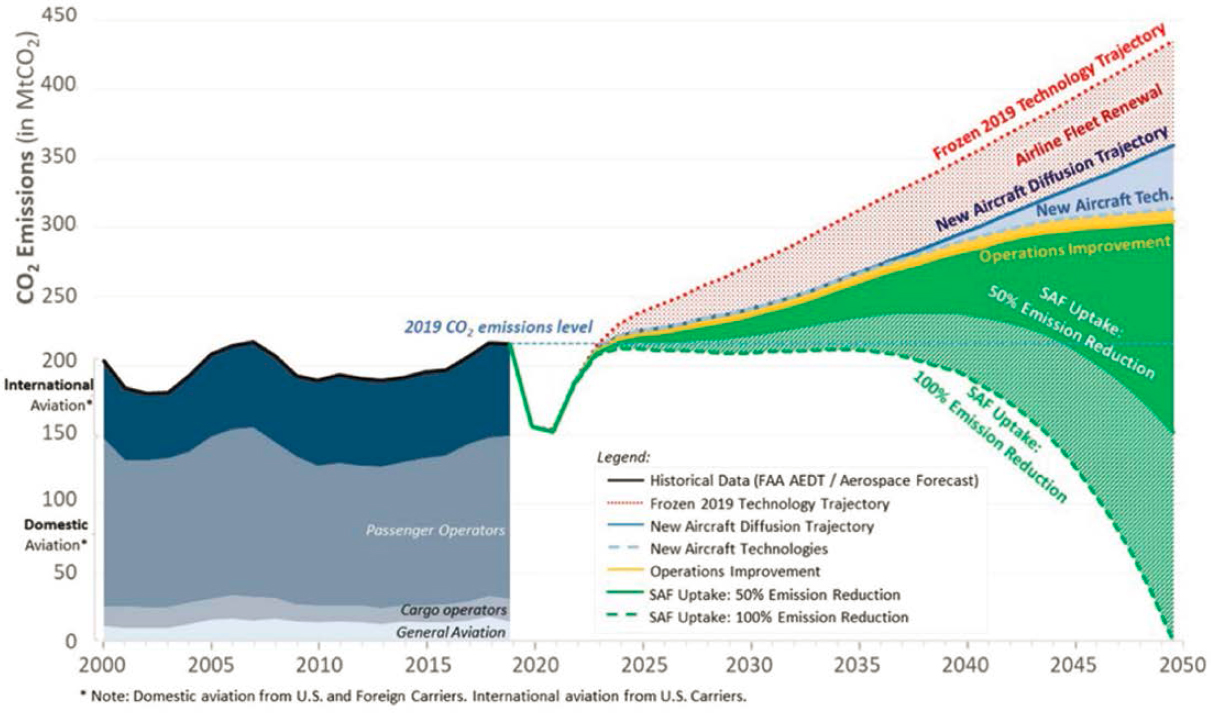
One of the biggest concerns about aviation activity is that it tends to increase with population and economic growth. If the amount of jet fuel consumed to produce a dollar of GDP remains the same and if the amount of GHG (expressed in CO2 equivalent) per gallon of fuel remains the same, then emissions will also grow in proportion to the population and economic growth. Figure 2-3
from the United States 2021 Aviation Climate Action Plan shows that emissions would more than double by 2050 if there were no improvements in efficiency in combustion (fewer emissions) or the amount of jet fuel used (8).
Environmental groups also point out that aviation emissions are not distributed equally among the population and that instead, a relatively small group of frequent fliers take the vast majority of flights. In the United States, it is estimated that 12% of the population is responsible for 66% of all air travel (9).
The same type of multiplication can be used to simulate the future of aviation emissions with and without improved efficiency and technology. In Figure 2-4, the second scenario shows emissions from jet fuel growing by 5% if the population were to increase by 5%. This might happen by 2030, for example, if there were no changes in real GDP per capita, the rate of consumption of jet fuel, or technology.
Table 2-1. Total U.S. CO2 emissions are the product of four factors.
| Population (million) | GDP/Population | Jet Fuel Demand/GDP (gallons per $) | CO2 Emissions (kg/gallon) | Total CO2 Emissions (millions of metric tons) |
|---|---|---|---|---|
| 328 | $65,183 | 0.0012 | 8.06 | 207 |

Chapter 3 discusses specific actions that can be taken to cut emissions from aircraft and other activities in the aviation value chain. One of the ideas is to substitute so-called SAF for some jet fuel. SAF is derived from waste products, plants, alcohol, or by combining hydrogen and captured carbon and is a “drop-in” fuel, meaning it can be used in aircraft once it has met all of the technical standards required. If SAF is properly engineered, it can reduce emissions by as much as 90%. One target is for SAF to comprise 10% of the jet fuel mix by 2030. The third scenario
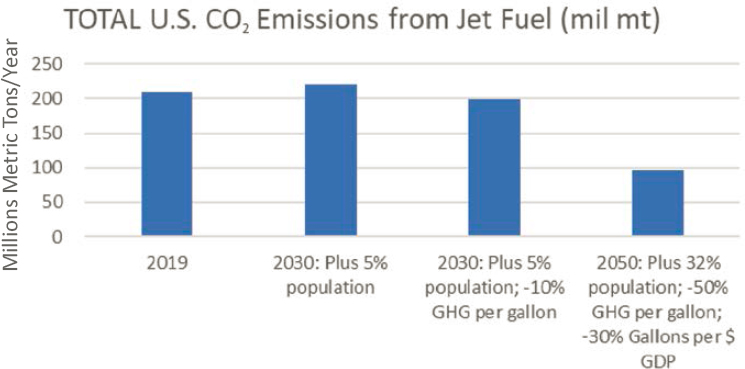
in Figure 2-4 shows that by 2030, with a 10% SAF mix that reduces emissions by 90% and 5% population growth, emissions would be just over 95% of 2019 levels, with all other factors held constant. (For more details, see the textbox box “The Science, Policy, and Implications of SAF Are Fast-Moving Topics” at the end of this chapter.)
In the last scenario illustrated in Figure 2-4, by 2050, the population of the United States may be 32% higher than in 2019. By then, it is hoped that SAF will make up at least 50% of the fuel mix and 30% less fuel will be needed to produce the same amount of transportation because some electric aircraft will be powered by batteries, and the remaining jet engines will have become more efficient. As a result, if SAF reduced emissions by 90%, then emissions due to jet fuel combustion in 2050 would be about 51% of the levels in 2019, despite more people traveling by air.
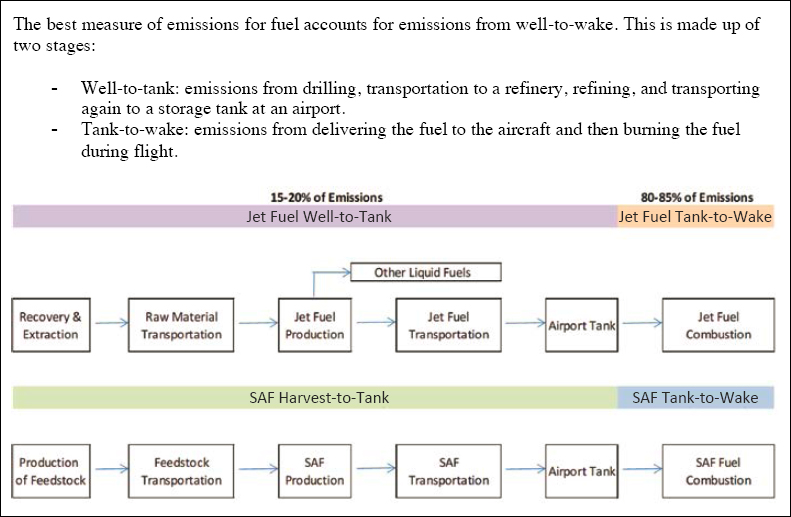
Most of the emissions due to aviation are attributed to jet fuel combustion. It is important to note that the figures quoted above are only due to the combustion of fuel once it reaches the airport and is placed in aircraft fuel tanks and then consumed. These are so-called tank-to-wake emissions and exclude the life cycle emissions associated with production and distribution of fuels, also referred to as “well-to-tank” emissions, which would add about 21% (see Figure 2-5) to the totals in the charts.
One could go through the same process of accounting for emissions when looking at other aspects of the aviation value chain in the following examples.
- How much combustion is embedded in the heating and air conditioning of airport buildings, including power purchased from utilities?
- How much combustion is involved in the use of on-airport vehicles and vehicles or modes of travel used to access the airport?
- How much emissions are produced in transporting and processing airport waste or on-site airport construction?
- How much additional emissions occur in the extraction, transportation, and refining of fossil fuel or SAF used in aviation (well-to-tank)?
(Attributing who is responsible for what emissions is addressed in the section on the role of airports later in this chapter.)
The process for estimating CO2 or other emissions is always the same. As discussed earlier and depicted in Figure 2-6, emissions depend on two demand drivers: population and economic activity/growth; emissions also depend on two potentially controllable items: the amount of energy needed to produce each service or activity (heating, transportation, etc.) and the emissions produced by the energy source applied.
Why Is Aviation So Expensive to Remediate?
Goldman Sachs has estimated that the current life cycle cost of abating aviation emissions is about $900 to $1,000 per U.S. ton of aviation CO2 (10). Again, virtually all of the tons of aviation CO2 are due to fuel burned during engine combustion. By 2030, the firm estimates that these costs may fall to $600 to $700 per ton. The estimates are based on substituting SAF for jet fuel and account for the well-to-wake (the full life cycle) of jet fuel and SAF substitutes. See Figure 2-5 for the steps in the life cycle of emissions.
Meanwhile, globally, the cost of aviation decarbonization is estimated to be $5 trillion (11).
Traditionally, airports only report aircraft tank-to-wake emissions for landing, takeoff, and ground operations; well-to-wake includes well-to-tank and the en route emissions portion of tank-to-wake. International Civil Aviation Organization (ICAO) certifies SAF benefits in a manner consistent with well-to-wake and gives credit to operators that burn SAF instead of jet fuel with the savings established on a well-to-wake basis.
As a point of reference, Goldman Sachs estimated that the cost to abate one ton of emissions from farming, power generation, or automobiles is less than $100 per ton of CO2 (10). From this perspective, aviation is very expensive to abate.
The main reason that aviation remediation costs are so high is that the primary substitute for jet fuel is SAF, and SAF currently costs 2 to 4 times more than jet fuel as demonstrated in Figure 2-7.
The math in Figure 2-7 is based on the following process.
- Each gallon of jet fuel produces 9.75 kg of CO2 from well-to-wake (the full life cycle of the fuel).
- There are 907 kg in a U.S. ton.
- So, burning 93 gallons of jet fuel produces 1 U.S. ton of emissions (907 kg in a ton/9.75 kg of emissions per gallon of jet fuel).
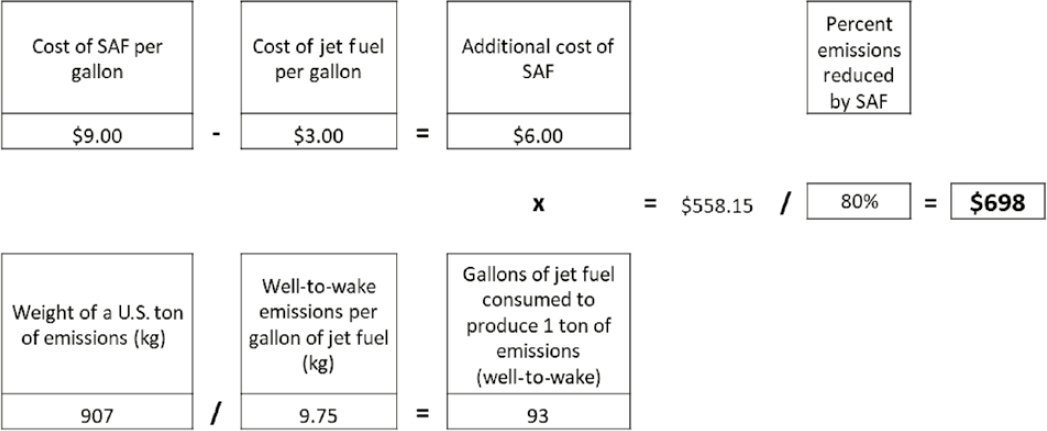
- Assume that SAF eliminates 80% of emissions, jet fuel costs $3 per gallon, and SAF costs three times more, or $9 per gallon.
- Then using SAF, the cost of abating 1 ton of CO2 emissions would be $698:
- 9 per gallon of SAF − $3 per gallon of jet fuel x 93 gallons of fuel / .80 reduction in emissions. This is within the range of the cost Goldman Sachs has estimated for 2030. (Note: The net reduction in CO2 emissions and how it is processed varies among SAF source material; in this example, 80% was used to illustrate one way to replicate the Goldman Sachs estimate.)
The remediation picture for aircraft engine combustion is not all bleak. Part of the solution is that aviation fuel consumption and emissions per passenger both fall as technologies improve. As shown in Figure 2-8, in the period from 1991 to 2019, enplanements (passengers boarding aircraft at U.S. airports) increased by 89%, but fuel consumption only increased by 27%. In part, this was due to airlines having significant incentives to cut fuel consumption, which makes up approximately 25% to 30% of their costs. Fuel consumption improves gradually as aircraft are retired at the end of their useful economic lives of 20 to 30 years and new, more efficient aircraft are substituted.
But fleet renewal and new conventional engines that burn less fossil fuel are not enough to get U.S. aviation to net-zero carbon emissions by 2050, the target set in the United States 2021 Aviation Climate Action Plan. Figure 2-9 shows that the following factors are anticipated to make contributions to the goal, in order of contribution (8):
- SAF (either at 50% or 100% reduction in emissions per gallon of fuel consumed).
- Airline fleet renewal with conventional aircraft.
- New aircraft technology, including battery-powered short-haul flying beginning in the 2030s or 2040s.
- More efficient aircraft trajectories (operations improvements), meaning improved air traffic control to reduce flight circuity.
The first three textboxes that follow consider technological solutions to reduce or mitigate emissions from the combustion of fuel: The Science, Policy, and Implications of SAF Are Fast-Moving Topics; Electric and Hydrogen Propulsion; and Carbon Capture with Utilization and Storage. The final and fourth textbox summarizes the findings on the difficulty in mitigating GHG emissions in aviation as published in the Fifth National Climate Assessment.

The Science, Policy, and Implications of SAF Are Fast-Moving Topics
The Contrails Problem: While SAF may reduce emissions, does it also reduce contrails produced by the combustion of fossil fuels at altitude? A recent NASA study notes that “jet engine exhaust includes water vapor and soot particles. As the water vapor cools, it condenses. Ice crystals form when the super-cooled water interacts with either exhaust soot or particles naturally present in the air. Contrails can end up spreading out and turning into cirrus clouds, which are far more effective at trapping heat in the atmosphere than CO2. By using alternative fuel, jet engines release fewer soot particles, resulting in fewer ice crystal formations”(12). More recent research suggests that contrails can be reduced substantially by varying the altitude of flights depending on which relatively thin altitude levels are “ice supersaturated” on a given day (13).
Does SAF Consume Too Many Resources? If SAF were made solely from farm crops, it might drive up the cost of food and consume too many land resources. One study found “the estimated total biomass requirements for aviation (produced) from sugar cane would require 125 million hectares of land; larger than the land area of South Africa” (14). Recently, United Airlines and Delta Airlines signed long-term contracts to buy ethanol made from corn; at the time of this writing, the Energy Department was evaluating the carbon footprint of this type of SAF (15).
However, advances in producing SAF by combining hydrogen and captured CO2 hold promise of a different pathway. Hydrogen can be produced using electrolyzers, which use green electricity to split water into hydrogen and oxygen. The hydrogen can then be combined with CO2 captured from captive sources (e.g., power plants, landfills) to produce SAF. New production-scale facilities are planned or under construction to produce SAF this way as well as using renewable electricity, which further reduces emissions (16).
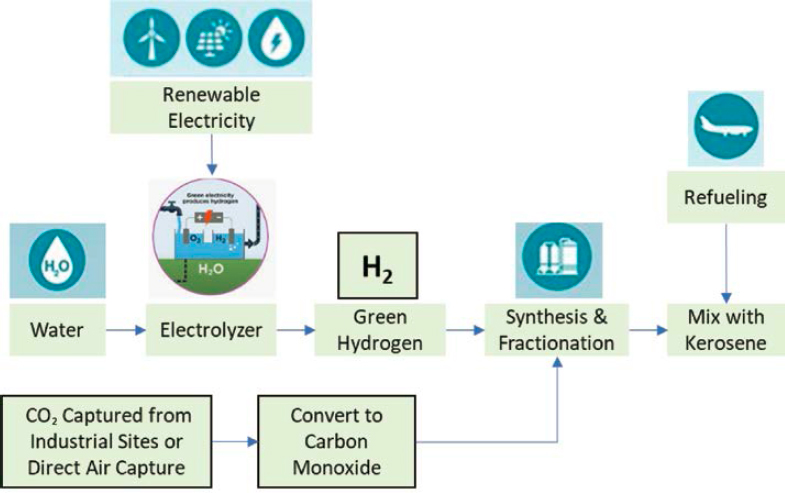
The following chart outlines the promise of creating SAF from hydrogen and CO2 recaptured from industrial processes or other waste sites, including landfills. New technology electrolyzers split hydrogen from the oxygen in water; the product is called green hydrogen when the electrolyzers use renewable electricity from wind farms, solar, or hydroelectric sources. The source of carbon for the fuel is CO2 captured from existing industrial sites (think a smokestack) or landfills. Capturing carbon this way requires less new technology than direct air capture, which may also become feasible in the future. The captured CO2 is converted to carbon monoxide, which is then fractionated with the hydrogen to create a form of SAF. For the next decade or so, SAF will be blended with kerosene, but as supplies increase, it will eventually become the sole or dominant energy source to power turbine-powered aircraft. Important features of this approach are that (1) it does not require the use of foodstuffs as a feedstock, (2) it promises significant reductions in net CO2 burned, (3) it is a plug-in fuel requiring no change in aircraft, and (4) it can be transported via existing pipeline systems.
New Tax Incentives to Produce and Consume SAF: A new set of tax credits for SAF are among the many incentives for renewable fuel production in the Inflation Reduction Act (IRA). The tax credits are governed by new rules published by the Internal Revenue Service. To qualify for the new $1.25 per-gallon SAF credit, the fuel must reduce GHG emissions by at least 50% compared with petroleum-based jet fuel. The regulation further incents reductions by including an additional $0.01 per-gallon tax credit for each percentage point above the 50% reduction for a maximum of $1.75 per gallon. The fuel must also meet the American Society for Testing and Materials (ASTM) International Standard D7566 or Fischer–Tropsch provisions of ASTM International Standard D1655, Annex A1 and have an emissions factor at or below 50 kg CO2e/MMBtu determined
in accordance with the Carbon Offsetting and Reduction Scheme for International Aviation (CORSIA). At the time of publication, the United States government was considering using an Energy Department model to certify SAF that some observers think would favor corn-based ethanol as a viable SAF (17).
The IRA defines a two-phased approach to help meet the Biden administration’s goal of producing 3 billion gallons of SAF in the United States by 2030. The first 2-year phase, 2023–2024, expands the Biomass-Based Diesel Blenders Tax Credit, established under Section 40A of the tax code, to include a separate, per-gallon incentive for SAF under Section 40B. In the second 2-year phase, 2025–2027, the tax credit is enhanced so that renewable fuels, including SAF, will be eligible for the Clean Fuel Production Credit under Section 45Z.
How Much SAF Is Needed?
According to the forecast in the International Energy Administration Energy Technology Perspective 2023, “low-emission synthetic hydrocarbon fuels (primarily jet kerosene), production of which is minimal today as most technologies are still under development, reach 2.4 billion liters in 2030 (more than the oil consumption of domestic aviation in Japan in 2021) and over 105 billion liters by 2050 (equivalent to the total oil consumption of domestic and international aviation in the United States and the European Union combined in 2021). Production of low-emission hydrogen from electrolysis or natural-gas-based hydrogen with carbon capture and storage (CCS) jumps from around 0.5 Mt in 2021 to 450 Mt in 2050 – equal in energy equivalent terms to about half of the world’s energy consumption in the transport sector in 2021” (18).
Electric and Hydrogen Propulsion
Two main new technology propulsion proposals do not involve the use of SAF: electric propulsion and hydrogen-powered aircraft.
Electric Propulsion: Aircraft with electric propulsion are favored for short-haul, regional operations due to weight and energy storage limitations. They include pure electrics with electric power plants powered by onboard batteries or onboard fuel cells using hydrogen to provide electricity, and hybrids combining a battery with another fuel such as jet fuel or SAF.
Given the constraints of electric propulsion, pure electric aircraft are likely to be limited to missions under 250 miles with a capacity of 50 or fewer seats. (Because of range and size constraints, Chapter 3 documents why these aircraft are likely to account for about 6% of the needed reduction in aviation emissions.) Several associated technology solutions need to be addressed, including battery weight per given energy stored, cooling systems, battery charging time when an aircraft is on the ground versus battery swaps, airport electrical supply/green production, and airport charging areas distinct from flammable fuels (Jet A, hydrogen, etc.), among others.
There are, however, a number of promising developments; different organizations are looking at ways in which electric battery density can be increased. One example is NASA’s Solid-State Architecture Batteries for Enhanced Rechargeability and Safety (SABERS) project (https://www.nasa.gov/wp-content/uploads/2021/04/sabers_cas_fact_sheet_508.pdf). Unlike standard lithium-ion batteries, the SABERS project utilizes sulfur and selenium. These solid-state batteries hold more energy and are less prone to issues such as overheating and fire, which have been risks associated with lithium-ion battery technology (19).
Hydrogen-Powered Aircraft: Hydrogen has a specific energy-per-unit mass that is three times greater than traditional jet fuel. If generated from renewable energy through electrolysis (see the earlier textbox “The Science, Policy, and Implications of SAF Are Fast-Moving Topics”), hydrogen emits no CO2 emissions, thereby enabling renewable energy to potentially power large aircraft over long distances but without the undesirable by-product of CO2 emissions. Hydrogen can be combusted through modified gas turbine engines or converted into electrical power that complements the gas turbine via fuel cells. Because hydrogen has a lower volumetric energy density, the form factor of future aircraft will likely need to change to better accommodate hydrogen storage solutions that will be bulkier than existing jet fuel storage tanks. One of the chief deterrents to the use of hydrogen directly in combustion is the great expense and long time period required to change out fleets.
On the airport side, liquid hydrogen will require new infrastructure and layouts—for example, segregating electric aircraft recharging areas from liquid hydrogen fueling areas for safety reasons. Liquid hydrogen may be transported to the airport via special pipelines, tankers (rail or road), or even produced on-site, providing access to green energy is available.
Carbon Capture with Utilization and Storage
Carbon capture with utilization and storage (CCUS) is an emerging technology designed to sequester emissions directly from polluting industrial plants or applied in bioenergy carbon capture and storage (BECCS) plants. Once the carbon is captured through different processes, it is then stored underground in geologic formations or utilized in products. CCUS has not yet been scaled up to meaningful levels (20). One of its more promising applications includes the ability to produce aviation synthetic fuels (21) (see the earlier textbox “The Science, Policy, and Implications of SAF Are Fast-Moving Topics”).
One significant challenge for CCUS, which is the case for all carbon utilization methods, is that sufficient market demand is required for the goods created using the extracted carbon to make the process economically viable. If there is a market for carbon, CCUS becomes more economically viable.
On the other hand, sequestering CO2 as a waste product is a pure cost without much inherent value in the sequestered carbon. In the absence of a market for carbon, government incentives and investments may be needed to make this method economically attractive. There are also concerns and challenges about the difficulties of storing captured CO2 underground, such as the location, suitability, and design of underground reservoirs. As a result, NIMBY (not in my backyard) political opposition to this form of CCUS may materialize. Specifically, there may be controversy over the risks associated with large quantities of CO2 leaking into the environment in the event of a natural disaster or accident.
Direct air capture (DAC) is considered a type of CCUS technology; it has the potential to remove CO2 directly from the atmosphere, which sets it apart from other CCUS methods. Some scientists believe that the world has delayed cutting GHG for so long that reaching net-zero goals will require removing carbon from the atmosphere. The first commercial plant opened in California in November 2023. It has very limited capacity but features a modular design that can be expanded. The current cost per ton of carbon removed from the atmosphere is about $600 (22). The feasibility of DAC on a large scale is still uncertain because the technology is only employed at about 18 separate small plants worldwide (23). Because of this, the future operating costs of the technology are also uncertain, but the expected costs to remove a ton of CO2 using DAC remain very high (potentially around $300 per ton of CO2 by 2030) (24).
National Climate Assessment (November 2023)
The Fifth National Climate Assessment (NCA) was published on November 14, 2023, and confirmed the facts about the difficulty in mitigating GHG emissions in aviation and the potential remedies, including SAF and carbon removal. The following statements are extracted from the NCA (25). Emphasis on the word “aviation” has been added.
- Mitigation is the most cost-effective response to climate change, with potentially large benefits to economies.
- However, the optimal mix of technologies to reach net-zero emissions is not yet clear, and further research and development are needed to determine the best options for long-duration energy storage, non-emitting and dispatchable (sometimes called firm) sources of electricity, and net-zero options for aviation and long-distance freight transport, as well as carbon dioxide removal.
- Decarbonization of the most difficult-to-electrify transportation sectors (e.g., aviation, international shipping) may require liquid biofuels or fuels synthesized using electrolytic hydrogen and carbon captured from the atmosphere.
- Hydrogen, ammonia, alcohols, and carbon-based fuels (e.g., methane, petroleum, methanol) can all be produced with low and eventually net-zero CO2 emissions. However, it is not clear whether producing and burning these fuels would be lower in cost and more sustainable than continuing to use fossil fuels and managing the related emissions through CCS or carbon dioxide removal (CDR; removal of CO2 from the atmosphere).
- A key challenge is the current high cost of producing hydrogen from zero- or low-emitting processes. Hydrogen produced from carbon-emitting steam methane reforming—where methane, steam, and a catalyst are used to make hydrogen—can cost in the range of $1–$2.50/kg H2, much lower than the more than $4/kg H2 achievable with current electrolysis technology and wind or solar power. The U.S. Department of Energy’s Hydrogen Shot program has set a goal of achieving clean hydrogen production for $1/kg H2 within a decade by reducing both electrolyzer and wind/solar electricity costs.
- Most model scenarios that reach net-zero emissions in the United States entail substantial use of CDR technologies, not as a replacement for emissions reductions but instead to offset continuing emissions from the most difficult-to-decarbonize sectors and processes, such as aviation.
- Current energy models are relatively simplistic in their representation of CDR, typically including only 1) bioenergy with carbon capture and storage (BECCS), 2) afforestation/reforestation, and 3) industrial direct air capture (DAC). Among these methods, the on-land biological options (BECCS and afforestation/reforestation) are the most prevalent in net-zero emissions scenarios; BECCS dominates if underground carbon sequestration is allowed.
- BECCS involves using sustainably sourced biomass to create steam that turns electrical generators into energy. It can be carbon neutral because plants absorb CO2 from the atmosphere as they grow. This, in turn, offsets CO2 emissions released when the biomass is combusted as fuel. When sustainable bioenergy is paired with carbon capture and storage, it becomes a source of negative emissions, as CO2 is permanently removed from the carbon cycle.
- Afforestation/reforestation involves either planting trees where they have never been or adding trees to forested areas. Trees can capture and hold CO2 that is present in the atmosphere.
- DAC involves various processes to capture CO2 from the atmosphere using man-made processes; at present, the cost is prohibitive, but the technology is advancing.
In summary, aviation is costly to remediate because most aviation emissions (approximately 97%) are due to engine combustion, and, at least at the time of this writing, the cost of alternative fuel, which is not yet being produced at scale, is prohibitive. The rest of the aviation value chain, including most airport operations, has more viable remediation alternatives. These are discussed broadly in the next section.
The Role of Airports Versus Aircraft Operators and Others in the Aviation Value Chain
The first step in establishing a way to address airport emissions is to estimate the amount attributable to the airport. All emission sources of an entity and its activities are divided into “Scopes.” According to the GHG Protocol (26), the entity claims responsibility for emissions from Scopes 1 and 2, whereas Scope 3 emissions are upstream or downstream sources in conjunction with the entity’s activities but are not directly controlled by the entity.
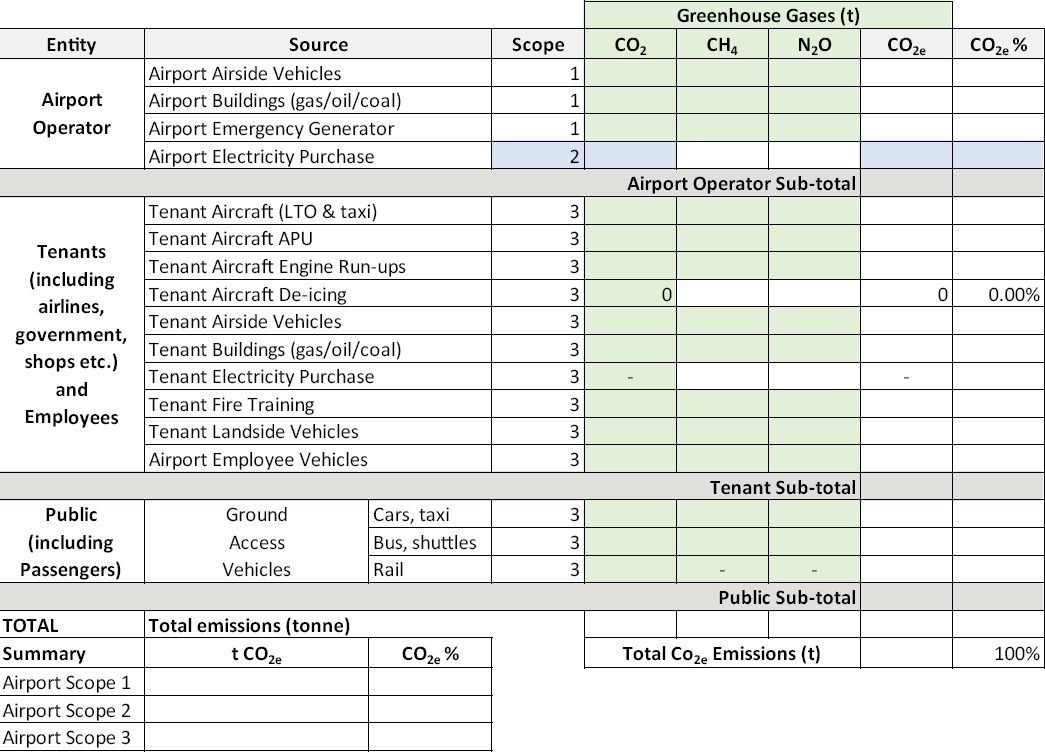
Table 2-2 shows the Scopes 1, 2, and 3 emissions at airports as defined by the ACI’s ACERT (27).
Scope 1 direct emissions are made by sources owned or leased by the airport, including
- Airside vehicles owned or leased by the airport (as opposed to the airlines, which would be Scope 3);
- Natural gas, fuel oil, and other fuels used by the airport for both heating and power generation; and
- Emissions from the generation of electricity and heat by an on-airport fossil power plant, including power sold to tenants.
Scope 2 electricity and heat purchased by the airport operator include emissions from heat and electricity used to heat and cool airport facilities but not resold to tenants.
Scope 3 tenant and public emissions include
- Emissions by aircraft during the landing and takeoff (LTO) cycles, which include running auxiliary power units, taxiing, engine run-ups, and glycol deicing;
- Airport employees, tenant employees, visitors, and general public vehicle emissions; and
- Corporate travel by airport staff, including the emissions from entire commercial flights, not just the LTO cycle.
If the airport has not already done so, one way to establish the emissions for which it is responsible is to apply the ACERT. This tool is free and uses easily available airport data. There are 11 steps to filling in the INPUT page in the ACERT. Most of the steps involve dividing activity into Scopes 1
Table 2-2. ACERT airport emissions classification.
| Scope | Description | Airport Examples |
|---|---|---|
| 1 | Airport operator-owned or leased emission sources (fossil and other). | Vehicle and machinery fuels, boiler house, furnaces, emergency generators, fire practice, surface deicing processes, even own aircraft. |
| 2 | Airport operator purchased and self-used electricity, heat, or steam emissions. | Electricity from city utilities, heat from a power plant. |
| 3 | Nonairport operator-owned sources of the airport system. | Aircraft (main engine, auxiliary power units), ground support equipment, engine tests, deicing, landside access traffic, staff business trips, third-party emissions (e.g., boilers, refrigeration, generators, construction). |
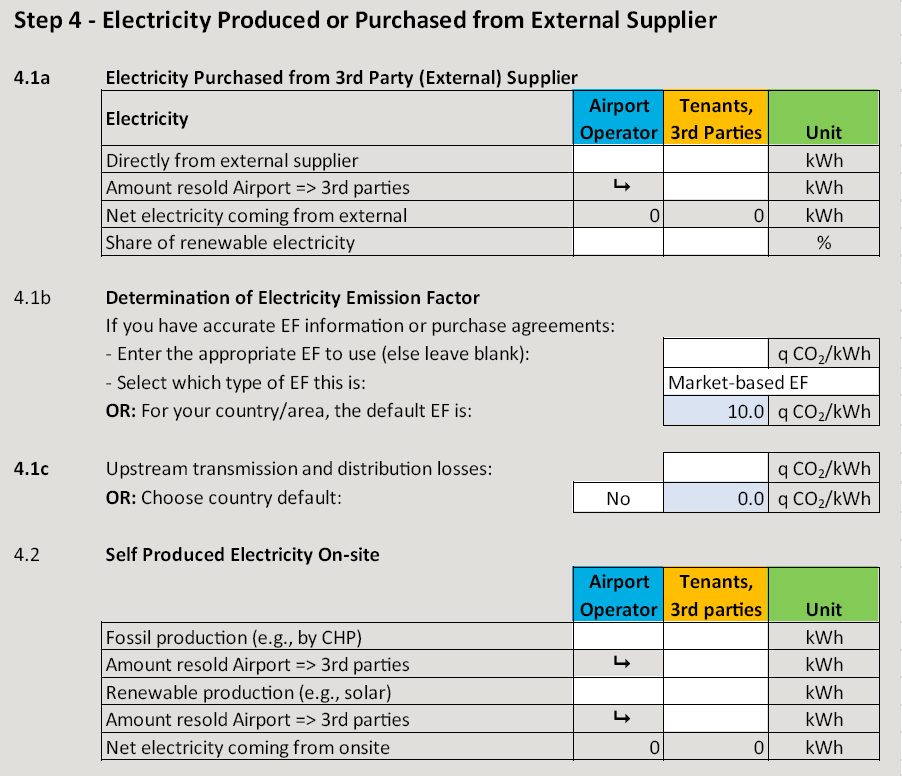
and 2 (those directly or indirectly controlled by the airport) and Scope 3 (those controlled by tenants, including airlines). Figures 2-10 and 2-11 show excerpts from the INPUT page for electricity and aircraft:
Notice that the electricity consumption is split between the airport and its tenants, as is the percentage of electricity from renewable sources. ACERT also distinguishes between self-generation and purchased electricity inputs. Figure 2-11 shows how the model distinguishes aircraft types, which have different fuel burn rates that are used to estimate LTO emissions.
The model produces a useful summary of emissions sources including Scopes 1 and 2 that the airport can address directly as well as Scope 3 emissions that it can try to influence by working with tenants and other stakeholders. An example of an ACERT report is in Figure 2-12.
The process for using ACERT is straightforward; the model is free and can be found on the ACI website at https://store.aci.aero/form/acert/.
It is important to note that the ACERT does not account for well-to-tank emissions from jet fuel, including extraction, transportation, and refining of fossil fuels delivered to the airport. Adding well-to-tank emissions would result in a markup of jet-fuel-based emissions by about 21%. However, the Scopes 1 and 2 emissions are the ones that airports can work on most directly.