Constructing Valid Geospatial Tools for Environmental Justice (2024)
Chapter: 3 A Conceptual Framework for Building Composite Indicators
3
A Conceptual Framework for Building Composite Indicators
The White House Council on Environmental Quality’s (CEQ’s) Climate and Economic Justice Screening Tool (CEJST)1 is an example of a geospatial tool that calculates a composite indicator. A composite indicator represents a complex, multidimensional concept or condition and assesses the existence or intensity of that concept for real-world entities such as countries, states, cities, regions, companies, or universities. While an indicator relies on data measurements that are chosen to represent the indicator, a composite indicator is a combination of those measurements. The calculation of a composite indicator is useful when the concept being described is better represented through a combination of different factors. This is accomplished by bringing together measurements across the multiple dimensions of the concept so that a single number and small sets of numbers reflect the condition with the greatest validity possible. For example, as discussed in Chapter 2, community disadvantage is a multidimensional concept. CEJST attempts to identify which census tracts meet this condition by combining data measures across its “categories of burden”2 to indicate if the census tract is considered disadvantaged.
This chapter provides a foundation for a structured iterative process for constructing tools that calculate composite indicators, such as CEJST and other environmental justice (EJ) tools. Such a structured process can be applied in the development of EJ composite indicators, regardless of the application, because it provides a logical workflow and mechanisms to validate construction decisions and tool results. The chapter first describes the purpose of EJ tools and how decisions regarding construction can affect tool utility. This is followed by a discussion of the conceptual foundation for composite indicators, an overview of the process for constructing composite indicators,
___________________
1 See https://screeningtool.geoplatform.gov/en/#3/33.47/-97.5 (accessed September 15, 2023).
2 Note that the literature uses the concept of “impact” where CEJST refers to “burden.” When referring to CEJST, this report will use CEJST’s terminology.
and the questions that must be addressed in the process. Following this, the essential role of community engagement in tool construction is presented. The chapter concludes with the description of a conceptual framework for EJ tool development that emphasizes the importance of trust, transparency, and legitimacy for tools such as CEJST.
TOOL PURPOSE
Geographically based EJ tools are typically intended to identify disadvantaged communities or measure the extent to which those communities are burdened or disadvantaged (Balakrishnan et al., 2022). Understanding how this information might be used and by whom is critical to the development and evaluation of EJ tools (EPA, 2022a). A tool might have multiple users—including local, state, and federal regulators, community advocates, grant applicants, academic researchers, and individual members of the public—all using the tool for different purposes. The tools might be used for educational purposes (e.g., to provide information and raise awareness about EJ concerns in specific communities and support advocacy for those communities) or as inputs into decisions related to, for example, local land use and facility siting, state or federal permitting, investment, funding prioritization, and regulatory compliance. One tool, California’s CalEnviroScreen,3 is used to direct investment of proceeds from the state’s greenhouse gas Cap-and-Trade Program toward disadvantaged communities.4 It is also central to multiple municipal and state programs and planning, including incorporation of EJ into the general plans of California municipalities, CalEPA’s Environmental Justice Enforcement Task Force, the California Air Resources Board’s Community Air Protection Program, and to identify vulnerabilities for tracking progress related to implementing the human right to water (Lee, 2020). Analogously, Washington State uses its Environmental Health Disparities (EHD) Map tool5 to prioritize state grants and other resources. Washington state law directs utilities to focus their efforts on reducing pollution and increasing the benefits of clean energy to “Highly Impacted Communities,” defined as census tracts in the highest two ranks of cumulative impacts according to the EHD map. Washington State’s Department of Health has developed educational materials based on the EHD to bring public and environmental health tools and data into high school science classrooms in partnership with the Puget Sound Educational Service District.6
As the above examples illustrate, many EJ tools (including CEJST) are intended to provide input into a decision-making process. Often, their results are intended to provide an initial “screening” of eligibility or of high-priority communities. Such tools are sometimes termed “screening tools.” The tool might be used to identify, for example, communities that would be eligible for funding (or, in the case of CEJST,
___________________
3 See https://oehha.ca.gov/calenviroscreen (accessed September 15, 2023).
4 See California Climate Investments to Benefit Disadvantaged Communities at https://calepa.ca.gov/envjustice/ghginvest/ (accessed December 21, 2023).
5 See https://doh.wa.gov/data-and-statistical-reports/washington-tracking-network-wtn/success-stories (accessed September 27, 2023).
6 See https://doh.wa.gov/data-and-statistical-reports/washington-tracking-network-wtn/success-stories (accessed December 28, 2023).
extra consideration for funding), but the tool would not be the sole determinant of which communities, among those that are eligible, would receive funding. Similarly, an EJ tool could be used to rule out certain communities as potential sites for new facilities that could exacerbate EJ issues impacting communities that are already disadvantaged. The tool, however, would not be used to determine ultimate siting decisions.
In the case of CEJST, the tool is intended to screen for eligibility for dispersal of different kinds of funds under the Justice40 Initiative for very different programs. Constructing indicators for this type of use requires a carefully considered structured development process that is informed by a clear definition of the tool’s purpose. The tool and its indicators need to be designed in the context of the decisions it is intended to inform and in consideration of unintended consequences from the tool’s use such as changes in property valuations, green gentrification, or displacement (e.g., Siddiqi et al., 2023). Results obtained from an initial screening using the tool would need to be coupled with information (e.g., community concerns, history of enforcement/violations, risk assessments, political priorities, and other policy considerations) from other sources before final allocation decisions are made, especially if the tool is general in nature and intended to support decisions in many sectors. For example, federal agencies are required to use CEJST to screen whether investment in a particular community would qualify for meeting the Justice40 goal, but no guidance is provided at present regarding the allocation of funds among those designated as qualified (EOP, 2023).
BINARY VERSUS NONBINARY TOOLS
Tools designed to determine eligibility need to ultimately lead to a categorization of a community as either disadvantaged or not disadvantaged. The Urban Institute refers to these as “binary” tools (Balakrishnan et al., 2022). Binary tools provide an “is or is not” measure of disadvantage. In contrast, “nonbinary” tools provide a continuous measure of the extent to which a community is burdened, or they reflect differences in burden levels across communities (Balakrishnan et al., 2022). The output of CEJST is binary; it is designed to identify specific communities as “disadvantaged” for the purpose of qualifying for further investment under the Biden Administration’s Justice40 Initiative. While it categorizes communities as disadvantaged or not, it does not distinguish between communities that might be deemed “severely disadvantaged” and those that are “somewhat disadvantaged.” In contrast, the EPA’s Environmental Justice Screening and Mapping tool (EJScreen)7 shows continuous measures (i.e., percentiles) of various environmental or socioeconomic stressors for communities across the country, but it does not categorize or label “environmental justice” communities or “disadvantaged” communities. California’s CalEnviroScreen and SB 535 Disadvantaged Communities8 have hybrid functions. CalEnviroScreen provides an index or score for community disadvantage/environmental burden, which is used to show a continuous metric of
___________________
7 See https://www.epa.gov/ejscreen (accessed September 15, 2023).
8 See https://oehha.ca.gov/calenviroscreen/sb535 for more information on California Senate Bill 535 and how CalEPA implements it through their tool, CalEnviroScreen (accessed February 9, 2024).
cumulative impacts across the state. Since CalEPA, following California SB 535, is responsible for identifying “disadvantaged communities” to prioritize funding, a threshold using CalEnviroScreen’s cumulative impact score was chosen for that designation. Mitigation efforts can be further focused on the most heavily burdened within designated communities.
An important question regarding the development of binary tools such as CEJST is how to set the criterion or criteria for being “in” (i.e., disadvantaged) versus “out” (i.e., not disadvantaged). Because “disadvantage” is typically a matter of degree without a universally accepted standard or threshold, setting the criteria is a subjective decision of policy makers, interested and affected parties, or tool designers. The choice of criteria has important implications, both when used for initial screening (e.g., for funding eligibility) and when used as input into final decision making (e.g., allowing a permit or not). Higher thresholds or more stringent criteria for inclusion necessarily limit the communities included, potentially allowing for more targeted prioritization, yet these stricter conditions risk excluding communities that are genuinely overburdened even though they do not meet the threshold or the specific criteria chosen. Conversely, a less stringent threshold would expand the set of included (eligible) communities, thereby generating what might be viewed as a more inclusive definition of disadvantaged but also elevating communities with comparatively fewer burdens. If, in practice, limited funds are spread across a set of eligible communities, a more inclusive definition could lead to less investment in communities bearing the greatest burdens. Moreover, even when funding will not be distributed across all eligible communities, it is possible that funds will go disproportionately to eligible communities with relatively low burdens that have the resources to successfully compete for available funds rather than to communities that have been marginalized and suffer from underinvestment and overburdening based on socioeconomic, racial, and demographic composition (McTarnaghan et al., 2022). Ultimately, choosing the criterion or criteria used by the tool for categorizing a community as disadvantaged will be somewhat subjective. The impact of these choices can be further exacerbated when thresholds on single indicators are used to designate a location as disadvantaged, as opposed to thresholds on a composite indicator. This is particularly true when the scale of analysis can lead to community disadvantage being obscured by boundaries, such as census tracts, that do not reflect the underlying patterns of disadvantage. Evaluating the robustness and validity of such choices is discussed in Chapters 6 and 7, respectively.
USE OF COMPOSITE INDICATORS
Composite indicators are widely and increasingly used to reflect multidimensional concepts such as well-being (Salzman, 2003), gender inequality (World Economic Forum, 2020),9 ecological footprint (Wackernagel and Rees, 1996), and human development (UNDP, 1990). In the case of EJ, there are numerous examples of composite
___________________
9 See UNDP’s Gender Inequality Index: https://hdr.undp.org/data-center/thematic-composite-indices/gender-inequality-index#/indicies/GII (accessed September 25, 2023).
indexes being used, as are explored in the scan of tools in this report (see Chapter 4). The advantages of using composite indicators include discriminating among competing hypotheses; structuring, understanding, and conceptualizing solutions; performance tracking in relation to goals and objectives; choosing among alternative policies; and informing interested and affected parties and the public (Failing and Gregory, 2003; Hezri and Dovers, 2006; Miller, Witlox, and Tribby, 2013). Composite indicators can have some disadvantages: since they reduce complex multidimensional phenomena to a single number or small set of numbers, they can support misleading, nonrobust policies if poorly constructed, and can invite simplistic policy conclusions, subjectivity, and the potential for inappropriate policy decisions if difficult-to-measure dimensions or features are ignored. At the same time, their ability to summarize complicated issues — while providing a “big picture” summary and transparency by making assumptions and goals explicit—makes composite indicators useful for supporting policy decisions.
Composite indicator construction can vary substantially. Variations can exist in the indicators chosen, in the methods used for normalizing and aggregating datasets, and in validating indicators and tool results. At times, subindexes—essentially forming composite indicators within the overall composite indicator which then need to be combined—will be desirable. However, there are systematic and defensible approaches to composite indicator construction that are common to many tools (Mazziotta and Pereto, 2017; OECD and JRC, 2008; Salzman, 2003). Successful composite indicators (including those employed in EJ tools) define their purpose and intended audience, and they pursue correctness or truthfulness. The validity of a tool rests on a foundation of scientific and methodological rigor, meaningful participation and input from community members and other interested and affected parties, transparency, and acceptance by institutional actors (especially government agencies or regulators), communities, and other affected parties.
CONSTRUCTING COMPOSITE INDICATORS
Building a national-scale EJ tool (such as CEJST) with far-reaching policy implications is aided by a systematic approach to ensure that the composite indicator measurements are internally coherent, transparent, easily interpreted, and externally valid, and capture relevant aspects of the concept being measured (Miller, Witlox, and Tribby, 2013). Widely used approaches for composite indicator construction already exist and are used to guide national and international policy (Mazziotta and Pareto, 2017; OECD and JRC, 2008; Salzman, 2003). Such a systematic approach provides a workflow for constructing a composite indicator and ensures that important considerations are factored into the construction. A systematic approach also provides an outline for documenting and explaining the decisions made in the creation of a composite indicator tool.
The Organisation for Economic Cooperation and Development’s (OECD’s) Statistics Directorate, Directorate for Science, Technology and Industry, and Econometrics and Applied Statistics Unit of the Joint Research Centre (JRC) of the European Commission developed a methodology guide for constructing composite indicators (OECD and JRC, 2008). The components of composite indicator construction laid out by OECD
include conceptualizing the indicator’s meaning, rigorous statistical testing of the internal consistency of indicator metrics, as well as external validation and communication. For the last 20 years, OECD and JRC guidance on composite indicator construction and evaluation has provided methodological expertise to the European Commission and its member countries, as well as to the academic community.10 However, the process of indicator development is not strictly a technical or scientific exercise (Saisana et al., 2022).
Michaela Saisana,11 an author of the OECD manual, described to the committee (see Appendix B for public meeting agenda) that composite indicator development is “a delicate balance between science and art.” The “art” refers to subjective decision making (e.g., which variables to include or exclude, how to weight different indicators, which benchmarks to use), as well as the process of composite indicator validation. Because a composite indicator measures something that is not directly observable, developers seek to corroborate the composite indicator’s truthfulness by comparing it to other well-known metrics or indicators and by soliciting input from the communities that are being measured and for whom the tool is intended. A composite indicator’s utility is dependent on rigorous science and technique, clear communication of its meaning (and its limitations) to the intended audience, and, ultimately, on acceptance by interested and affected parties and policy makers (Fekete, 2012; Lee, 2020).
Saisana’s insights echo the lessons learned during the development of CalEnviroScreen, an influential EJ composite indicator in the United States (Grier et al., 2022; Lee, 2020). Manuel Pastor, an EJ scholar and key architect of the Environmental Justice Screening Method (see Sadd et al., 2011) at the heart of CalEnviroScreen, recalls that the process for developing CalEnviroScreen’s methodology involved extensive feedback from residents, community members, and other interested and affected parties (Sadasivam and Aldern, 2022). Arsenio Mataka, former assistant secretary for environmental justice and Tribal affairs at CalEPA, described six principles that resulted in CalEnviroScreen acceptance: the tool is (1) grounded in science, (2) informed by community experience, (3) endorsed by government, (4) universally available to everyone, (5) based on thorough public participation, and (6) able to serve as a “third-party validator” in local issues or other venues (described in Lee, 2020).
Guidance for Constructing Composite Indicators
The OECD Pocket Guide to Composite Indicators and Scoreboards (Saisana et al., 2019) outlines a 10-step process for composite indicator construction. The processes outlined in the OECD guide and other guides on indicator construction (e.g., Mazziotta and Pareto, 2017) do not focus on specific methods for accomplishing each step but rather on the importance of thinking through each step and the impact that each has on
___________________
10 See JRC’s Competence Centre on Composite Indicators and Scoreboards at https://knowledge4policy.ec.europa.eu/composite-indicators/about_en (accessed February 9, 2024).
11 Michaela Saisana was head of the Monitoring, Indicators and Impact Evaluation Unit for the European Commission’s Competence Centre on Composite Indicators and Scoreboards at the JRC in Italy at the time of this writing.
the resulting composite indicator. Although these steps are laid out linearly, the process of constructing a composite indicator is iterative and requires constant reevaluation and adjustment based on a loop of feedback. Community engagement and partnership are necessary at every step of the process. (See the next section of this chapter for more details on community engagement strategies.)
The following briefly summarizes each step of the OECD’s pocket guide and can be considered a workflow for indicator construction:
- Define the concept to be measured. This can be accomplished by answering questions such as: What are the objectives of the composite indicator? What is the basic definition of the concept (e.g., disadvantaged community)? What is the relationship between the definition and the objective? What are the multiple facets of the concept to be captured by indicators and are they complete, appropriate, and consistent with existing theory, empirical evidence, and lived experiences? Expert and stakeholder judgment is crucial in this step to acknowledge multiple viewpoints and achieve robustness (OECD and JRC, 2008). Thinking about the concept as a collection of facets or dimensions to be measured using a set of indicators helps with conceptualization, supports careful definitions and structure of the measurements, and helps to improve understanding. These facets can also make it easier to determine how indicators are weighted and combined (see below). The composite indicator literature refers to these concept facets as dimensions or subgroups; CEJST refers to these facets as “Categories of Burdens” (CEQ, 2022a).
- Select the indicators. What are the appropriate indicators to measure the concept based on technical considerations such as validity, sensitivity, robustness, reproducibility, and scale, and practical considerations such as measurability, availability, simplicity, affordability, and credibility? Since indicator selection is closely related to concept definition, expert and stakeholder judgment is also crucial in this step (OECD and JRC, 2008).
- Analyze and treat the data where necessary. Do any of the indicators exhibit significant skew, kurtosis, or outliers that might complicate interpretation or comparison? Do any of the indicator measures require significant imputation due to missing values?
- Bring all the indicators into a common scale (e.g., normalization). Normalization methods can have substantial impacts on composite indicators (Carrino, 2017). Questions that could be asked include: Do all indicators exhibit the same directional meaning (e.g., do higher scores correspond to greater levels of “disadvantage”)? Has a suitable normalization method been used for all indicators (e.g., percentile ranking, min-max scaling, z-scores)?
- Weight the indicators. Questions to be asked include: what is the relative importance of each indicator and each subgroup to the concept being measured? Weighting can be accomplished using data-driven, statistical approaches or participatory approaches involving expert, stakeholder, and community perspectives (Becker et al., 2017; Greco et al., 2019). Indicator weighting is
- Aggregate the indicators. How should the indicators be combined: additively to allow compensability (i.e., compensation of a deficit in one indicator by excess in another), using a multiplicative approach which is partially noncompensatory, or in a noncompensable manner (i.e., that a deficit in one indicator cannot be compensated by a surplus in another; see Munda, 2012)? There are also hybrid approaches that allow some indicators to be compensatory and others noncompensatory to varying degrees (e.g., Blancas and Lozano-Oyola, 2022). If thresholds have been designated, do these appropriately reflect the goals of the composite indicator? Indicator weighting and aggregation are often considered in conjunction, given the interconnections between these decisions (e.g., Gan et al., 2017).
- Assess the statistical and conceptual coherence. Questions to be asked include: Are the indicators organized into the appropriate subgroups? To what extent are indicators correlated with their respective categories of burden? To what extent are subgroups correlated with one another (e.g., do two or more categories of burden tell the same story)? To what extent is the composite indicator biased (e.g., statistically predisposed) toward some underlying phenomenon (e.g., population size or density, urbanicity, race/ethnicity)? It is redundant for two or more subgroups to be highly correlated; however, a high correlation between subgroups may be irrelevant or desirable if the representation of various types of burdens, regardless of statistical correlation, is important to stakeholders. Bias may be undesirable because it may mean that the composite indicator is reflective of an underlying phenomenon that is the more important driver. Bias may be irrelevant because the underlying phenomenon is inseparable or simply not important from a theoretical perspective. On the other hand, bias may be desirable because it captures a phenomenon that the tool intends to measure but which cannot be measured directly.
- Assess the impact of uncertainties. Questions to ask include: What main uncertainties underlie the composite indicator? This can involve the basic concept definition, indicator selection (e.g., wrong or missing indicators), the organization of indicators into subgroups, the normalization methods, and any threshold values for indicators. How sensitive is the composite indicator to these uncertainties? What is the impact on the composite indicator when these choices are varied? Which choices have the biggest uncertainties? Sensitivity and uncertainty analyses can improve transparency and legitimacy by providing a quality assessment of the composite indicator results (Saisana, Saltelli, and Tarantola, 2005).
- Make sense of (validate) the data. Questions to be asked include: To what extent does the composite indicator tell a coherent story; does it make sense? To what extent does the composite indicator mirror or harmonize with other well-known or credible indicators or variables? Although there are technical
closely intertwined with indicator selection (discussed above in Step 2) and indicator aggregation (discussed below in Step 6). Consequently, these three steps and their intermediaries are highly iterative in practice.
- Present the composite indicator visually. Questions to ask include: How coherently does the tool present the results from the composite indicator? To what extent are tool users able to interpret the results? This step can be crucial for a geospatial mapping tool such as CEJST (see Box 3.1. for a discussion of geospatial mapping tool interface design).
approaches to composite indicator validation (e.g., Feldmeyer et al., 2020; Otoiu, Titan, and Dumitrescu, 2014), an important criterion is whether the result of the composite indicator reflects the lived experiences of people.
There is a large literature available to guide each component of the composite indicator construction process. The widely cited Handbook on Constructing Composite Indicators: Methodology and User Guide (OECD and JRC, 2008) provides a comprehensive guide to the decisions involved in each step. Chapter 4 describes the composite indicator components of existing EJ tools. Chapters 5, 6, and 7 consider indicator and data selection and criteria, aggregation, and validation, respectively.
GEOSPATIAL AND ADMINISTRATIVE DATA
CEJST and some other EJ tools use U.S. census tracts to define geographic communities since they provide nationally consistent, publicly available data that encompass the variables of interest. Census tracts are spatial units in which data about individuals, households, or environmental events or conditions within the unit are represented in the form of aggregate or summary statistics (e.g., counts, percentages, concentrations). Information about individual persons, households, or specific events in a census tract is not revealed. Using aggregate spatial units to build geographic communities is a reasonable approach, but doing so can introduce measurement artifacts that affect the results but are not features of the underlying reality. Census tracts may not align with residents’ definitions of neighborhoods and communities. A geographic community may have crisp boundaries in the real world: physical features such as rivers or mountain ranges, built features such as railroads, highways, major streets, and political boundaries often create barriers to interaction that are innate boundaries for communities. Census tracts may or may not follow these innate boundaries, but many environmental and social phenomena, such as air pollution or economic activity, do not. Instead, they tend to change gradually across these boundaries. Aggregating such data by crisp census tract boundaries may create a false impression of abrupt changes in concentration or activity.
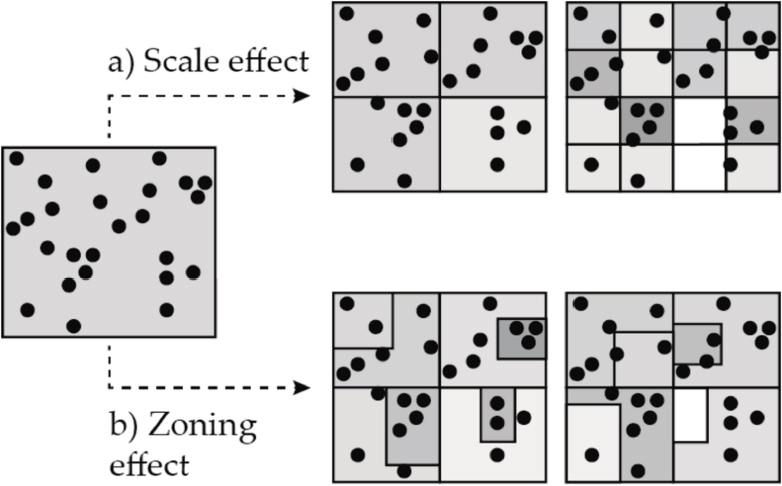
Another challenge with aggregate spatial data such as census tracts is the modifiable areal unit problem (MAUP). This is the sensitivity of measurement and analysis to the choice of spatial units for collecting and analyzing data (Fotheringham and Wong, 1991). If the scale and boundaries of these units are modifiable or arbitrarily defined, changing the scale and boundaries will change the results of the measurement and analysis based on the units. Figure 3.1 illustrates the concept of MAUP as it applies to both scale and boundaries (zones). The MAUP is a result of spatial heterogeneity within the aggregate spatial unit of analysis. It is closely related to Simpson’s paradox (the apparent change in trends measured in groupings of data that disappear or reverse when the groups are combined; Samuels, 1993).
BOX 3.1
Designing and Testing User Interfaces for Geospatial EJ Tools
Web-based geospatial mapping tools, such as the CEJST, combine the challenges of cartographic and user interface design. Although mapmaking involves artistry, there are fundamental scientific principles of cartographic design that need to be applied to ensure that the resulting map conveys information effectively. “A well-designed map has elegance and style,” clarity and meaning, and conveys “the necessary level of precision and accuracy for the intended message” (Buckley, Hardy, and Field, 2022). Integrating digital maps with interactivity raises the design challenges by expanding the purposes of map use. An influential conceptualization by MacEachren (1994) defines three dimensions of map use (high versus low interactivity, public versus private use, and presenting knowns versus revealing knowns) with map uses and, therefore, design considerations dependent on the dimensions. Interactive cartography requires different types of user interface design and usability testing (Roth, 2013; Tsou, 2011). Spatial decision support systems (SDSS) go beyond interactive cartography to include linked nonspatial data visualizations and tools for characterizing problems, evaluating solution alternatives, and assessing their trade-offs (Jankowski, 2008; Keenan and Jankowski, 2019). Collaborative SDSS includes tools for groups of stakeholders to cooperatively explore problems, solutions, and tradeoffs (Jankowski et al. 1997).
The committee did not consider map design and user interface to be part of the scope of this report, but EJ tools such as CEJST can benefit from input from cartographic and user-interface/user-experience experts to ensure that information on disadvantaged communities is effectively conveyed and used (e.g., effective representation of category breaks and choice of colors). Because CEJST characterizes a suite of indicators that range from pollution to socioeconomic status across the country’s diverse communities, there are opportunities to offer interactivity to explore these data. As described in Chapter 4, several EJ screening tools have interface functionality that allows users to view maps of individual indicators in addition to composite measures of disadvantage or burden. Other tools, such as EJSCREEN, offer infographic functionality to compare local burdens to averages at the county, state, or national level. These types of functionalities in the map interface go beyond the simple presentation of results and give users opportunities to gain insights and form narratives about their community. They can also offer practical utility: a rich, powerful user interface with data tools can be a starting point for justification of resource needs (e.g., grant applications). It is difficult for tool architects to predict which styles of cartography and which types of user interface will be most useful for their intended target audience. Therefore, careful design, testing, and workshopping of user interfaces can result in increased use and functionality of geospatial tools.
There are four major strategies for managing the MAUP: (1) use datasets that are as disaggregated as possible; (2) capture the spatial nonstationarity (heterogeneity) within the aggregate spatial unit using local spatial models (see Fotheringham and Sachdeva, 2022); (3) design optimal spatial units; and (4) conduct sensitivity analysis with the spatial units (Xu, Huang, and Dong, 2018). In addition, considering spatial heterogeneity within the spatial units can help avoid committing the ecological fallacy—assuming that the generalized characteristics of an area reflect the characteristics of individuals in that area. For example, a census tract may exhibit a modest household median income. This could indicate that most households in the tract have a modest household income. However, it is also possible that there is significant income inequality within that tract. A large proportion of households in that tract could have incomes that are significantly above the median, while another proportion in that same tract is far below the median. The actual scenario is not directly discernible from statistics for an aggregate spatial unit.
Spatial heterogeneity leads to another geospatial issue when measuring geographic phenomena. If the influence of something measured by an indicator varies with location, then the indicator’s influence on the composite indicator should also vary. For example, the impact of poor air quality on disadvantage may matter more in neighborhoods with poor health outcomes associated with other stressors, inadequate housing, or
low income than in neighborhoods with better health, housing, and resources. This is a particularly crucial issue with noncompensatory indicator aggregation since individual indicators cannot substitute for each other as in compensatory aggregation, meaning that they retain more of their relative importance in the composite indicator (Fusco et al., 2023). Spatial heterogeneity can be captured by varying the indicator’s weight by location (Fusco, Vidoli, and Sahoo, 2018). Fusco and others (2023) developed a method based on local spatial models to capture spatial heterogeneity in indicator weighting for noncompensatory aggregation.
Administrative data—data collected by public institutions or government agencies such as the Census Bureau or the Centers for Disease Control and Prevention—are subject to privacy concerns and budgetary constraints that can create error and uncertainty in its parameter estimates. This is particularly a problem with small-area estimates (e.g., census blocks, block groups, and tracts) such as those used in the American Community Survey (ACS).12 In this context, a small area refers to a subnational area (e.g., state, county, or smaller geographic entity) in which the sample size for that subnational area is insufficient to make direct sample-based estimates with reliable precision (Logan et al., 2020). The margins of error around small-area estimates, such as median incomes of demographic cohorts, are so large that it can be difficult to determine rankings or thresholds for these areas. The larger margins of error correlate with observable geographic and demographic patterns: income estimates for center-city neighborhoods are less precise than neighborhoods farther from the city center, and neighborhoods at both extremes of the income spectrum have lower-quality estimates. These problems relate to small sample sizes, and the lack of contemporaneous population controls for small areas such as census tracts. A practical solution is to aggregate the census tracts into larger, possibly noncontiguous, units. However, doing so can dilute some of the patterns and trends in the data and can also introduce additional MAUP artifacts (Jurjevich et al., 2018; Spielman, Folch, and Nagle, 2014).
Other administrative units used by the Census Bureau with data that may be relevant for Justice40 designation. For example, Census Designated Places (CDP) could provide finer spatial resolution and alignment with specific communities such as colonias, Tribal lands, and other densely settled unincorporated places.13 Census tract data could be augmented with other administrative units to capture population heterogeneities, but doing so may require addressing issues associated with coverage at a national scale and mixing of units with different population ranges. Issues of scale and mixing of units are also applicable when considering how community-generated data might be included.
While the decennial U.S. Census and the annual ACS represent reliable and widely used data sources for EJ tools, it is important to consider a few weaknesses. First, U.S. Census or ACS data focus exclusively on the residential or nighttime distribution of the population. These datasets cannot be used to assess daytime environmental exposure and risk burdens (Chakraborty et al., 2011), or analyze environmental injustices for
___________________
12 See the U.S. Census Bureau’s American Community Survey, https://www.census.gov/programs-surveys/acs, (accessed February 9, 2024).
13 See https://www.census.gov/programs-surveys/bas/information/cdp.html (accessed June 12, 2024).
individuals in schools, workplaces, and other sites inhabited by vulnerable people (e.g., daycare centers, prisons, hospitals, and health care facilities). Second, neither the U.S. Census nor ACS includes questions on how individuals or households perceive environmental risks and respond to them and on what factors influence residential location decisions (Collins et al., 2015), thus limiting their usefulness for in-depth analysis of climate or environmental injustices. Third, multiple socially disadvantaged and vulnerable population groups (e.g., racial/ethnic minorities, young children, people with disabilities, renters, and immigrant populations) have been historically undercounted by the decennial census and ACS surveys (Stempowski, 2023). These undercounting problems have amplified since the COVID-19 pandemic, in conjunction with increased nonresponse bias in ACS estimates (Rothbaum et al., 2021).
COMMUNITY ENGAGEMENT AND PARTNERSHIPS
Composite indicator construction is intricate, multifaceted, and value laden and, therefore, cannot be reduced to a purely formulaic approach. Several of the composite indicator construction steps described above involve judgments and values, including concept definition, indicator selection, weighting, and aggregation. Technical steps— such as the application of data treatments, normalization, statistical coherence techniques, and uncertainty analysis—also affect and are affected by the judgments applied during concept definition, indicator selection, weighting, and aggregation. Finally, the tool results need to make sense and have validity in the real world; this involves human judgment beyond technical considerations. There are structured approaches to collaborative and group decision making in composite indicator construction and assessment, such as multicriteria decision analysis (El Gibari, Gómez, and Ruiz, 2019), analytical hierarchy process (Gómez-Limón, Ariazza, and Guerrero-Baena, 2020), Delphi techniques (Bana e Costa et al., 2023), and quantitative storytelling (Kuc-Czarnecka, Lo Piano, and Saltelli, 2020).
Given the consequential nature of EJ tools such as the CEJST, it is essential to incorporate as part of tool validation the perspectives and lived experiences of people and communities that may be affected by decisions informed by tool results. Understanding this requires embedding collaborative decision making within careful and thoughtful community engagement that occurs early and throughout the tool creation process, informing all steps—and the process itself—iteratively as warranted (Saisana et al., 2019). Community engagement is “the process of working collaboratively with and through groups of people affiliated by geographic proximity, special interest, or similar situations to address issues affecting the well-being of those people” (CDC/ATSDR, 1997, p. 9; quoted in McCloskey et al., 2011). Community engagement is a means to divert from traditional policy making and decision making based on executive leadership and data collected by external groups toward a policy and decision-making process that is inclusive of community input from the initial planning discussions through evaluations. As discussed below, there is no single defined process for “community engagement”; there is a spectrum of possible engagements depending on the necessary level of involvement of community members and other interested and affected
parties. However, there are commonalities among the community engagement principles followed by many community organizations, universities, and state government agencies. Table 3.1 provides a high-level overview—and potential workflow—of eight aspects of community engagement as defined by Bassler and others (2008). Community engagement is a continuum and a nonlinear process, especially as collaborations mature (Schlake, 2015). Table 3.2 provides a list of additional information resources related to successful community engagement and community partnerships that can be used to establish the validity and use of the CEJST and other screening tools.
Not all participatory methodologies are effective, and some methodologies may lead to no change, continued marginalization, or even additional harm (e.g., Gaynor, 2013). Understanding who is included and excluded in community engagement and the power relations established through application of different methodologies for engagement is important in the design of community engagement programs. Trust-based and healthy community engagement and partnerships allow interested and affected parties to realize the reach of their personal power, influence, responsibility, and accountability. Below is a list of some potential benefits and returns on investment from developing and sustaining community partnerships and incorporating community engagement in each stage of the work (adapted from Bassler and others, 2008):
- Community buy-in and support for the process, program, and results;
- Increased enthusiasm and support for shared goals;
- Development of new and larger networks based on deeper understanding between interested and affected parties;
- Improved community education around important issues;
- Improved community advocacy and accountability for decision makers;
- Increased sense of empowerment and self-determination among communities;
- Increased and stronger community partnerships rooted in trust and authentic communication; and
- Potential improved community outcomes.
Community engagement also provides means to allow communities to help define themselves, empowers them with opportunities to influence how their own data or data about them might be properly and respectfully used, and to help identify, for example, any unintended consequences associated with the use of a tool (e.g., as a result of being labeled or defined a certain way).
Guiding Principles for Community Engagement
Establishing and practicing principles for community engagement and the collection of lived-experience data provide a strong foundation on which to build sustained relationships based on trust—including trust in EJ tools and their results. Principles exist (as described below) that may be adapted and used by those developing, maintaining, or evaluating EJ tools. However, specific applications need to be developed or adopted in collaboration with community members. Disadvantaged communities commonly
TABLE 3.1 Workflow for Community Engagement
| Category | Principle | Details |
|---|---|---|
| Beginning the process |
1. Define the community issue, the scope of the problem, and the framework. |
Clearly define the activity’s purpose. Define and determine the population(s) to engage. Define goals and ensure that the scope of the project is feasible and the goals are realistic while acknowledging that large goals can be divided into smaller goals. |
|
2. Define roles and level of community engagement. |
Define goals and methods to obtain the goals. More in-depth information on the spectrum of community engagement will be discussed later in this chapter and can also be found in a report by Gonzalez (2019). | |
| Items necessary for engagement |
3. Identify existing tools for community engagement. |
Meet in the community with which you wish to engage and involve community members. There are multiple recommended protocols for community engagement, but community engagement practices should be rooted in community-created principles such as the Jemez Principles for Democratic Organizing (Solis, 1997) and the Principles of Environmental Justice.a |
|
4. Identify stakeholders and be intentional about the community’s right to self-determination. |
Self-determination for the individual and community is vital to and at the core of the community process. This requires acknowledging and accepting the full humanity and authority of those traditionally not seen as “experts.” While no community is a monolith, it is difficult to achieve community buy-in without making space for community influence. This also requires accepting decisions and feedback from stakeholders as valuable and without discounting their authority. For capacity-building purposes and diversity of ideas, consider intergenerational stakeholders. | |
| Succeeding in the engagement process |
5. Develop a plan to create and sustain community partnerships. |
Effective community engagement requires transparent discussion and partnerships where all participants are equal. They identify opportunities, levels of contributions, and returns on investment. Develop means of community communication that are authentic and comfortable to the community. Ensure that means of engagement are as accessible as possible. Create financial plans to pay community stakeholders for their time and contributions. Pay them as you would career professionals. |
| Category | Principle | Details |
|---|---|---|
|
6. Respect community diversity and needs. |
Accept that communities are not monoliths. Ensure that engagements are accessible, consider childcare, provide meals, and accept cultural and language differences. | |
|
7. Co-create evaluation and feedback plans and determine next steps. |
Accept community lived experiences when developing evaluation plans. Communities must have a say in evaluating plans and accountability. Community feedback needs to be incorporated into every step of the work, including plans for outcome dissemination. | |
|
8. Maintain flexibility and open lines of communication. |
Release the urge to control the process. Welcome the inner individual and organizational changes, even though they may be uncomfortable. Welcome changes to program development and outcome expectations. Be willing to change and adapt as society and community needs and wants change. This is vital to sustaining trust-based community partnerships. Flexibility and adaptation require open lines of communication where all stakeholders know who to contact and where their feedback will go within partnering organizations. Stakeholders must be consistently updated with the outcomes of their feedback, concerns, questions, and ideas. |
a The Principles of Environmental Justice came out of the First National People of Color Environmental Leadership Summit in Washington, DC. https://www.ucc.org/what-we-do/justice-local-church-ministries/justice/faithful-action-ministries/environmental-justice/principles_of_environmental_justice/ (accessed December 28, 2023). SOURCE: Bassler et al., 2008.
express frustration with the lack of true community participation in decisions that will disproportionately impact their lives and well-being. Often, what is referred to as “community engagement” sustains the marginalization at the root of the issues to be addressed (Gonzalez, 2019). Unfortunately, “community engagement” is commonly little more than a survey or a single community meeting from which input received is later ignored.
Community engagement can occur at various levels along a spectrum that ranges from ignoring through informing, consulting, involving, collaborating with, and deferring to communities (see Table 3.2; Gonzalez, 2019). Partnership lies beyond engagement, involving sustained relationships and power sharing; effective engagement may lead to partnerships (Nardo et al., 2005). The urban planning literature includes the “ladders of engagement” model by Arnstein (1969), which describes a similar spectrum of community engagement. It refers to eight rungs, progressing from nonparticipation through degrees of tokenism, such as informing the public or receiving their consultation, and on to varying degrees of citizen power at the top (e.g., partnership, delegated power, and citizen control). This highly impactful model guides public engagement in planning (Slotterback and Lauria, 2019).
Many social and EJ organizations, and a growing number of nonprofits rely on the Jemez Principles for Democratic Organizing (Solis, 1997; see Box 3.2) and the Prin-
TABLE 3.2 The Spectrum of Community Engagement
| Stance Toward Community | Ignore | Inform | Consult | Involve | Collaborate | Defer To |
|---|---|---|---|---|---|---|
| Impact | Marginalization | Placation | Tokenization | Voice | Delegated power | Community ownership |
| Community engagement goals | Deny access to decision-making processes | Provide the community with relevant information | Gather input from the community | Ensure community needs and assets are integrated into the process and inform planning | Ensure community capacity to play a leadership role in implementation of decisions | Foster democratic participation and equity through community-driven decision making. Bridge divide between community and governance |
| Message to community | Your voice, needs, and interests do not matter | We will keep you informed | We care what you think | You are making us think (and therefore act) differently about the issue | Your leadership and expertise are critical to how we address the issue | It’s time to unlock collective power and capacity for transformative solutions |
| Activities | Closed-door meetings Misinformation Systematic | Fact sheets Open houses Presentations Billboards Videos | Public comment Focus groups Community forums Surveys | Community organizing and advocacy House meetings Interactive workshops Polling Community forums | MOUs with community-based organizations Community organizing Citizen advisory committees Open planning forums with citizen polling | Community-driven planning Consensus building Participatory action research Participatory budgeting Cooperatives |
| Resource allocation ratios | 100% Systems admin |
70-90% Systems admin |
60-80% Systems admin |
50-60% Systems admin |
20-50% Systems admin |
80-100% Community partners and community-driven processes ideally generate new value and resources that can be invested in solutions |
| 10-30% Promotions and publicity |
20-40% Consultation activities |
40-50% Community involvement |
50-70% Community partners |
NOTE: MOU = memorandum of understanding.
SOURCE: Gonzalez, 2019.
ciples of Environmental Justice to build community partnerships. Both documents were created by individuals who have been disproportionately affected by toxic chemical exposure and economic hardship, which often occur in conjunction. The principles in the documents inform organizations on how they might hear directly from the interested and affected parties with whom they seek partnerships.
There is solid evidence that community engagement can improve health and social outcomes, particularly for disadvantaged communities, although which model of engagement is most effective can vary (Cyril et al., 2015; Haldane et al., 2019; Milton et al., 2012). Honesty and agreement are necessary parts of the choice of an appropriate model of community engagement for issues being addressed. These agreements need to be honored throughout the lifetime of the tool and need to be in place before development begins. It is also possible for engagement to move through the spectrum in a nonlinear pattern as stakeholders and priorities change. However, the goal is to move toward the highest level of community participation possible.
ACHIEVING TRUST, TRANSPARENCY, AND LEGITIMACY
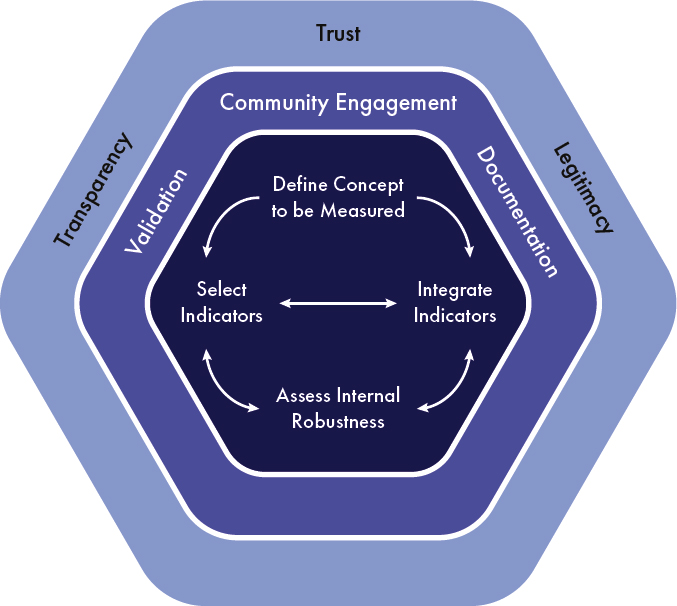
The 10-step guide to indicator construction described earlier in this chapter is a robust framework that outlines the important elements of indicator construction. Validation is a part of that framework, but what is less explicit in it is that EJ tools such as CEJST need to embody trust, transparency, and legitimacy that can only be achieved through iterative community engagement and validation of tool indicators, data, processes, and results. The committee has reimagined the 10-step guide in a conceptual framework to explicitly incorporate those concepts (see Figure 3.2). The framework consists of three rings:
- The innermost ring represents composite indicator construction. This includes processes that require multiple decisions, including defining the concept to be measured, selecting indicators, and determining how those indicators will be integrated. Importantly, these decisions need to be made using an iterative process in which decisions are evaluated, modified, and reevaluated for internal robustness.
- The middle ring represents the substantive and iterative community engagement, validation of indicators and tool results, and documentation of decisions and approaches that are all integral to the tool development process.
- The outermost ring recognizes that the entirety of the environmental tool development process needs to promote the transparency and legitimacy of the tool, leading to trust in its design, results, and use.
The conceptual framework in Figure 3.2 has guided the preparation of this report and its recommendations. Following a description of existing environmental screening tools in Chapter 4, Chapter 5 provides more information regarding the selection of indicators, Chapter 6 discusses the integration of indicators and the assessment of composite indicator robustness, and Chapter 7 addresses tool validation (and presen-
BOX 3.2
The Jemez Principles
In 1996, a diverse group of environmental justice advocates met in Jemez, New Mexico, and drafted the Jemez Principles for Democratic Organizing (Solis, 1997). In the decades since, the principles have been adopted by nonprofit and private organizations around the world. The principles, along with the Environmental Justice Principlesa developed during the First National People of Color Environmental Leadership Summit in 1991, are used as best practices when working with communities, particularly marginalized communities disproportionately affected by environmental and social injustices. Table 3.2.1 below is an overview of the Jemez Principles and provides example applications for EJ tools such as CEJST.
TABLE 3.2.1 The Jemez Principles
| Principle | Summary |
|
1. Be inclusive |
Ensure all stakeholders, especially those from disproportionately impacted and marginalized communities, are partners through the entire process, from inception to evaluations, also ensuring that these groups have power and decision-making authority. |
|
2. Emphasize bottom-up organizing |
Communities do not need to be organized. Communities organize themselves. Communities do not need to be saved. They need resources and power. Communities lead. |
|
3. Let people speak for themselves |
Communities are the experts in their lived experiences, and communities can and must speak for themselves. Pass the microphone. |
|
4. Work together in solidarity and mutuality |
Act with intentionality to ensure the intersectionality of issues and concerns, building trust between groups. Share resources and strategies. Collaborate to reflect the real-life continuum of issues, including economics to environmental, breaking down false silos. |
|
5. Build just relationships among ourselves; treat each other with justice and respect |
Treat everyone justly and with respect. Intentionally develop and sustain just relationships; committing to this process that will not be linear, or quick. Make space for the acceptance and utilization of different skill sets. |
|
6. Commit to self-transformation |
Commit to working in the community, decentering individualism, and centering community. Commit yourself to authenticity, self-improvement, and living a life of “justice,” “community,” and “peace.” |
__________________
a See https://comingcleaninc.org/assets/media/documents/ej4all-Principles2.pdf (accessed February 27, 2024).
tation). Although the committee was charged with providing recommendations to be incorporated into an overall data strategy for CEQ’s tool(s), the development of a data strategy in consideration of the conceptual framework resulted in recommendations that were more broadly applicable to EJ tools. Chapter 8 provides those recommendations.
CHAPTER HIGHLIGHTS
A composite indicator is used to represent a multidimensional concept or condition—for example, community disadvantage. Calculating a composite indicator brings together measurements from multiple dimensions of the concept (e.g., different aspects of community disadvantage) to determine a single value intended to reflect the condition being measured. Sound composite indicators are developed with a clearly defined purpose and intended audience and reflect real-world conditions. The validity of a tool rests on a foundation of scientific and methodological rigor, meaningful
participation and input from community members and other interested and affected parties, transparency, and acceptance by institutional actors (e.g., government agencies), communities, and other affected parties. Composite indicators can be constructed for a variety of purposes, for example, to screen for initial results, to directly inform decisions, or for educational purposes. Results derived from a tool can be binary (e.g., “is” or “is not”) or may provide a continuous measure or scale. CEJST is a binary tool intended to designate a community as disadvantaged or not based on selected criteria. Given that there is no quantitative definition or threshold for community disadvantage, there is a certain amount of subjectivity in creating a composite indicator. Composite indicator construction is multifaceted and value laden and is more than simply the result of formulas or statistics.
There are published, systematic methodologies for developing transparent, trustworthy, and legitimate composite indicators, and for evaluating their construction decisions, internal robustness, and external validity. Such methodologies consider a composite indicator as an interrelated system of steps or components for identifying the concept to be measured, selecting indicators and data, analyzing, normalizing, weighting, and aggregating the data, evaluating the results for coherence and validity, and presenting the resulting information. The methodologies provide iterative processes for making decisions about each of those components, evaluating them for coherence with the composite indicator’s purpose, and validating that they reflect the real world. Community engagement is an important aspect of composite indicator and tool validation.
Effective community engagement is a means to collect community lived experience and to understand how composite indicator-related decisions can be informed by those experiences. It can also inform how composite indicator-related decisions might affect communities through the use of the resulting tool. Community engagement could be used, for example, to inform composite indicator constructors regarding the use of aggregated data, such as U.S. Census data, to define communities. A census tract may generalize data over too broad an area and may not reflect the lived experiences of a community within the tract. Community engagement could be used to identify when census tracts may or may not be appropriately used or what might be used instead. Effective community engagement is part of a comprehensive composite indicator construction process that not only validates approaches used in the composite indicator but can also result in trust in the tool and improved outcomes. Recognizing the importance of community engagement in composite indicator construction, the committee developed a vision for EJ tool development (Figure 3.2). The conceptual diagram has as its foundation a systematic methodology for composite indicator construction but explicitly recognizes the value of communication through community engagement, validation, and documentation. These components serve to build a tool that embodies trust, transparency, and legitimacy.
This page intentionally left blank.


