Constructing Valid Geospatial Tools for Environmental Justice (2024)
Chapter: 2 Background and Definitions
2
Background and Definitions
The White House Council on Environmental Quality’s (CEQ’s) Climate and Economic Justice Screening Tool (CEJST)1 was designed to screen for communities that qualify for extra consideration for investment under the Justice40 Initiative.2 Because definitions of the terms associated with identifying disadvantaged communities and economic justice vary depending on the context, this chapter provides definitions of terms as used in this report from climate and economic justice perspectives. The definitions of community and community disadvantage are described, including the types of exposures that lead to that disadvantage. This is followed by some reasons for disproportionate exposure, and definitions for burdens, stressors, and impacts. Because a community is rarely disadvantaged as the result of a single stressor, the concept of cumulative impacts is also introduced here. The chapter concludes with a discussion of how the magnitudes of individual stressors, the presence of multiple stressors, and the interaction across stressors might be considered contributors to disadvantage. A discussion of how different measures may be incorporated into geospatial environmental justice (EJ) tools is provided in Chapter 5.
COMMUNITY AND COMMUNITY DISADVANTAGE
Community is defined as a group of people who share common experiences and interactions. While traditionally associated with specific places (i.e., geographic communities)—such as a neighborhood, town, city, or region—more general definitions decouple community from geography. Communities can exist at multiple scales— from local to global—and places can exist without community (Bradshaw, 2008).
___________________
1 See https://screeningtool.geoplatform.gov/en/ (accessed December 15, 2023).
2 Information on Justice40 can be found on the White House’s website, https://www.whitehouse.gov/environmentaljustice/justice40/ (accessed December 15, 2023).
Communities can also be more loosely coupled with geography. Examples include people who move from place to place, such as migrant and seasonal farmworkers, and people who identify as lesbian, gay, bisexual, transgender, queer (or questioning their gender), intersex, asexual, (or their allies) (LGBTQIA+) who share experiences and interactions with others who live in disparate locations.
Residential location often defines the proximity of a geographic community due to the importance of homes in anchoring social networks, activities, and exposure to environments. A geographic community often corresponds to what is generally referred to as a neighborhood in a city or town, although the geographic extent can vary depending on the location and context: neighborhoods tend to be compact in dense urban settings and more geographically extensive in rural areas. While the Justice40 Initiative recognizes both nongeographic and geographic communities, geospatial tools such as CEJST
BOX 2.1
What Is Redlining?
Redlining refers to the discriminatory practice of conditioning access to mortgage lending and insurance on the racial composition of neighborhoods. To address housing price collapses and a foreclosure crisis in the wake of the Great Depression, the Roosevelt Administration transformed housing finance from short-term loans with balloon payments to fully amortized longer-term loans. The Federal Housing Administration (FHA) introduced mortgage insurance and associated underwriting guidelines. The Federal National Mortgage Insurance Agency created a secondary loan market, and the Federal Home Loan Bank Board (FHLBB) chartered and oversaw federal savings and loan associations.
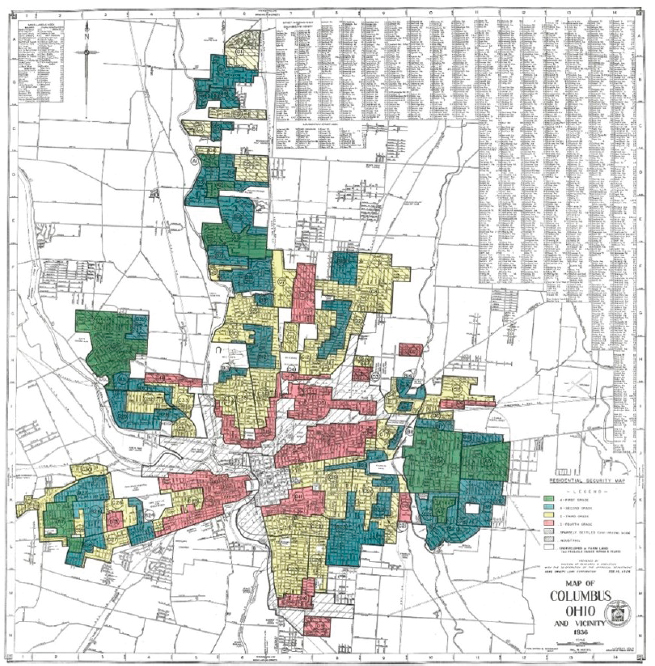
The Home Owners’ Loan Corporation (HOLC), created in 1933 as an agency operating under the FHLBB, was charged with assessing the relative riskiness of lending in neighborhoods in more than 200 U.S. cities (Aaronson, Hartley, and Mazumder, 2021). Between 1935 and 1940, HOLC developed a series of neighborhood descriptions with color-coded maps summarizing mortgage lending risk. The HOLC maps gave grades of A, B, C, and D to neighborhoods reflecting increasing estimated risk; the neighborhoods on the corresponding maps were colored green, blue, yellow, and red, respectively (Fishback et al., 2020). Black households were disproportionately concentrated in “D” or “redlined” neighborhoods and considered hazardous for mortgage lending. HOLC shared these with the FHA, which had already woven racial segregation into the provision of mortgage insurance (Mallach, 2024). There is also (disputed) evidence of the sharing of these maps with private lenders, although that was not official policy (Aaronson et al., 2021). The Mapping Inequality project at the University of Richmond maintains an online collection of georeferenced HOLC maps across the United States (https://dsl.richmond.edu/panorama/redlining/), which allows users to interactively explore these historic residential security maps for over 200 cities across the country. Figure 2.1.1 shows a 1936 HOLC map for Columbus, Ohio.
may only identify geographically proximate communities. Justice40 also considers geographic areas within Tribal jurisdictions to be communities of interest (EOP, 2023).
Because of their physical proximity, those in a geographic community may be both positively and negatively influenced by common forces. Neighborhood effects refer to these shared influences on individual social, economic, and health outcomes; these stem from the interactions and exposures among individuals and with the physical and built environments (Dietz, 2002; Diez Roux and Mair, 2010). Geographic communities may also be influenced by the policies and situations that establish, sustain, and otherwise impact the social determinants of health. In the case of these political determinants of health, both action and inaction are considered to have impacts and outcomes. Examples of political determinants include public and private policies, such as redlining (see Box
2.1), mortgage insurance, racially restrictive covenants, and exclusionary zoning, which have led to disinvestment and disadvantage (Dawes, 2020).
Defining community disadvantage is akin to the “wicked problems” that often face policy and planning decisions (Rittel and Webber, 1973); it is multifaceted and value-laden with intricate interdependencies that make it hard to describe comprehensively. The precise definition may shift depending on the problem context and lens brought to bear on the issue. Nevertheless, there are scientific principles and empirical evidence that provide a foundation for operational and actionable definitions of community disadvantage and related concepts.
Community disadvantage results from a complex interplay of factors that inhibit or prevent people in some communities from achieving the positive life outcomes that are commonly expected in a society. These factors include the social, economic, built, and natural environments in which they live (Price-Robertson, 2011). Traditional conceptualizations and measures of community disadvantage focus solely on economic disadvantage (e.g., poverty and unemployment), pointing directly to redistributive and workforce development policies. Multifaceted approaches, including social capital, financial capital, resources and social inclusion/exclusion, capture more of the complex interplay of factors (Price-Robertson, 2011). Factors that influence community resilience and disadvantaged status are rooted in world and national history. These factors go back centuries, European colonization, the transatlantic slave trade, capitalism and patriarchy took hold in what we now call the United States, as Europeans began colonizing and trafficking enslaved individuals (Berberoglu, 1994; Tarlow, 2024).
The social capital approach (e.g., Putnam, 2000) focuses on the social norms and networks in a community and the neighborhood and place effects that encourage or inhibit strong norms and networks. The social inclusion/exclusion approach (e.g., the UK Indexes of Multiple Deprivation; see Deas et al., 2003) focuses on individuals in a community and the barriers they face. Building on the work of economist Amartya Sen and philosopher Martha Nussbaum, the capabilities approach views disadvantage as restrictions on the ability to take actions and participate in activities that have meaning and value to people. The latter approach is comprehensive across the human experience, including lifespan, health and wellness, bodily autonomy, and integrity and control over one’s environment (Price-Robertson, 2011).
Community disadvantage is also a consequence of structural factors and historical processes that create conditions undermining resilience to shocks and disruptions, such as those associated with climate change, economic transitions, or other social and environmental pressures. One major factor is marginalization; it occurs when people are excluded from mainstream social, economic, educational, or cultural life based on personal attributes or history. Examples include, but are not limited to, groups excluded due to racial identity, gender identity, sexual orientation, age, disability status, language, or immigration status (Sevelius et al., 2020). Marginalized people are frequently segregated into specific geographic communities due to sorting based on ability to pay for housing and as a result of discriminatory practices such as racially restricted covenants and exclusionary zoning (Galster and Sharkey, 2017; Reardon and Bischoff, 2011; Rothstein, 2017; Shertzer, Twinam, and Walsh, 2022). Marginalization can also occur
due to economic and social changes resulting from market forces, often shaped by policy decisions; examples include rural areas losing population due to continuing urbanization and the loss of traditional economic bases in regions such as the U.S. Midwest and Appalachia. Another cause of marginalization is through displacement; examples include gentrification (Finio, 2022) and the forced movement and concentration of Native Americans (Farrell et al., 2021). Marginalized groups can form communities of safety from the intentional rejection of what is considered mainstream society. (Betts and Hinsz, 2013).
Disadvantaged communities can face lower levels of private and public capital investment, with detrimental impacts on personal and community resources and the built environment. In urban areas, the historic practice of redlining—the discriminatory practice of basing mortgage eligibility on racial identity—enforced segregation and deprived people of the ability to build personal wealth through homeownership and to transfer this wealth to subsequent generations (Aaronson, Hartley, and Mazumder, 2017; Faber, 2020; Fishback et al., 2021; Rothstein, 2017; Woods, 2012, 2013). Compounded with consequent poor-quality housing stock and infrastructure, these effects are profound and persistent: historically redlined neighborhoods are correlated with heat stress (Li et al., 2022; Schinasi et al., 2022; Wilson, 2020), air pollution (Bose, Madrigano, and Hansel, 2022; Cushing et al., 2023a; Lane et al., 2022; Schuyler and Wenzel, 2022), traffic violence (Taylor et al., 2023), lack of healthy food (Li and Yuan, 2022; Shaker et al., 2023), and a range of health disparities (Li et al., 2022) that persist to the present day.
DISPROPORTIONATE EXPOSURE TO ENVIRONMENTAL HAZARDS
Disadvantaged communities are disproportionately exposed to technological and natural environmental hazards. These hazards may include highways and railroads, extractive and industrial processes, natural hazards, and waste disposal sites (Di Fonzo, Fabri, and Pasetto, 2022; Donaghy et al., 2023; Johnston and Cushing, 2020; Johnston et al., 2020; Karas, 2015). The potential effects include increased exposure to harmful chemical or biological agents, poor air quality, noise, and disruptive events that undermine resilience. Marginalized communities are often located in places with such undesirable exposures, on floodplains, near industrial areas, or in neighborhoods that lack tree canopy and green space (Volin et al., 2020). Different reasons for disproportionate exposures can be placed into economic, sociopolitical, and racially discriminatory categories, described in the following paragraphs.
Economic Explanations
Economic explanations of disproportionate exposure to environmental hazards focus on market dynamics. The spatial concentration of environmentally hazardous facilities in areas that are predominantly composed of people of color and various socioeconomically disadvantaged communities is a consequence of market forces that encourage industries to look for inexpensive land and labor. Areas providing
inexpensive land and labor often coincide with neighborhoods where people of color and people with low income are more likely to reside. Additionally, after industrial facilities and other pollution sources have been sited, their negative impacts (e.g., air pollution, community targeting, and stigmatization) may decrease property values. Housing becomes more affordable in those areas for people of lower income. Market forces can thus result in greater in-migration of socially disadvantaged people in polluted communities and out-migration of socially advantaged people who can afford to move elsewhere (Saha and Mohai, 2005). Recent studies of the economic forces contributing to disproportionate exposure focus on how those forces affect residential location decisions (often referred to as “sorting”) and siting decisions by firms, as well as how these effects are shaped by discrimination (in markets as well as in policy and enforcement of regulations) (Banzhaf, Ma, and Timmins, 2019a,b; Cain et al., 2024). Some studies also recognize that markets themselves are inherently social and political constructs resulting from economic, social, and political power as well as initial resource allocations that can lead to persistent inequalities and stratification (Chelwa, Hamilton, and Stewart, 2022).
Sociopolitical Explanations
Sociopolitical explanations of disproportionate exposure to environmental hazards focus on the power relations and politics that drive unequal environmental outcomes. Specifically, communities with lower levels of educational attainment, voter participation, home ownership, social capital, and political clout are frequently targeted by industries seeking less local resistance to development (Bullard and Wright, 1987). Communities where opposition to industries will be minimal or less effective are also likely to contain higher proportions of people of color and low-income residents, including people with limited access to resources and political representation. The success of white “not-in-my-backyard” attitudes—often referred to as “NIMBYism”—has led to more hazardous waste sites, polluting industries, and other undesirable land uses in socially disadvantaged communities with the fewest number of resources to oppose such siting (Mohai and Saha, 2015).
Racial Discrimination Explanations
Scholars from multiple disciplines have long recognized racism as a fundamental cause of disadvantage and other social, economic, health, and environmental inequalities in the United States (Bonilla-Silva, 1997; Bullard, 2001; Callahan et al., 2021). Earlier scholarship and legal theory focused on interpersonal discrimination and questions of racist intent, but the focus has now shifted to understanding the role of historical and current institutional actions and structures that lead to racially unequal and discriminatory outcomes—referred to as systemic, institutional, or structural racism. While scholars increasingly differentiate these terms,3 this report uses the generic term
___________________
3 For elaboration on various theories of racism, see Dean and Thorpe (2022).
racism to refer to the phenomenon of structural racism. Following the definition offered by Bailey and others (2017), structural racism refers to “the totality of ways in which societies foster racial discrimination through mutually reinforcing systems of housing, education, employment, earnings, benefits, credit, media, health care, and criminal justice. These patterns and practices, in turn, reinforce discriminatory beliefs, values, and distribution of resources.”
Key to this conceptualization of racism is the understanding that systematic differences between racial and ethnic groups in socioeconomic status, wealth, education, political power, and health are a consequence of historical, social, institutional, or political circumstances and are not reflective of innate biological or cultural differences ascribable to race or ethnicity itself. Indeed, leading scholars across the disciplines of anthropology, sociology, public health, health care, and population genetics have been at pains to educate their peers in the scientific community and the public that race and racial categories are social and political constructs, and they are not coherent or credible biological categories. Differences between races are a consequence of racism, not race itself (Adkins-Jackson et al., 2022; Bailey et al., 2017; Boyd et al., 2020; Braveman et al., 2022; Lett et al., 2022; NASEM, 2023b; Payne-Sturges, Gee, and Cory-Slechta, 2021; Smedley and Smedley, 2005; Yudell et al., 2016).
Empirical Evidence of Racism as a Relevant Factor in Unequal Exposures and Outcomes
A large body of research demonstrates the association of race or ethnicity with disproportionate exposure to environmental stressors. Since its emergence in the early 1980s, EJ scholarship, in particular, has highlighted the central role of racism in explaining geographic and population-based patterns of unequal exposures to environmental stressors, including hazardous waste (e.g., Bullard et al., 2007; Mohai and Saha, 2007), air pollution (e.g., Bravo et al., 2022; Kodros et al., 2022; Lane et al., 2022), water pollution (Konisky, Reenock, and Conley, 2021; Martinez-Morata et al., 2022), toxic metals (e.g., Martinez-Morata et al., 2022; O’Shea et al., 2021), and noise (e.g., Collins, Nadybal, and Grineski, 2020; Trudeau, King, and Guastavino, 2023). Conversely, the same communities are shown to suffer disproportionately from the absence of various environmental and public amenities, such as access to recreational and open space (e.g., Fernandez, Harris, and Rose, 2021; Sims et al., 2022), access to affordable and healthy sources of food, adequate tree canopy coverage (e.g., Locke et al., 2021; Schwarz et al., 2015), functional public infrastructure (e.g., Kim, M. et al., 2023; Luna and Nicholas, 2022), and consistent or equal enforcement of environmental laws and regulations (e.g., Bae and Kang, 2022; Bae, Kang, and Lynch, 2023).
While some scholars have raised questions about the relative importance of race versus class or socioeconomic status (SES) in explaining these patterns, numerous investigations have repeatedly demonstrated that race is an important quantitative predictor of unequal exposure and outcomes, independently and sometimes more significantly than income or SES. Indeed, one common finding is that minoritized racial or ethnic groups within the same SES systematically experience greater exposures or
burdens relative to their white counterparts. The implication is that associations of exposure with race are not explained simply as a function of underlying SES differences, and SES is not a substitute for racial differences (see Bullard et al., 2007; Mohai and Saha, 2007; Liu et al., 2021; Tessum et al., 2021). At the same time, race and ethnicity are often highly correlated with various measures of SES, especially income and educational attainment, suggesting that race and ethnicity interact with SES in complex ways to produce these unequal exposures and outcomes.
Race is not equivalent to racism (Adkins-Jackson et al., 2022). While indicators of race and ethnicity are consistently associated with various forms of social, environmental, and health inequities, these indicators do not reveal the processes by which these inequities arise. Structural racism has emerged as a powerful theoretical framework for understanding and measuring the phenomenon of racism and its impacts, particularly in the population health sciences. Research on structural racism has drawn renewed attention to the utility of long-established sociological theories that racism is not a singular or separable phenomenon but rather intersects with other systems—economic, political, institutional—to produce and maintain racial inequalities in power, status, access to resources, and health (Bonilla-Silva, 1997; Du Bois, 1889; Massey, 1990). Health science scholars, schools of medicine and public health, and health organizations now explicitly recognize racism as a key social determinant of health and a fundamental cause of health inequities—e.g., asthma, cardiovascular diseases, cancer, diabetes, kidney disease, low-birth-weight pregnancies—many of which are also connected to differential exposures to environmental stressors (e.g., lead, air pollutants, hazardous waste, contaminated water) (Ahmed, Scretching, and Lane, 2023; Commission on Social Determinants of Health, 2008; Dean and Thorpe, 2022; Dennis et al., 2021; Paradies et al., 2015).
The interlocking systems of structural racism and their cascading effects on social and health inequities can be understood in consideration of the exclusion of Black people from housing and intergenerational wealth accumulation (Brown, 2022; Chadha et al., 2020). In the aftermath of the Reconstruction Era, Jim Crow laws throughout the former confederate states mandated racial segregation in all public facilities—including schools, public transit, and government buildings—and companion laws excluded Black people from voting and thus political representation (Daniels, 2020; Du Bois, 1935). Laws enforcing racial segregation and second-class citizenship remained in place through the mid-20th century, institutionalizing economic, educational, and other social disadvantages (Abrams, 1955; Jackson, 1987). It is important to understand that racist policies and practices were not confined to the South (Luxenberg, 2019; Purnell, Theoharis, and Woodard, 2019).
New Deal federal policies following the Great Depression institutionalized other forms of racial discrimination nationally. For example, the Social Security Act of 1935 created a system of employment-based old-age insurance and unemployment compensation, which has become a cornerstone of the country’s social safety net and dramatically reduced poverty among the elderly. However, to secure passage of the Act from southern Democrats, agricultural workers and domestic servants were excluded from the program, occupations held largely by Black men and women. Social Security
provided mostly white recipients with an opportunity to protect and pass on wealth to their children. By contrast, those who were excluded were not afforded this opportunity, forcing them to depend on their children in retirement, further diminishing the opportunity to pass on intergenerational wealth (Bailey et al., 2017; Omi and Winant, 2014). Other federal policies were more racially explicit.
As described in Box 2.1, discriminatory redlining practices had disproportionately negative impacts on communities of color. While the New Deal and immediate post-World War II periods witnessed a national expansion in homeownership and household wealth as a result of programs and policies to support homeownership, residents of redlined neighborhoods, especially Black residents, were effectively excluded from this opportunity for building intergenerational wealth, or even from moving out of segregated, inner-city neighborhoods (Aaronson, Hartley, and Mazumder, 2021; Faber, 2020; Rothstein, 2017). Although official redlining maps were ruled unconstitutional by the U.S. Supreme Court in the 1940s, the footprint of redlining has endured to the present day. Researchers have found that the locations of formerly redlined neighborhoods show strong correlations with a range of social, environmental, and health inequalities for the minoritized groups that live there (Aaronson et al., 2021; Berberian et al., 2023; Blatt et al., 2024; Bompoti, Coelho, and Pawlowski, 2024; Hoffman, Shandas, and Pendleton, 2020; Kephart, 2022; Lane et al., 2022). These persistent harms are compounded by persistent discrimination in the housing and rental markets (Howell and Korver-Glenn, 2021; Langowski et al., 2020).
Other federal policies aimed at supporting housing and wealth creation were similarly denied to Black people. Veterans returning from World War II in 1945 were entitled to G.I. Bill benefits, which provided free college and low-cost home and business loans to veterans and has been credited with lifting millions of veterans and their families into the middle class. Although Black veterans were technically entitled to these same benefits, local practices of housing and educational racial discrimination throughout the country meant that most were never able to use these benefits to secure quality housing, education, and the socioeconomic benefits that such advantages foster (Agbai, 2022; Lawrence, 2022; Meschede et al., 2022; Turner and Bound, 2002). Racial discrimination in housing was not outlawed nationally until 1968, and banks were not required to practice equitable lending until 1977.
Although housing discrimination based on race is illegal, research shows that it is still widespread and operates through both institutional and social mechanisms. Housing discrimination’s most visible manifestation is the persistence of racial residential segregation across the country (Massey, 2020). Scholars have identified residential segregation as a pillar in the foundation of structural racism and a direct contributor to racialized health inequities (Bailey et al., 2017). Residential segregation contributes to poor health outcomes by concentrating people of color in neighborhoods with dilapidated housing, substandard quality of the social and built environment, greater concentration of and exposure to pollutants and toxics, limited access to high-quality educational and employment opportunities, and restricted access to health care. Health outcomes associated with residential segregation include higher rates of adverse birth outcomes (Acevedo-Garcia et al., 2003), increased exposure to air pollutants (Bravo et
al., 2016; Lane et al., 2022; Smiley, 2019), less access to parks and greenspace (Kephart, 2022), shorter lifespans (Collins and Williams, 1999; Williams and Collins, 2001), increased risk of chronic disease (Acevedo-Garcia et al., 2003; Kershaw et al., 2011; Williams and Collins, 2001), and increased rates of homicide and other crime (Collins and Williams, 1999; Krivo et al., 2015).
Housing and employment have also been shown to intersect with disproportionate policing and incarceration of Black people (Chadha et al., 2020). The federal War on Crime policies that originated in the mid-1960s and peaked in the 1980s encouraged and supported more aggressive and punitive policing and was directed most heavily against communities of color through disproportionate incarceration and harsher sentencing for the same crimes committed by white people (Alexander, 2012; Bailey et al., 2017; Chadha et al., 2020; Hinton, 2016). Mass incarceration of people of color has had both direct and indirect effects on incarcerated individuals and their communities. In addition to the psychological and economic impacts on incarcerated individuals who face numerous barriers to securing housing and employment after returning to society, a toll is also taken on their families and communities. Disproportionate incarceration rates are both correlated with and predictive of a variety of community-level health inequities, such as adverse birth outcomes (Larrabee Sonderlund et al., 2022), demonstrating another system by which structural racism intersects with health and economic inequities (Bailey, Feldman, and Bassett, 2021; Dennis et al., 2021). Greater appreciation of historical and sociological understandings of racism, in conjunction with the adoption of the social determinants of health framework, is providing population and environmental health scholars with a growing array of conceptual tools to operationalize, measure, and document racism and its consequences.
Measuring Racism
There are numerous methods for operationalizing and measuring structural racism. In a systematic review of public health literature, Groos and others (2018) identified 20 research articles assessing structural racism across the domains of residential neighborhood/housing, perceived racism in social institutions, SES, criminal justice, immigration and border enforcement, political participation, and workplace environment. These studies found that structural racism was associated with mental and physical impacts, including stress, anxiety, poor psychological well-being, colorectal cancer survival, myocardial infarction, mean arterial blood pressure, episodic memory function, behavioral changes, poor adherence to hypertensive treatment, and delayed HIV testing across the population.
In a comprehensive and systematic review, Ahmed, Scretching, and Lane (2023) identified over 1,700 relevant peer-reviewed research articles and reviewed 54 of these in depth to understand the use of different designs, measures, and measurement indexes when studying structural racism as a social determinant of health. Among the 58 different measurable health outcomes in these studies, they found that infant health outcomes (e.g., preterm birth, low birth weight, infant mortality) and quality of life (e.g., dementia, disability patterns, years of life lost) were primarily affected by
structural racism, more than by other social determinants of health, such as educational attainment, employment, income, or access to health care. An array of chronic health conditions was also associated with structural racism, including cardiovascular disease, acute respiratory syndrome, body mass index, and late-stage diagnosis of cancer. Ahmed, Scretching, and Lane (2023) identified 73 measurement scales or indexes of structural racism. The most common scales of measurement were the Concentration of Extremes,4 the Dissimilarity Index (see Hammonds and Herzig, 2009; Kramer and Hogue, 2009; Pursch et al., 2020), the Everyday Discrimination Scale (see Commission on Social Determinants of Health, 2008; Dennis et al., 2021; Hardy-Fanta et al., 2006; Lukachko, Hatzenbuehler, and Keyes, 2014), the Experience of Discrimination Scale (see Alson et al., 2021; Commission on Social Determinants of Health, 2008; Dennis et al., 2021; Dougherty et al., 2020; Lukachko, Hatzenbuehler, and Keyes, 2014), the Five Segregation Scale (see Levac, Colquhoun, and O’Brien, 2010; Tester, McNicoll, and Tran, 2012), the Index of Race Related Stress (see Arksey and O’Malley, 2005; Chambers et al., 2020; Hammonds and Herzig, 2009; Hankerson, Suite, and Bailey, 2015), the Isolation Index (see Hammonds and Herzig, 2009; Hansen, 2015; Harnois et al., 2019), and the Perceived Racism Scale (Commission on Social Determinants of Health, 2008) Hankerson, Suite, and Bailey, 2015).
Reviews of the scientific literature have observed that measures of segregation, especially Black-white segregation, have been the most common indicators used to describe and model structural racism. This is not surprising given the ease of data availability and the well-documented association of residential segregation with environmental and health inequities (see, e.g., Bravo et al., 2016; Jones et al., 2014; Kodros et al., 2022; Kramer and Hogue, 2009; Morello-Frosch and Jesdale, 2006; Morello-Frosch and Lopez, 2006; Rice et al., 2014; Woo et al., 2019; Yitshak-Sade et al., 2020. More recently, scholars have argued that structural racism needs to be measured using an index method that better reflects its multidimensional nature (Adkins-Jackson et al., 2022; Dean and Thorpe, 2022; Furtado et al., 2023). However, there is currently no scientific consensus on the best way to measure structural racism (Ahmed, Scretching, and Lane, 2023). But rather than seeking consensus on one best way, Furtado et al. (2023) and Wien, Miller, and Kramer (2023) suggest that the appropriate measure of racism should be selected based on the context and specific question at hand, as well as the specific population of concern. Indeed, one of the common shortcomings identified in most measures of structural racism, including multidimensional indexes, is the reliance on Black-white indicators of racism and the implicit assumption that racialized experiences are the same for all minoritized racial and ethnic groups. That assumption is belied by the available evidence. For example, research by multiple independent research teams has documented how exposure to contaminated drinking water and unequal enforcement of Clean Water Act regulations across the country are most strongly associated with populations of Hispanic/Latino and American Indian/Alaskan Native residents across the South and Southwest, but not with populations of non-Hispanic Black residents
___________________
4 Also described as the Index of the Concentration of Extremes. See Feldman and Bassett (2021); Krieger et al. (1993); and Nyika and Murray-Orr (2017).
(Bae and Kang, 2022; Bae and Lynch, 2023; Konisky, Reenock, and Conley, 2021; Martinez-Morata et al., 2022).
In addition to problematic assumptions about a uniform racialized experience across racial and ethnic groups, intraethnic differences are also important. Marquez-Velarde (2020) disaggregated asthma prevalence data for Mexican Americans, separating foreign-born and U.S.-born, as well as Black Mexican Americans and white Mexican Americans, and found that Black Mexican Americans had a significant disadvantage in relation to both their white Mexican American counterparts and white non-Mexican Americans, suggesting that ethnic experiences are modified by race. Lett and others (2022) have raised similar concerns about treating “Hispanic” as a single ethnic category separable from race and lumping together “multiple, heterogeneous populations spanning dozens of countries and racial groups as well as highly variable socioeconomic, political, and cultural contexts.” They draw the example of research on “Hispanic health,” which would simultaneously refer to “groups of impoverished Guatemalan migrant workers of largely Indigenous origins as categorically equivalent to wealthier, whiter, Cuban U.S. citizens of significantly more European descent” (Lett et al., 2022, p. 160). Such an undifferentiated approach would provide limited utility in identifying health inequities and might possibly hide or erase important differences.
Similar critiques could be raised about other large and usually undifferentiated racial categories, such as “Asian,” which include peoples of vastly different cultural and historical experiences and economic strata, from China to Japan to India. Finally, but no less importantly, are the experiences of Indigenous populations, such as Native Americans, Alaskan Natives, and Native Pacific Islanders, all of whom are only infrequently disaggregated from “minority” or “people of color” (Balakrishnan et al., 2022). Although Indigenous populations have experiences that parallel those of other non-white, minoritized groups (e.g., higher rates of unemployment and poverty, disproportionate exposure to environmental burdens), the settler colonial structures that created these disparities are unique to them, and their concerns are land based and connected to issues of political sovereignty (Dennis et al., 2021; Wispelwey et al., 2023). Numerous researchers of structural racism argue that credible and useful measures of race and ethnicity, as well as racism, must take these differences into account by critically assessing how racial and ethnic categories are being conceptualized and by disaggregating racial and ethnic data in order to reflect these different experiences and their relation to disparities (Adkins-Jackson et al., 2022; Braveman et al., 2022; Casey et al., 2023; Dennis et al., 2021; Furtado et al., 2023; Lett et al., 2022; Payne-Sturges, Gee, and Cory-Slechta, 2021).
Research on health and environmental inequities has demonstrated that measures of racism are essential to identifying and understanding inequity. Within the health sciences, structural racism is identified as a fundamental cause of health inequities and a key element of the social determinants of health. Scholars advise that structural racism is best measured through a multidimensional index that reflects a theoretical understanding of the phenomenon of racism for a given domain or set of domains, institutional context, and population of concern. Appropriate measures of racism require proper conceptualization of and data on race and ethnicity. Properly collecting data on
race and ethnicity, and disaggregating racial and ethnic categories, is essential in order to monitor the state of racial or ethnic disparities, to properly identify differences in population experiences of racism and inequity, and to avoid perpetuating or exacerbating structural racism through the erasure of real differences between and within population groups (Adkins-Jackson et al., 2022; Braveman et al., 2022; Kauh, Read, and Scheitler, 2021; Polonik et al., 2023; Wang et al., 2022).
Please see Chapter 5 for further discussion of how to apply measures of racism in geospatial EJ tools.
Social Vulnerability
Disproportionate exposure stemming from economic, sociopolitical, and racial discrimination processes is not the only major mode of societal marginalization pertinent to environmental injustice. Some of the same populations experiencing persistent exposure and exclusion are also less resistant to its effects due to marginalization-induced social vulnerability. Social vulnerability arises due to combinations of political, economic, social, and institutional processes that reduce the capacity of individuals and groups to anticipate, cope with, resist, and recover from hazard impacts (Wisner et al., 2004). EJ research and activism have traditionally focused on marginalization at intersections with anthropogenic hazards, whereas social vulnerability scholarship and modeling have done so in the context of disasters and natural hazards (Ryder, 2017).
The groups facing persistently heightened adverse hazard impacts and outcomes are multiple and intersectional (Elliott and Pais, 2006; Kuran et al., 2020; see also Box 2.2 on intersectionality), extending beyond the common focus on socioeconomic status (Fothergill and Peek, 2004) to also include renters (Lee and Van Zandt, 2019), populations at extremes of age (Ngo, 2001; Peek and Stough, 2010), with limited English language proficiency (Santos-Hernández and Morrow, 2013), living with disability (Wisner, Gaillard, and Kelman, 2012; Chakraborty, Grineski, and Collins, 2019), racial and ethnic minorities (Fothergill, Maestas, and Darlington, 1999), federally subsidized housing residents (Chakraborty et al., 2021), and undocumented immigrants (Méndez, Flores-Haro, and Zucker, 2020). Starting in the 2000s, researchers began quantifying, modeling, and mapping social vulnerability by collecting demographic indicators reflective of sensitive populations and aggregating them into indexes (Clark et al., 1998; Cutter, Boruff, and Shirley, 2003). The aggregated index values reflect both multidimensionality and accumulation of social vulnerabilities across indicators. Social vulnerability indexes quantified processes that had been observed but rarely measured, enabling exploration of its spatial distribution across places (Emrich and Cutter, 2011; Nayak et al., 2018), temporal variation (Cutter and Finch, 2008), and intersection with an array of natural hazards (Schumann et al., 2024; Wu, Yarnal, and Fisher, 2002) and disaster impacts (Finch, Emrich, and Cutter, 2010).
The Social Vulnerability Index (SoVI) developed at the University of South Carolina (Cutter, 2024) was the first social vulnerability index to find widespread use in natural hazards research. SoVI applies principal components analysis to reduce more than two dozen indicators to a smaller number of statistical factors, which are aggregated
to create the index (Cutter, Boruff, and Shirley, 2012). The U.S. Centers for Disease Control and Prevention later developed an index also called the Social Vulnerability Index (SVI), which is based on an aggregation of roughly 15 indicators (see Chapter 4; Flanagan et al., 2018). The SoVI and SVI remain the dominant indexes of social vulnerability in the United States and have found utility as screening tools in planning and resource allocation in pre-disaster mitigation (Community Disaster Resilience Zones Act of 2022, Pub. L. No, 117-255; FEMA, 2022) and post-disaster assistance (Blackwood and Cutter, 2023; West Virginia Development Office, 2020). The major questions raised about social vulnerability indexes surround their fit for policy application (Hinkel, 2011), lack of stakeholder participation in their development (Preston, Yuen, and Westaway, 2011), stigmatization of people and places as inherently deficient (Marino and Faas, 2020), correlation with disaster outcomes (Bakkensen et al., 2017; Rufat et al., 2019), degree of statistical robustness (Schmidtlein et al., 2008; Spielman et al., 2020; Tate, 2012), and obfuscation of underlying vulnerability drivers (Greco et al., 2019). Such critiques can help guide the development of the newer field of composite indicators for EJ tools.
BURDENS, STRESSORS, AND IMPACTS
The concept of burden is included in nearly all definitions of disadvantaged communities. For example, the California Public Utilities Commission defines disadvantaged communities as “areas … which most suffer from a combination of economic, health, and environmental burdens. These burdens include poverty, high unemployment, air and water pollution, presence of hazardous wastes as well as high incidence of asthma and heart disease.”5 Burden is a widely used concept that indicates an activity or agent with negative consequences for human health and well-being. In other cases, burden refers to the impacts themselves (i.e., outcomes experienced by individuals), which stem from a combination of exposures and barriers. Under the latter use of the term, for example, excessive heat can be an exposure for an entire population of a given location but might only be a burden for those without the ability to escape the heat (e.g., those without access to air-conditioned space).
An alternative terminology that emphasizes the distinction between causes and effects is stressors and impacts. Following Tulve and others (2016), the U.S. Environmental Protection Agency’s Office of Research and Development (ORD) defines stressors as “any physical, chemical, social, or biological entity that can induce a change (either positive or negative) in health, well-being, and quality of life (either now or into the future)” (EPA, 2022a). More broadly interpreted, stressors can encompass both exposures and preexisting conditions that can lead to (cause) impacts (or burdens) either by themselves or when combined. For example, asthma or heart disease would lead to negative health impacts when suffered alone and even more so when combined with
___________________
5 See https://www.cpuc.ca.gov/industries-and-topics/electrical-energy/infrastructure/disadvantaged-communities#:~:text=Disadvantaged%20communities%20refers%20to%20the,of%20asthma%20and%20heart%20disease (accessed September 15, 2023).
other stressors such as exposure to high levels of particulate matter. Similarly, poverty negatively impacts well-being both by itself and even more so when combined with environmental exposures. On the other hand, given the disproportionate impact on certain age groups (e.g., children or the elderly) of exposures such as lead or excessive heat, age might be a stressor when combined with these exposures (other stressors) even though it would not be viewed as a stressor by itself. All of these would fall under a broad interpretation of the term stressor.
The magnitude of a stressor is the quantity, size, or degree of the stressor. This dimension can also capture the difference between temporary exposure and long-term (e.g., lifetime) exposure, as well as the potential for increased future exposure (due, for example, to climate change). For example, being exposed to a given stressor for a longer period can lead to a larger total (cumulative) burden, especially when impacts exhibit threshold effects or nonlinearities. Data reported as continuous values—either in raw form as absolute values or in relative measures such as percentiles, rankings/ratings, or continuous indexes—provide information about the magnitude (or relative magnitude) of a given stressor, allowing for variation across communities in the measured level of burden. By contrast, data reported simply based on exceeding a threshold (in the form of a binary variable of “above” or “below”) allow for only a very crude representation of impact that does not distinguish among different levels of impact in the “above” or “below” categories. A community that is only very slightly above the threshold is viewed as being identical to one that is far above the threshold, and vice versa. The implication of this approach is an underestimation of the burden impact of the stressor for groups that have relatively high or extreme magnitudes of exposure.
MULTIPLE STRESSORS
Many EJ studies examine impacts based only on single environmental stressors. Examples include investigating proximity to landfills (Commission for Racial Justice, 1987), accidental releases of hazardous substances (Chakraborty et al., 2014), exposure to air pollutants (Collins, Grineski, and Nadybal, 2022), disaster impacts (Bullard and Wright, 2009; Chakraborty, Collins, and Grineski, 2019), tree canopy coverage (Landry and Chakraborty, 2009), extreme heat exposure (Mitchell and Chakraborty, 2019), occupational exposure (Arcury, Quandt, and Russell, 2002; Carrillo and Ipsen, 2021), and accessibility to healthy food (Alkon, 2018). This single-stressor approach is also prevalent in quantitative risk assessments that examine the health effects of environmental exposure or toxins. A principal critique of this approach is that it fails to reflect concurrent and compounding impacts faced by many communities (Sadd et al., 2011). Capturing the combined impacts of multiple stressors requires transitioning beyond a single-media, single-location (e.g., residential, workplace), and single point-in-time analysis; this is difficult but crucial (Huang and London, 2016).
Capturing the combined impacts of multiple stressors requires considering the magnitude of individual stressors, the presence of multiple stressors, and interactions among the stressors. Typical approaches to accounting for these factors include count, intersection, or aggregation methods. The following discussion provides an overview;
BOX 2.2
Intersectionality
Exposure and resilience to environmental burdens differ for individuals and population groups along a variety of social dimensions, including race, ethnicity, class, gender, disability status, age, immigration status, indigeneity, sexual orientation, or identity, and other demographic or identity characteristics (Goldsmith, Raditz, and Méndez, 2022; Méndez, Flores-Haro, and Zucker, 2020). Within the broad scholarship on environmental justice, race and class have dominated discussions about the underlying demographic factors that explain or predict environmental inequalities, sometimes as competing theories about causation. Indeed, the racial and class characteristics of communities are both predictors of a wide variety of environmental disparities, independently and in tandem. However, other socio-demographic characteristics beyond race and class can aid in understanding differences in risk or vulnerability.
Significant gender power imbalances due to custom, culture, or law mean that environmental vulnerabilities and adaptive capacities are mediated by gender, often placing women and girls at a systematic disadvantage and greater risk (Denton, 2002). For example, gender-based differences in mortality from natural hazards have been described, with women exhibiting a lower life expectancy than men (Neumayer and Plümper, 2007). Some risk exposures are unique to women, such as exposure to toxins in female beauty products (Collins et al., 2023; McDonald et al., 2022; Storr, 2021) or complications during pregnancy (Giarratano et al., 2015), while other risks are not gender-specific but nevertheless have differential impacts. Risks such as climate change are likely to exacerbate existing gender-based inequalities (Huyer et al., 2020; Vinyeta, Whyte, and Lynn, 2015).
Disability status is another dimension of both marginalization and vulnerability. In addition to heightened physical susceptibility to environmental risks, disabled individuals face numerous societal barriers to inclusion and participation in decision making which result in reduced access to education, health services, employment, and resulting poverty and lower levels of information and resources (Kosanic et al., 2022). Recent studies also indicate how people with disabilities are disproportionately exposed to various environmental hazards and pollution sources, compared to the non-disabled population (Chakraborty, 2019, 2020, 2022). The evidence suggests that individuals with disabilities often experience a ‘multiple jeopardy’ de-
fined by the convergence of disability status with other social disadvantages such as racial/ethnic minority, poverty, and elderly status, to amplify their vulnerability to environmental risks (Chakraborty, 2020).
Finally, age is a significant factor affecting vulnerability and exposure. Children are more sensitive than adults to toxins, such as lead, and the long-term developmental impacts are more consequential (McFarland, Hauer, and Reuben, 2022; Lu, Levin, and Schwartz, 2022; Schneider, 2023). At the other end of the age spectrum, older adults and the elderly are often more vulnerable to disasters or extreme weather events. Chronic health conditions, reduced sensory or cognitive capacity, coupled with commonly lower socioeconomic status can mean lower resilience and greater need for support or assistance for older adults and the elderly (Phraknoi et al., 2023).
The intersection of these identities or socio-demographic characteristics is also important. While race and class have often been examined in isolation, their intersection (i.e., lower income, non-white communities) identifies an important sub-population that faces unique challenges. The same logic can be extended to other dimensions of identity. The intersection of marginalized identities means that these individuals or populations may be oppressed or differentially affected by a combination of interconnected societal structures—racism, sexism, ableism, ageism, etc. (Crenshaw, 1991; Ryder, 2017). While women are at heightened risk of exposure to toxins in beauty products due to societal pressures and expectations of femininity, as well as historic lack of governmental regulation of the cosmetics industry, women of color who have lower income are more likely to consume more products with higher levels of toxicity as a result of both social expectations of femininity and the compounding pressures to conform to white standards of beauty (e.g., using harsh chemicals to lighten their skin or straighten their hair), and less awareness or access to safer alternatives (Collins et al., 2023; McDonald et al., 2022; Storr, 2021). Disability can further exacerbate vulnerabilities of race/ethnicity, income, gender, and age (Chakraborty, 2020; Jampel, 2018). While all women are at heightened risk of sexual violence, the risk of experiencing sexual violence is heightened during disasters or disruption, and even more so for women with disabilities who are displaced or forced to reside in shelters. Children with disabilities are more likely to be left homeless after a disaster (Kosanic et al., 2022). The intersectionality of identity and its impacts on exposure and vulnerability is an important factor in understanding how risk and burdens vary both between and within population groups.
Chapter 4 discusses these approaches in practice through a scan of existing EJ tools and their methods.
Count methods simply count the presence or number of stressors, typically based on threshold data and the number of thresholds exceeded. The intersection approach is an extension of the count method for capturing interactions among stressors: a given stressor creates a burden for a community only if a second stressor is also present. Thus, under this approach, total impact is measured by meeting thresholds for both stressors. For example, to be designated as disadvantaged, a community would have to meet a threshold for both income and an environmental indicator or composite measure. This is a binary conceptualization: the community meets the thresholds for multiple stressors or does not.
By contrast, aggregation methods use mathematical or statistical methods to combine the individual stressors into a single number. Aggregation methods capture variations in stressor magnitudes into the summary measure rather than simply presence versus absence, as in count and intersection methods. In addition, aggregation methods capture the magnitude of interactions among stressors. Typical aggregation approaches include addition and multiplication. An additive approach conceptualizes interactions as being linear: the combined impact is the sum of the individual stressors; they accumulate but do not directly interact to create synergistic impacts. The multiplicative approach is nonlinear and captures direct, synergistic impacts among stressors: the whole impact is greater than the sum of the individual stressors. It is also possible to use a hybrid approach in which some stressors interact additively and others in a multiplicative manner. Statistical methods include correlation, regression, and principal components/factor analysis. The individual stressors can be weighted equally or unequally to reflect their relative importance or impacts (Gan et al., 2017).
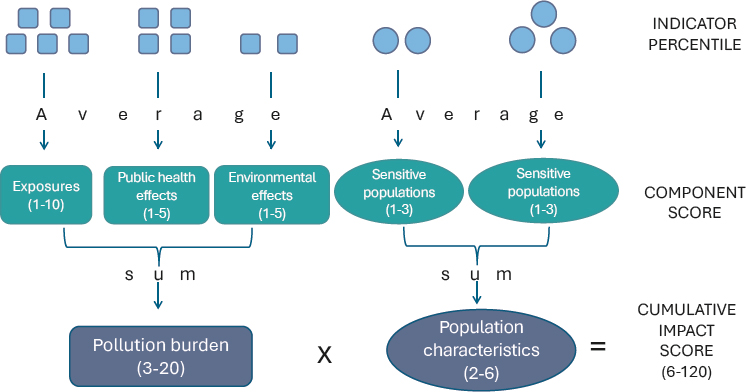
Simplicity and legibility are important considerations for analytical approaches to capturing multiple stressors, especially when conducting stakeholder and community engagement (NRC, 2009; Solomon et al., 2016). August and colleagues (2012) provide an example of an analytical framework for measuring the impacts of multiple stressors in a clear and transparent manner, in this case, pollution; Figure 2.2 provides a graphic illustration. Individual indicators are averaged into groupings of related indicators such as exposures, public health and environmental effects of the exposures, sensitive populations, and socioeconomic factors. These in turn are summed into the higher-level components of pollution burden or population characteristics. Note that these higher-level components are combined in a multiplicative manner, meaning that, for example, lower pollution burdens cannot compensate for less vulnerable population characteristics such as lower sensitivity and/or higher SES. As such, this framework is both linear and synergistic, reflecting one model of interrelationships among social and environmental burdens, and how the population characteristics modify their effects (Solomon et al., 2016). This hierarchical arrangement is intended to support clear thinking and understanding about how the indicators should be combined; but it is not intended as a causal model. As discussed in Chapter 3, this is a common approach to constructing an indicator for multidimensional concepts.
The interplay of multiple stressors interacting with sociodemographic, environmental, occupational, and public health factors leads to the possibility of the total impacts
being greater than the sum of the individual stressors. Because of these synergistic effects, capturing cumulative impacts is crucial for a comprehensive assessment of community disadvantage.
There is a lingering knowledge gap in the understanding of the interactions among stressors, especially causal relationships, but this understanding can inform how to capture the cumulative impacts facing a community (EPA, 2022a). What is not well understood, for example, is if the impact of multiple stressors on populations is akin to the sum of their individual effects, or if the total burden occurs through synergism in which stressors and populations interact and amplify one another and result in greater cumulative impacts. In addition, understanding is limited regarding the effects of long-term exposure to stressors where effects accumulate over time. Although additional empirical research is necessary to fill these gaps, it is challenging to develop completely specified process models of these interactions, especially for nonchemical stressors. Possible paths forward include data-driven models that leverage novel data sources and mixed-method approaches (discussed further in Chapter 7; Schäfer et al., 2023, Shamasunder et al., 2022).
CUMULATIVE IMPACTS
As noted, the concept of cumulative impacts includes both a temporal component (i.e., the accumulation of impacts over time through persistent exposure) and a contemporaneous component due to the presence of multiple stressors. To date, the focus of EJ work on cumulative impacts has been on the latter component, attempting to incorporate into EJ tools the understanding that communities that face multiple stressors are more burdened than those facing a single stressor (e.g., Popovich et al., 2024). However, efforts such as Justice40 are typically predicated on concerns about “historic” underinvestment that has led to disproportionate burdens that have accumulated over time. In addition, burdens faced by communities can change over time, potentially either increasing or decreasing, due to a variety of factors such as investment/disinvestment or environmental, political, or social crises or changes (including, for example, disastrous environmental accidents or epidemics). Thus, although much of the discussion of cumulative impacts in the EJ community as well as the discussion in this report focuses on the presence of multiple stressors, a dynamic perspective on the accumulation of and changes in impacts over time is critical for fully capturing the cumulative burden faced by communities.
Because of its complexity, defining and measuring cumulative impacts have evolved over time. Leaders in the EJ community and federal and state policy makers have developed definitions of cumulative impacts to guide scientific investigations, policies, and agency guidance. The earliest identified definition of cumulative impacts comes from the California Environmental Quality Act of 1970:
… two or more individual effects which, when considered together, are considerable or which compound or increase other environmental impacts… . The cumulative impact from several projects is the change in the environment which results from the
incremental impact of the project when added to other closely related past, present, and reasonably foreseeable probable future projects. Cumulative impacts can result from individually minor but collectively significant projects taking place over a period of time (CalEPA, 2004; EPA, 2022a).
Federal government definitions of cumulative impacts date back to 1978 when the CEQ published implementing regulations for the 1969 National Environmental Policy Act (NEPA), which defined cumulative impacts as:
… the impact on the environment which results from the incremental impact of the action when added to other past, present, and reasonably foreseeable future actions regardless of what Agency (federal or non-federal) or person undertakes such other actions. Cumulative impacts can result from individually minor but collectively significant actions taking place over a period of time (CEQ, 1978).
Some states—including California, Hawaii, Illinois, Maryland, Massachusetts, Minnesota, New Jersey, New York, Vermont, and Washington—have introduced or enacted legislation that includes cumulative impacts. Several of the states listed above—as well as Michigan, New Mexico, and Oregon—have reports or mapping tools that include cumulative impacts. Scientific definitions of cumulative impacts span disciplines such as public health, toxicology, environmental science, geography, and planning (Tishman Environment and Design Center, 2022). The collaborative nonprofit, Coming Clean, Inc., and its strategic partner, the Environmental Justice Health Alliance for Chemical Policy Reform, define cumulative impacts as the combination of nonchemical and chemical stressors on health, quality of life, and well-being. This definition was created by communities, researchers, health care workers, lawyers, and other EJ advocates (Coming Clean, Inc., n.d.).6
A web tool by the Tishman Environment and Design Center at The New School provides a timeline, summaries, and links to federal and state government reports, tools, and legislation and to scientific journal articles that define, explicitly or implicitly, the concept of cumulative impacts and the indicators and thresholds used to measure cumulative impacts. Table 2.1 provides example definitions of cumulative impacts. These definitions do not represent a comprehensive list but rather are selected to illustrate features of cumulative impacts that will be critical to this report.
The definitions in Table 2.1 commonly emphasize multiple environmental stressors across natural, built, and social environments and encompass where people live, work, play, and pray (Bullard, 2001). The Collaborative definition is rooted in the lived experiences of the communities that compose the Environmental Justice Health Alliance for Chemical Policy Reform. Chemical stressors damage organisms and ecosystems from the release of pollutants into the environment through activities such as waste treatment and disposal, manufacturing, natural resource extraction, energy production, transportation, and agriculture. Chemical stressors have historically been the focus of one kind of
___________________
6 Coming Clean, Inc., “Cumulative Impacts and Mandatory Emissions Reductions Team” https://comingcleaninc.org/projects/ci-mer (accessed December 18, 2023).
TABLE 2.1 Example Government Agency Definitions of Cumulative Impacts and Effects
| Entity | Definition | Source |
|---|---|---|
| Federal government definitions | ||
| Council on Environmental Quality (CEQ) | Exposure to one or more chemical, biological, physical, or radiological agents across one or more media (e.g., air, water, soil) from one or more sources over time in one or more locations that have the potential for deleterious effects on the environment and/or human health. | CEQ (1997) |
| National Environmental Justice Advisory Council | The interaction among multiple stressors within a population or community where individuals differ based on susceptibility, exposure, preparedness, and resilience (ability to recover) | NEJAC (2004) |
| U.S. House of Representatives | Any exposure to a single or multiple public health or environmental risk in the past, present, and reasonably foreseeable future occurring in a specific geographical area, taking into account sensitive populations and other factors that may heighten vulnerability, including socioeconomic characteristics. | H.R.2021 - Environmental Justice for All Act (U.S. Congress, House, 2021) |
| U.S. Senate | Similar to H.R.2021 | S.2630—Environmental Justice Act of 2021 (U.S. Congress, Senate, 2021) |
| U.S. Environmental Protection Agency | The totality of exposures to combinations of chemical and non-chemical stressors and their effects on health, well-being, and quality of life outcomes throughout a person’s lifetime, encompassing both direct and indirect effects through impacts on resources and the environment, accounting for the context of individuals, geographically defined communities, or definable population groups. Cumulative impacts reflect the potential state of vulnerability or resilience of a community. | EPA (2022) |
| State government definitions | ||
| California Environmental Protection Agency | Cumulative impacts are: exposures, public health or environmental effects from the combined emissions and discharges, in a geographic area, including environmental pollution from all sources, whether single or multi-media, routinely, accidentally, or otherwise released. Impacts will take into account sensitive populations and socioeconomic factors, where applicable and to the extent data are available. | CalEPA (2010) (definition adopted in February 2005) |
| Formula for estimating relative cumulative impact among communities: | ||
| Cumulative Impacts = [Exposures + Public health effects + Environmental effects] × [Sensitive populations + Socioeconomic factors] | ||
| Entity | Definition | Source |
|---|---|---|
| State of California | Two or more individual effects which, when considered together, are considerable and compound or increase other environmental impacts. These effects may be from single or multiple sources (“projects”) in the past, present, and reasonably foreseeable probable futures. | California Environmental Quality Act (CEQA), as codified in Cal. Code Regs. Tit. 14, § 15355—Cumulative Impacts |
| State of Vermont Senate | The cumulative impacts of environmental harms disproportionately and adversely impact the health of BIPOC and communities with low income, with climate change functioning as a threat multiplier. These disproportionate adverse impacts are exacerbated by a lack of access to affordable energy, healthy food, green spaces, and other environmental benefits. | S.148—An Act Relating to Environmental Justice in Vermont (Vermont State Legislature, 2022) |
| State of Washington Senate | “Environmental harm” means the individual or cumulative environmental health impacts and risks to communities caused by historic, current, or projected | SB5141—The Healthy Environment for All Act (Washington State Legislature, 2021) |
| (a) exposure to pollution, conventional or toxic pollutants, environmental hazards, or other contamination in the air, water, and land | ||
| (b) adverse environmental effects, including exposure to contamination, hazardous substances, or pollution that increase the risk of adverse environmental health outcomes or create vulnerabilities to the impacts of climate change | ||
| (c) loss or impairment of ecosystem functions or traditional food resources or loss of access to gather cultural resources or harvest traditional foods | ||
| (d) health and economic impacts from climate change. | ||
| Scientific definitions | ||
| K. Sexton and S. H. Linder, 2011 article in American Journal of Public Health | Combined threats from multiple environmental stressors. Uses the concept of allostatic load to characterize the cumulative biological toll taken on the human body through physiologic responses to life’s everyday stress-provoking demands. Notes that exposure to multiple environmental agents, including biologic, chemical, physical, radiologic, and psycho-social stressors, can result in outcomes that are either antagonistic (less than additive) or synergistic (more than additive) | Sexton and Linder (2011) |
| Entity | Definition | Source |
|---|---|---|
| G. M. Solomon, R. Morello-Frosch, L. Zeise, and J. B. Faust, 2016 article in Annual Review of Public Health | Identifies four key concepts that underlie composite indicator: i) Health disparities are linked to social and environmental factors for many diseases; ii) Inequalities in exposures to environmental hazards are significant; iii) Intrinsic biological and physiological factors can modify the effects of environmental factors; iv) Extrinsic social vulnerability factors at the individual and community levels may amplify the effects of environmental hazards | Solomon et al. (2016) |
| Collaborative (Community and advocates) definition | ||
| Coming Clean Inc. and the Environmental Justice Health Alliance for Chemical Policy Reform | The combination of non-chemical and chemical stressors on health, quality of life, and well-being. | Coming Clean, Inc. (n.d.) |
SOURCE: Based on Tishman Environment and Design Center, 2022.
cumulative risk assessment due to greater data availability and alignment with regulatory frameworks (Lewis et al., 2011). Nonchemical stressors include lifestyle health hazards, weather extremes, poverty, racial discrimination (policy and institutionalized practices), and crime (Bullard, 2001; Morello-Frosch et al., 2011).
Another common theme in Table 2.1 is environmental stressors accruing to vulnerable populations, labeled as “definable” by the EPA and “sensitive” by CalEPA (2010). The separation of stressors, exposures, and aggravating effects (such as public health and environmental conditions) from population characteristics enables examination of the individual drivers of cumulative impacts (Alexeeff et al., 2012; August et al., 2012). The framework illustrated in Figure 2.1 supports this type of analysis.
Sensitive populations are demographic groups most likely to face disproportionate effects from environmental stressors. The academic literature has largely bifurcated these populations in relation to intrinsic and extrinsic factors (Liévanos, 2018). Intrinsic factors are biological and physiological characteristics that amplify how environmental exposures translate into adverse health outcomes. Examples are extremes of age, genetics, epigenetics (i.e., how behaviors and environment cause functional changes in genes), biological sex (including pregnancy and birth outcomes), and chronically impaired health (Morello-Frosch et al., 2011). Extrinsic factors are social characteristics that are associated with differential outcomes from stressors, including race, ethnicity, gender identity, disability, indigeneity, and immigration status. Socioeconomic factors are resources that influence capacity to reduce exposure to environmental hazards. These resources include socioeconomic status elements of income, wealth, education, and occupation. EJ scholarship is replete with empirical examinations of how discrimination, marginalization, classism, and exclusion in decision making related to sensitive
populations and socioeconomic factors lead to differential and disproportionate environmental outcomes, as the discussion earlier in this chapter suggests.
Table 2.1 also illustrates in the EPA and CalEPA definitions that geography is a central organizing principle and provides an analytical framework for understanding how pollution effects accumulate; pollution impacts are aggregated in geographic communities. Such geographic emphasis is supported by numerous EJ studies demonstrating how combinations of de jure (in law) discrimination and de facto (in practice) discrimination, combined with other socioeconomic processes and institutional practices, generate and reproduce spatially concentrated community disinvestment (Rothstein, 2017) and population disparities in exposures and effects (MCRC, 2017).
Cumulative impacts are complex in their effects and those who are affected, but also in their interactions. The framing of allostatic load may be well suited to understanding such interactions. The concept of allostatic load refers to the cumulative biological risk due to wear and tear on the human body from multiple and repeated stresses over time (Gustafsson et al., 2014). Research on allostatic load seeks to understand how human health effects result from interactions among chemical, social, and psychological stressors (Sexton and Linder, 2011), with a growing focus on the role of neighborhood deprivation in generating health disparities (Gudi-Mindermann et al., 2023). Findings indicate elevated rates of death and disease associated with higher allostatic load, yet there is an underdeveloped understanding of the pathways between social stressor exposures and disease outcomes (Ribeiro et al., 2018).
An important element in identifying and measuring cumulative impacts is the continuous involvement of concerned or affected communities throughout the process. The National Environmental Justice Advisory Council and the White House Environmental Justice Advisory Council have specifically recommended that cumulative impact assessment should incorporate participatory engagement with communities in all phases of the process, from planning and interpretation through implementation (NEJAC, 2004, 2011; WHEJAC, 2021). This community-engaged approach is also central to recommendations by the EPA’s Office of Research and Development on cumulative impacts research (EPA, 2022a).
For the purposes of this report, cumulative impacts are defined as the total burden— adverse, neutral, or beneficial—from stressors, their interactions, and the environment that affects the health, well-being, and quality of life of an individual, community, or population at a given point in time and that accumulates over time (EPA, 2022a). Figure 2.2 illustrates a conceptual framework of the principal factors and their interrelationships that generate cumulative impacts. These impacts are generated by combinations
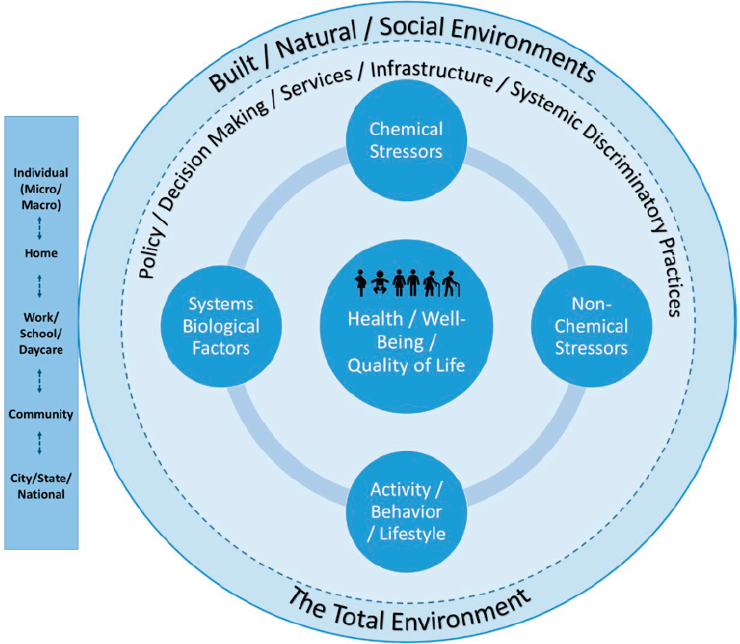
of chemical stressors, nonchemical stressors, biological factors (e.g., age, sex, health, genetics) that affect susceptibility to stressors, and the human activities, behaviors, and lifestyles that affect both exposure to stressors and the mitigation or exacerbation of their effects. The framework for cumulative impacts in Figure 2.2 is holistic, highlighting that (a) the factors that influence human health, well-being, and quality of life span multiple dimensions, and (b) the factors operate interactively rather than independently. This multiple and interactive framing of cumulative impacts is directly pertinent to the development of EJ tools in how disadvantage is conceptualized, which indicators are selected (Chapter 5), and how indicators are integrated (Chapter 6). The context for these interactions is the total environment: the built, natural, and social environments created from policies and decisions, services, and infrastructure investments that are often shaped by systematic discriminatory practices. Stressors in the past, present, and anticipated in the future can aggregate and accumulate over time; they also operate at multiple scales, with impacts affecting individuals, populations, and geographic communities (EPA, 2022a).
CHAPTER HIGHLIGHTS
Communities are defined as groups of people who share common experiences and interactions and, in this report, are geographically defined. Disadvantaged communities experience adverse social, economic, built, and environmental factors that create barriers to achieving the positive life outcomes expected in society. Those factors can be considered “stressors” or “burdens” and encompass both exposures and preexisting conditions that independently or jointly lead to (cause) negative impacts. The magnitude of a stressor is its quantity, size, or degree. This dimension can also capture the difference between temporary and long-term (e.g., lifetime) exposure, as well as the potential for increased future exposure (due, for example, to climate change).
Cumulative impacts (also called cumulative burdens) are the combined positive or negative total burden from stressors, their interactions, and the environment that affects the health, well-being, and quality of life of an individual, community, or population. There are different methods of capturing the presence of multiple stressors and their interactions, including count, intersection, or aggregation methods. Count methods only consider the existence of stressors. Intersection approaches expand on count methods, considering a stressor a burden only if a second stressor is also present. Aggregation methods use mathematical or statistical methods to combine the individual stressors into a single number. Measuring community disadvantage requires careful conceptualization, measurement, and construction if the results are to reflect the real world and support effective policy. The problem of reducing a multidimensional concept to a single composite indicator in a tool such as CEJST is not specific to EJ tools. However, there are many issues that create challenges when creating an EJ tool for measuring community disadvantage. Research demonstrates an association of race or ethnicity with disproportionate exposure to environmental stressors, and historical and current structural racism has led to persistent disparities and outcomes for communities of
color. There are several indexes that can be used to measure structural racism, including geographically based methods to quantify the magnitude of its impacts, but there is not consensus on the best way to do so. Care needs to be taken to avoid treating people of color as a monolithic group.
The next chapter of this report reviews good practices for composite indicator construction, with special reference to supporting EJ screening and analysis tools. Understanding these principles will set the stage for the scan of existing EJ tools presented in Chapter 4, the description of burden indicators in Chapter 5, and discussions of integration analysis and validation in Chapters 6 and 7.
This page intentionally left blank.


