Constructing Valid Geospatial Tools for Environmental Justice (2024)
Chapter: 8 Recommendations
8
Recommendations
A quality environmental justice (EJ) tool has several distinguishing characteristics. It accurately reflects the lived experiences of the communities the tool is intended to represent. The tool outputs are trusted and can be used to inform decision making. Each step of the tool development process has been validated internally for statistical robustness and externally through community engagement to ensure legitimacy. Information about data inputs, indicator construction methods, and community engagement processes are thoroughly documented. Collectively, these characteristics build confidence that the tool is well constructed, its results are accurate, and it can be reliably used to advance policy objectives.
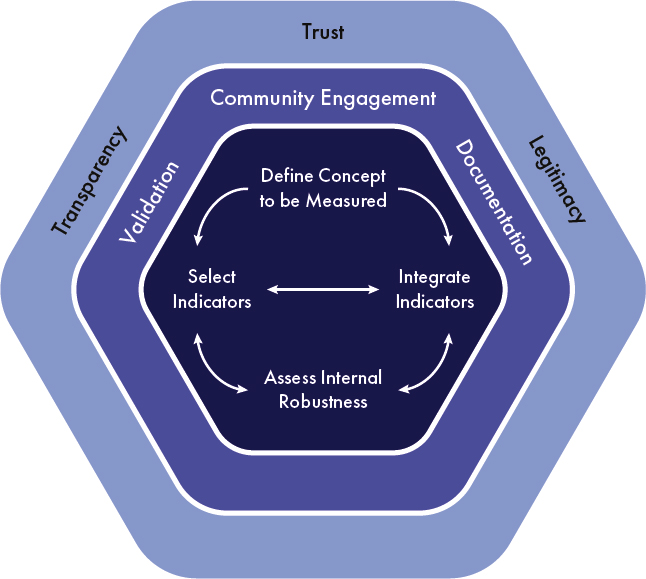
As the committee deliberated its charge, it identified numerous models for the development of geospatial indicators and tools, and some of those models include elements of validation and community engagement. However, the committee came to understand that a data strategy for developing EJ tools needs to embody the concept to be measured and to explicitly integrate community engagement into tool development as an integral part of tool validation. These traits are portrayed in the conceptual framework for the construction of EJ tools introduced in Chapter 3 (as Figure 3.2) and reproduced in this chapter as Figure 8.1. This framework characterizes the desired outcomes of a tool—transparency, trust, and legitimacy—as dependent on substantive and iterative community engagement, validation of indicators and tool results, and detailed documentation of decisions and approaches. A trusted, accurate, and useful EJ tool relies as much on meaningful interchange with communities as it does on technical expertise; it conforms to cultural understanding while being defensible with logic and scientific data. No perfect solution or single approach will satisfy all concerns, but a well-developed tool will be transparent and document uncertainties embedded within it.
The committee was asked to provide recommendations to be incorporated into an overall data strategy for the White House Council on Environmental Quality’s (CEQ)
EJ geospatial tool(s) (see Box 1.1). Currently, the Climate and Economic Justice Screening Tool (CEJST) is the only tool that has been developed by CEQ. As described in Chapter 1, the committee concluded early in its deliberations that a good data strategy appropriate for CEQ and CEJST would also be appropriate for other EJ tool developers and tools. Concepts and recommendations in this report and synthesized in this chapter are therefore generalized and applicable to the development or management of any geospatial EJ tool by developers at CEQ and elsewhere. Tool developers may find that some of the recommendations herein could be implemented sooner with few resources. Other recommendations might be incorporated in some number of tool versions in the future. Still others might not fit within existing tool organization and therefore might be part of a new or separate tool to be developed in the future.
The recommendations presented here are organized around the elements of the committee’s conceptual diagram for the development of EJ tools (Figure 8.1). As described in Chapter 3, this model evolves beyond current models for indicator construction by emphasizing community engagement as a means of information gathering and model validation in all construction components. Tool developers will be more familiar with the innermost components of the model as important aspects of composite indicator construction, and in fact, the description of the conceptual framework in Chapter 3 discusses those components first. However, because community engagement, documentation, and validation are central to building a transparent, trustworthy, and legitimate tool, this chapter begins with those topics.
TRANSPARENCY, TRUST, AND LEGITIMACY
A transparent tool is one in which the tool’s goals, processes, data, and uncertainties are recognized and understood by the tool users and people interested in the results. A legitimate tool is often directly connected with how much acceptance communities will have of the tool and its results. Creating a tool that builds transparency, trust, and legitimacy into aspects of tool construction (i.e., those depicted in Figure 8.1) is a good data strategy for yielding better data selection, integration processes, and outcomes. This is a tool that follows good indicator construction practices (as described in Chapters 3 and 5) and integrates those indicators (Chapter 6) and validates the results (Chapter 7) in an iterative manner through systematic and sustained technical and community peer review.
Incorporating advice from communities and appropriate technical experts in an iterative matter throughout tool development is vital to building transparency, trust, and legitimacy in the process and outputs. Sustained interaction with community experts and advisory boards reflecting community populations is vital so that choices related to the tool can be informed and improved iteratively based on lived experience. This is particularly true for the selection of tool indicators, the data that measure those indicators, and the processes to integrate those indicators. Inadequate indicators or indicator integration techniques may inaccurately represent disproportionate exposure to the social and environmental hazards that lead to community disadvantage.
COMMUNITY ENGAGEMENT
Choosing appropriate indicators, datasets, and integration approaches requires more than statistical robustness to achieve valid results. A good data strategy includes systematic and sustained community engagement in these activities to verify and enhance the legitimacy of and trust in a tool’s approaches. Community engagement is also necessary to validate tool results, to understand what kinds of errors are likely; why, where, and how they might be overcome; and how uncertainties in tool results might affect the decisions the tool is meant to inform. Chapter 3 highlights the crucial role of community engagement throughout the entire process of constructing composite indicator-based EJ tools. It also discusses the wide spectrum of community engagement models that could be employed and the need for transparency and honesty in choosing the appropriate model. Chapter 7 stresses the importance of lived experience in tool validation and processes for community engagement in achieving validation.
Recommendation 1: Create and sustain community partnerships that provide forums and opportunities to identify local environmental justice issues, identify the indicators and datasets for measuring them, and determine whether tool results reflect community lived experiences.
Partnering with communities to improve the representation of lived experience with the tool can be achieved through:
- Developing a strategic plan that operationalizes community input regarding indicators, data, and tool approaches;
- Being transparent about how community input will be addressed;
- Seeking continued feedback from communities about the improvement of the tool being developed, particularly focusing on input from those representing marginalized communities; and
- Creating a nonburdensome process for communities that feel they are not well represented in the tool to engage (e.g., reducing economic barriers to meaningful engagement through compensation, childcare, travel assistance, or other appropriate forms of material assistance to members of overburdened or underrepresented communities).
Meaningful community engagement represents a shift in the spectrum of public participation (see Chapter 3). Effective engagement processes allow communities to feel involved in governmental decisions that have local implications and empowered to influence these decisions through their input. Many EJ issues are local in scope, and close community engagement helps bring local issues into context, not only for understanding burdens across communities but also for finding targeted solutions that address unique needs.
Community engagement could require significant resources and capacities to be meaningful. Given the scale and scope of national-level EJ tools intended (a) to define different populations and diverse geographies; (b) to be responsive to different and potentially opposing needs, attitudes, and priorities; and (c) to inform decision making in multiple sectors, tool developers will need to consult experts in community engagement and rely on, for example, advisory panels to help design appropriate programs tailored for an individual tool. Because in-depth engagement cannot realistically occur at the national level with all communities represented by a tool, methods to identify representative communities, to design tool feedback methodologies, and to validate decisions made during indicator construction will necessarily be important in the design of an engagement program. And given that it is common for EJ tools such as CEJST to use indicators from other tools or datasets developed for other purposes, data selection criteria might include guidelines to prioritize those data and indicators that have been validated through community engagement.
DOCUMENTATION
The heterogeneities in the physical and social factors that affect the well-being of communities across the country, as well as in the data available to measure those factors, are large. As a result, there will never be complete consensus regarding the “best” data or methodologies for identifying community disadvantage in an EJ tool, nor will there ever be complete satisfaction in the results derived from such a tool. Furthermore, no matter how good a tool is or how valid its results may be, the transparency, trust, and legitimacy of an EJ tool are more likely to be questioned if the tool is not accompanied by thorough documentation.
The middle ring of the conceptual framework in Figure 8.1 includes community engagement, validation, and documentation; these components are largely driven by communication. The community engagement and validation components provide opportunities for dialog between tool developers and the community, with a large focus of the communication being focused inward to the tool development process. Documentation is an important means of providing information outward to the public. Thorough documentation of all tool components and approaches is vital to ensure proper tool use, to help decision makers understand where and how the tool may be accurate and what kinds of uncertainties should be expected, and to know when tool results need to be supplemented with other types of information. Good documentation makes the strengths and weaknesses of the tool clear to interested and affected tool users or community members and provides guidance regarding how best to use the tool to inform decision making.
Recommendation 2: Provide thorough and accessible documentation of indicator design processes and decisions, including descriptions and rationale for all major indicator construction components.
The current documentation of CEJST methodology and data is laudable. It includes descriptions of the burden categories and datasets, instructions on how to use the tool, and access to the code via a public repository. Less clear are the processes and rationale for decisions regarding indicator selection, data normalization, data treatments, thresholds, indicator aggregation, assessing statistical and conceptual coherence, uncertainty analysis, external validation via community engagement, and the design of the user interface and mapping tool. Documenting this information in formats and via media that are accessible for a variety of technical and nontechnical audiences and users to obtain and interact with will increase trust in and the usefulness of the tool for different decision-making applications. Other EJ tools, such as California’s CalEnviroScreen and New Jersey’s EJMAP, include information about which indicators are selected, their significance to EJ and human health, and detailed methods that allow users to understand the rationale and thought process that go into tool construction.
As discussed below (in the section on Defining the Concept to be Measured), the committee sees the value of using a structured framework that requires explicit and careful consideration of the interlinked decisions necessary to construct a composite
indicator-based EJ tool. A structured composite indicator construction framework can also serve as the template for documenting these decisions.
VALIDATION
Validating composite EJ tools such as CEJST is a nuanced process. Technical decisions related to a tool are often constrained because of external forces (e.g., mandates) or data criteria requirements. For example, the choice to use census tracts to define communities in CEJST is aligned with the Executive Order (E.O.) that mandated the creation of CEJST. The choice was made with the knowledge that census tract boundaries do not always align with community boundaries and that large disparities in community health and well-being within a census tract may exist. However, the choice also takes advantage of national datasets available at that scale. Given that such compromises are inevitable during the development of any tool, and given that no single definitive measure might be available to validate for the purpose of a tool (e.g., “overburden” or “disadvantage” for CEJST), validation methodologies need to be applied throughout the construction of a tool to determine how well the tool relates to real-world conditions.
Recommendation 3: Validate tool development and evaluative processes throughout the construction of an environmental justice tool using approaches such as ground truthing, convergent validation, and community validation to ensure that the tool’s indicators and results reflect lived experiences.
Tool validation techniques can be applied to ensure that a tool is stable, accepted, and scientifically sound. Chapter 5 describes effective validation, spanning how well the indicators measure what they are supposed to (construct validity), the degree of alignment among indicators (concurrent validity), and the indicators’ representativeness of the underlying concept (content validity). Methodological components and processes are outlined that can be applied during tool construction to ensure that a tool and its findings are rooted in the realities and lived experiences of communities. Validation of indicators and tool results may take the form of a combination of technical, statistical, and community engagement activities. Ground truthing, for example, includes establishing information that can be used to compare with modeled information, and there are multiple ways to do this.
- Convergent validation compares tool components or results with those of similar tools. They can take the form, for example, of correlation analysis of tool results.
- Community validation is an iterative process conducted through collaborative engagement with communities to compare how well the tool reflects lived experiences. Consistent engagement throughout the tool development or upgrading process allows developers to test decisions, approaches, and tool results against community member narratives, while empowering communities to accept or refute definitions being assigned to them.
- Mixed methods that allow collection and analysis of both qualitative and quantitative datasets are framed withing research models to better understand multiple perspectives on any issue and are well suited for tool validation. Although mixed methods challenge the “traditional” scientific mindset focused on quantitative data, their use will result in data interpretation and informed research practices that allow for the incorporation of lived experiences into data analyses.
Tool validation needs to be done in consultation with communities, community experts, and researchers (e.g., environmental health experts) and results in improvements in data quality and increased transparency and trust in the tool development process.
Supplemental analysis conducted outside the tool development process using independent external datasets is an important means of checking indicator data sources for gaps or inaccuracies. They can be used to compare, for example, the spatial correlations between results of different tools for the sake of comparison. CEQ might conduct supplemental analysis to, for example, compare the distribution of race/ethnicity indicators and CEJST outputs to test the validity of CEJST’s current formulation. The analysis can result in a greater understanding of sociodemographic composition and determinants of health in communities identified and generate localized narratives to better understand lived experience.
DEFINING THE CONCEPT TO BE MEASURED
Chapter 2 describes the concept of community disadvantage, its complex nature, and the processes and structures (e.g., discrimination and racism) that lead to overburdening of some communities by stressors and underinvestment in them by private and public capital. Chapter 3 discusses the challenge of measuring and identifying concepts such as community disadvantage through EJ tools such as CEJST and the construction of composite indicators—reducing a multidimensional concept into a single value. Composite indicator construction involves a set of carefully considered interlinked decisions, starting with a clear definition of the concept being measured. Use of a structured framework in the construction of a composite indicator helps to improve transparency, trust, and legitimacy by ensuring that all composite indicator construction decisions are considered explicitly and lead to the stated objective of the composite indicator, and then are documented carefully. Multiple frameworks exist to guide composite indicator construction with similar frameworks. The committee found the 10-step Organisation for Economic Cooperation and Development (OECD) pocket guide to be useful for framing composite indicator construction (Saisana et al., 2019). The OECD pocket guide does not specify how to construct a particular tool but rather highlights the decisions that should be made, the interconnectedness of decisions, the need for engagement with community members and other interested and affected parties, and the importance of validation via lived experiences. The first step in composite indicator development in the OECD pocket guide and others is to define the concept that the composite indicator is intended to measure.
Recommendation 4: Initiate environmental justice tool and indicator construction with the development of clear objectives and definitions for the concept(s) to be measured. Follow a structured composite indicator development process that requires explicit consideration and robustness analysis of all major decisions involved with indicator selection and integration; assessment of uncertainties; and validation and visualization of results.
The categories of burden within CEJST reflect the priorities of E.O. 14008, but without transparent roles and relationships within the tool itself. The lack of explicit structure linking the defined concept being measured, its dimensions, and the indicators of those dimensions creates an implicit weighting scheme within CEJST in which the categories of burden with more indicators have greater relative importance since they increase the chance that a census tract will meet one of its indicator conditions. A future data strategy that will incorporate the state of the art and practice in composite indicator construction includes
- Defining the concept to be measured and developing a description of its multiple facets or dimensions.
- Selecting the indicators that measure each dimension. This type of top-down approach promotes conceptual clarity and provides strategies for effectively weighting and aggregating indicators.
- Analyzing, treating, normalizing, and weighting the indicators as appropriate.
- Integrating/aggregating the indicators.
- Assessing statistical and conceptual robustness and coherence and determining the impact of uncertainties.
- Validating the results and presenting them visually.
If future versions of CEJST incorporate more sophisticated indicator integration methods for capturing cumulative burdens (see below), the lack of an explicit conceptual structure linking concept definition, dimensions, and indicators may be problematic.
SELECTING AND ASSESSING INDICATORS
As discussed in Chapter 5, indicators are quantitative proxies for abstract concepts that are developed from existing datasets. Indicators may be selected from those developed by others, or they may be created from existing datasets. The selection of indicators and datasets requires consideration of their technical and practical characteristics and how well they support the tool or indicator objectively. Many indicators may be based on empirical data that can be assessed statistically. However, not all data are empirical, nor are they of equal quality, expressed in the same units or at the same scales, or collected for the same purposes. Given the close interconnection between concept definition, indicator selection, weighting, and methods to ground truth, the decisions related to indicator selection are paramount to a high-quality and accurate tool.
Recommendation 5: Adopt systematic, transparent, and inclusive processes to identify and select indicators and datasets that consider technical criteria (validity, sensitivity, specificity, robustness, reproducibility, and scale) and practicality (measurability, availability, simplicity, affordability, credibility, and relevance). Evaluate measures in consultation with federal agencies, technical experts, and community partners.
Selecting indicators and datasets for any tool requires a careful and structured approach to composite indicator construction, as described in Recommendation 4 and includes a systematic scan of available data. In the case of CEJST, the indicators and corresponding datasets appear reasonable; however, they represent only a small subset of the wide range of possible federal and national datasets that could be used to inform an EJ tool (see Appendix D for examples). A systematic scan of the federal- and national-level landscape, perhaps in partnership with federal agencies and other data providers or a steering committee, could identify other or more appropriate indicators for defining community disadvantage.
After identifying potential indicators, correlation analysis can then inform the selection of indicators and their organization into categories. Analysis that demonstrates highly correlated indicators might also indicate redundancy in the indicator set. The result might be an unintended implicit weighting scheme if the highly correlated datasets are used. Correlations among indicators or datasets that are low, negative, or statistically insignificant signify poor statistical alignment with the concept to be measured. Both results provide an empirical rationale for the targeted revision of the indicator set. Employing statistical analysis to guide indicator selection helps ensure that input indicators in an EJ tool are both thematically and statistically coherent with community disadvantage. Such analysis also increases methodological transparency.
Economic Indicators
The socioeconomic indicator in CEJST is the most influential variable in the tool, given that for a tract to be designated as disadvantaged it must meet the socioeconomic threshold as well as any one of the other 30 indicators across the eight categories of burden. The measure of low income is especially important in identifying communities as disadvantaged as it is coupled with 26 of these indicators (i.e., all but those in the workforce development category). As is the case with any indicator, it is important to consider how well it reflects the lived experience of the community that it is meant to represent. Using the federal poverty level to determine economic burden at the national scale can mischaracterize economic burden because of the varying cost of living around the nation that is not considered.
Recommendation 6: Choose measures of economic burden beyond the federal poverty level that reflect lived experiences, attend to other dimensions of wealth, and consider geographic variations in cost of living.
Using a single, uniform low-income measure in a tool such as CEJST may not accurately reflect lived experiences, even after doubling the standard poverty level and accounting for the cost of living. Other indicators can be used as socioeconomic measures (e.g., U.S. Department of Housing and Urban Development Public Housing/Section 8 Income limits for low income,1 homeownership rates, median home values, or a weighted income metric) as long as it is acknowledged that income-based measures deserve scrutiny because of the effects of income on all aspects of a person’s or household’s quality of life (e.g., nutrition, health care, and education). Metrics of income do not necessarily measure wealth, and the wealth gap between high-income and low-income households is larger than the income gap and is growing more rapidly (Horowitz, Igielnik, and Kochhar, 2020). Tool developers should work alongside communities to identify other dimensions of wealth that would more accurately reflect these differences and to perform sensitivity analyses on these indicators and their thresholds in the process.
Consideration of Racism and Race
There are important distinctions between measures of race or ethnicity and measures of racism. While measures of race simply identify the composition of people living in communities, measures of racism reflect the system of policies and practices that negatively impact specific races or ethnicities and is a key driver of climate and economic injustice within the United States. Chapter 2 of this report describes the disproportionate exposure to hazards in communities largely populated by peoples of color. Incorporating racism as an indicator in an EJ tool can strengthen and add legitimacy to the tool. If a tool developer is unable to incorporate approaches to acknowledge the history of racism and land use policies that have led to the injustices and disparities observed in communities populated by peoples of color, then they should explicitly factor race or ethnicity as an indicator to measure community disadvantage.
Recommendation 7: Use indicators that measure the impacts of racism in policies and practices that have led to the disparities observed today. If indicators of racism are not used, explicitly factor race and ethnicity as indicators when measuring community disadvantage.
Using measures of racism allows tool developers to identify disadvantage being placed on people of color or certain ethnicities. However, if such measures cannot be readily used by tool developers because they do not meet data criteria, disaggregated data on race and ethnicity that are readily available and could be used instead—for example, U.S. Census data on race and ethnicity—until appropriate indicators can be found or developed and incorporated into future iterations of a tool. Because not all people of color have the same lived experiences or histories of discrimination, people
___________________
1 See HUD’s FY 2023 methodology for determining Section 8 limits at https://www.huduser.gov/portal/datasets/il//il23/IncomeLimitsMethodology-FY23.pdf (accessed March 8, 2024).
of color should not be treated as a monolithic group. There is a large and growing range of indicators or measures of racism described in Chapter 5 and Appendix D. Tool developers can work with representatives of communities of color and subject-matter experts to revisit existing empirical data and consider the metrics, quantitative data, and qualitative data that reflect community lived experiences.
While CEQ develops measures of racism to be incorporated directly into CEJST, supplemental analysis comparing the distribution of race/ethnicity indicators and CEJST outputs could help CEQ tool developers gain a greater understanding of how well CEJST captures community disadvantage in its current formulation. The results can reveal how the input and output indicators of an EJ tool are distributed by racial and ethnic composition. Such analyses inform understanding of the degree of racial and ethnic disparities in the designation of disadvantaged places, provide insight into possible measures of racism that led to these disparities, and address questions about the ability of CEJST to identify disadvantage without the inclusion of race or ethnicity indicators. Publication of supplemental analyses results regarding the relationship between race/ethnicity and CEJST would show CEQ responsiveness to public comments, increasing trust in the tool development process and tool results.
INTEGRATING INDICATORS AND CUMULATIVE IMPACT SCORING
Measuring and redressing cumulative impacts is a stated objective of E.O. 14008, the CEQ, and EJ advocates. It better reflects the synergism between environmental and socioeconomic burdens and their accumulation over time, which is important if the interplay of multiple concurrent stressors interacting with sociodemographic, environmental, and public health factors leads to the possibility of the total impacts being greater than the sum of the individual stressors.
Recommendation 8: Designate communities as disadvantaged based on cumulative impact scoring approaches that are informed by the state of science; the knowledge, needs, and experiences of agencies, tool developers, and users; and validation efforts conducted in partnership with affected communities. Choose an approach to represent cumulative impacts, such as threshold approaches (e.g., summing thresholds or categories exceeded) or aggregation-based approaches for composite indicator construction (e.g., compensatory, noncompensatory, or a combination of approaches).
CEJST employs a binary approach for identifying disadvantaged communities, one that does not discern communities facing single and multiple burdens. A community is designated as either disadvantaged or not disadvantaged. Cumulative impact scoring is an established practice in state-level EJ tools, including CalEnviroScreen and Maryland’s EJ Screening Tool. Such scoring enables clearer comparison of communities and prioritization of investment based on the severity of burden.
Indicator selection, weighting, and aggregation methods for capturing cumulative burdens are intertwined modeling decisions that should be made in an iterative and engaged manner, reflecting scientific knowledge, tenets of indicator construction, perspectives of interested and affected parties, and lived experiences. Although reaching consensus on indicator weights can be difficult, weighting cannot be avoided since it has a major impact on composite indicator results when aggregating. Methods to address this challenge could include interactive methods for varying these decisions, visualizing their effects on the results, and visualizing the composite indicator decomposed into subgroups and individual indicators in both chart and map form. Using the design principles of interactive cartography and spatial decision support system methods will make these analyses and visualization more accessible and understandable to diverse audiences.
As Chapter 3 and Chapter 6 discuss, there are methods for group and collaborative decision making to achieve consensus in indicator selection, weighting, and aggregation decisions. CEQ and other EJ tool developers should pursue collaborative and engaged decision making with interested and affected parties and communities on indicator selection, weighting, and aggregation based on expertise in community engagement practices. Throughout the indicator integration process, developers should partner with communities to understand and reflect cumulative impacts in the integration. Additionally, consulting with other creators of cumulative impact tools (as identified in Chapter 4) will provide insight into lessons learned.
ASSESSING ROBUSTNESS
Uncertainty and sensitivity analyses inform the development of a composite indicator (see Chapter 6). Uncertainty analysis quantifies the variability in model outputs based on changes in model inputs. Sensitivity analysis apportions variability in model outputs to different input parameters or model structures. Both types of analyses can be conducted as a local analysis, in which one parameter is evaluated at a time, and global analysis, in which multiple parameters and their interactions are assessed simultaneously using Monte Carlo simulation.
Recommendation 9: Perform and document uncertainty and sensitivity analyses to evaluate how decisions made during tool development affect tool results. Decisions to be assessed may relate to, for example, the selection of indicators and indicator thresholds; model structure; processes related to the normalization, weighting, and aggregation of indicators; and the criteria used for the final designation or classification of communities.
Constructing a composite indicator requires numerous modeling decisions, each of which includes multiple plausible options based on scientific knowledge, available data, and community preferences. These modeling decisions can independently and conjointly influence which communities the tool identifies as disadvantaged. Particularly for composite indicators such as CEJST that are used for high-consequence resource
allocation and project prioritization, it is crucial to understand the degree to which modeling decisions affect the robustness of the outputs. Uncertainty and sensitivity analysis are core best practices for quality assurance in composite indicator construction and should be a part of a data strategy for any tool, including CEQ tools such as CEJST.
Conducting a global uncertainty analysis of CEJST will improve understanding of the precision of disadvantaged community designation when the model is subjected to alternative construction choices. Subsequent global sensitivity analysis can identify which modeling decisions are the major sources of uncertainty. Epistemic uncertainty can then be diminished through subsequent research, targeted data collection, and improved modeling, ultimately reducing statistical fragility and increasing the transparency of the modeling process. Conducting global uncertainty and sensitivity analysis can also provide empirical results to support response to public queries about the certainty of overall and geographically specific designation of community disadvantage.
MOVING FORWARD
Not all these recommendations can be implemented in the next release of CEJST. However, some of the recommendations could be implemented in the short term. For example, even before any changes to the tool construction are made, CEQ could expand the current documentation of CEJST, thereby improving communication with interested and affected parties and tool users by explaining design processes and decisions, including descriptions and rationale for all major indicator construction components, and describing robustness analysis and results. It can begin to expand its community engagement efforts to create the community partnerships that provide forums and opportunities to identify local EJ issues, identify the indicators and datasets for measuring them, and determine whether tool results reflect community lived experiences. CEQ tool developers can work with developers from other agencies and organizations and consider approaches incorporating cumulative impact scoring into its overall approach.
The conceptual framework for indicator and tool construction depicted in Figure 8.1 is focused on a clearly defined objective (i.e., the concept to be measured). A data strategy can only be successful if the concept to be measured is well defined and accepted by those that will be affected by the definition. Measuring something as complex as community disadvantage cannot be a numerical and statistical exercise focused solely on empirical data when the goal is to develop an EJ tool that is transparent, trusted, and legitimate. The tool needs to be grounded, developed, refined, and validated through communication and collaboration with the communities that the tool is intended to define.
This page intentionally left blank.


