Constructing Valid Geospatial Tools for Environmental Justice (2024)
Chapter: 7 Importance of and Methods for Tool Validation
7
Importance of and Methods for Tool Validation
Validation is an essential process for elevating the trustworthiness and utility of composite tools across diverse domains of inquiry. The committee’s conceptual model for development of a composite tool (see Figure 3.1) is validation through comparison with real-world observations. After the concept to be measured is defined, indicators are selected, scaled, weighted, and integrated, and robustness is evaluated, tool concepts and results need to be validated by tool developers and other interested and affected parties. Validating composite environmental justice (EJ) tools such as the Climate and Economic Justice Screening Tool (CEJST)1 is a nuanced process, given the breadth of datasets employed. CEJST attempts to characterize disadvantage in the context of Justice40,2 but disadvantage is a multidimensional construct, and no single outcome (e.g., life expectancy) can accurately validate CEJST results. Concepts such as “disadvantaged” and “overburdened” do not have definitive measures and therefore are challenging to validate.
Validation confirms the accuracy and can increase community acceptance of a tool and its results, but it is also a process for justifying decisions made throughout tool development. Tool validation can also help identify outlier places that do not fit the general pattern, as analyzing them can provide insights into possible data problems and new variables. As such, validation is an important reality-grounding step in EJ tool development (OECD and JRC, 2008). Different validation methods are applied across disciplines, dependent on purpose and function (Stöckl, D’Hondt, and Thienpont, 2009). For example, in epidemiological studies, a health risk assessment is validated by testing the statistical relationship between the variables studied and an independent variable representing the health outcome associated with the contaminant and exposure pathway being studied (Steyerberg et al., 2001). Other types of validation involve data
___________________
1 See https://screeningtool.geoplatform.gov/en/#3/33.47/-97.5 (accessed November 22, 2023).
2 Read more on the White House’s Justice40 Initiative at https://www.whitehouse.gov/environmentaljustice/justice40/ (accessed February 1, 2024).
triangulation, cross-cultural adaptations, and expert consensus to bolster tool credibility and generalizability (Kalkbrenner, 2021; Santos et al., 2020).
Deliberate and intentional community engagement is another form of validation that incorporates perceptions of affected parties and lived experiences (see Box 7.1) into the portrayal of environmental conditions and future policy outcomes (Larsen, Gunnarsson-Östling, and Westholm, 2011). It may help refine definitions of terms such as “overburdened” and “disadvantaged” and provide an opportunity to learn the narratives around data. This, in turn, can reveal the strengths and limitations of an EJ tool. For EJ purposes, it is important to center those who are disproportionately affected by injustices and those with historical legacies of oppression and provide those communities the right to self-representation (Davis and Ramírez-Andreotta, 2021; Liboiron, Zahara, and Schoot, 2018; Wilkins and Schulz, 2023).
Both community-based and noncommunity-based validation methodologies can be applied during EJ tool construction to ensure that the outputs reflect the realities and lived experiences of communities. Methodological decisions are based on a range of criteria, such as precedents set in the development of other tools, statistical uncertainty, data availability, and public input. These criteria are multifaceted and complex, and the decisions related to them are imbued with uncertainty and caveats. After the beta version of CEJST was released in 2021, the White House Council on Environmental Quality (CEQ) solicited and received comments from various interested and affected parties, several of whom questioned the methodologies employed, decisions made, and associated criteria from which those decisions originated.3 Concerns related to methodologies and assumptions, such as those expressed, can cast doubt on the internal robustness, validity, current relevance, representativeness, and overall responsiveness to community concerns. It may be difficult to systematically identify all burdens within all communities where conditions are over- or underrepresented, and as such a certain amount of error in EJ tools is unavoidable. Tool validation that is transparent to interested and affected parties is valuable in that it is both a mechanism for tool improvement and helps to build trust. To develop a tool that is stable, accepted, scientifically sound, and representative of lived experiences, validation of the overall output is essential. This chapter focuses on approaches for validating tool results (i.e., output).
VALIDATING TO REFLECT REALITY
EJ tools may attempt to characterize millions of people from different geographic regions, representing many cultural and socioeconomic backgrounds. Effective engagement and collaboration to determine appropriate indicators (see Chapter 5) and identify data gaps can ensure that the tool reflects the reality of peoples’ diverse experiences. The Yale Equity Research and Innovation Center (ERIC)4 cites community engagement
___________________
3 As examples, CEQ held numerous listening sessions with the public (see https://screeningtool.geoplatform.gov/en/public-engagement [accessed March 12, 2024] for a listing of events) and received input from the White House Environmental Justice Advisory Council (e.g., WHEJAC, 2021).
4 See ERIC and its guidebook on community based participatory research at https://medicine.yale.edu/internal-medicine/genmed/eric/ (accessed March 1, 2024).
BOX 7.1
Incorporating Lived Experience into EJ Tools
Lived experience in this report refers to the familiarity and perspectives of community members who experience environmental injustices firsthand and in real time. One may have lived expertise from being a part of a geographic community, or one may have lived experience within a cultural or marginalized community. Lived experience provides information on the who, what, where, and when of burden and underinvestment. Incorporating local knowledge into the EJ construction and validation process complements sampled or modeled data and can result in a better portrayal of the complex environments in which people live (de Onís and Pezzullo, 2017; Dory et al., 2015). Community validation results from active engagement and partnership with disproportionately impacted communities, which are often also disadvantaged communities. A study by Powers, Mowen, and Webster (2023) highlights a potential scale for measuring public perception of environmental justice efforts for the sake of community validation.
Because lived-experience data are often qualitative, some researchers may be reluctant to use them, fearing a lack of rigor, representativeness, and defensibility (e.g., Crooks et al., 2023). Below are example practices provided by Frechette and others (2020) that could assist in incorporating lived experience into tool development, deployment, and evaluation:
- As a researcher, tap into your own humanity when engaging with communities. Pay attention to your body’s reactions and rising emotions. This may require engaging the limbic (i.e., emotional) brain, which many researchers may avoid. Being conscious of these reactions may result in better understanding the situational realities and support the validation exercise. Conduct site visits and observe the emotions of community members there. Consider artwork relevant to the research topic and speak with the artists; ask what they wanted the audience to feel or know and compare that with your own human experience.
- When presenting lived-experience data, discuss data points as anecdotal and clearly state the limits of associated findings, especially when the sample size is small and lacks rigorous analytical methods. Propose these points as findings for future research to ensure that the data are included.
- Apply interpretive phenomenology analysis (IPA), a form of qualitative psychological research that favors making sense of situations through individualized and contextualized frameworks. IPA relies on well-defined and pointed research questions, organizations, and guidance for the selection of diverse samples to provide an account of a situation. IPA allows researchers to seek more diverse data collection methods and enhance interpretation of the data beyond description to asking, “so what?”
and community validation as beneficial to both communities and researchers as a means to increase the validity, legitimacy, and effectiveness of interventions. They provide information and a guidebook on a specific type of engagement called community-based participatory research (CBPR), which is used to assist officials, clinicians, and researchers in engaging communities in their research. The process could also be used by tool developers to determine how well the indicators and tool results represent real-world conditions. Tool developers may consider:
- How do the EJ tool results and methodologies compare to other EJ tools addressing similar geographies and topics?
- How well do the EJ tool results represent lived experiences and match the knowledge of those in disadvantaged communities?
- How do the results of the tool change over time, including how the distribution of disadvantaged communities is represented?
- What is the statistical relationship (e.g., correlation) between the EJ tool results and important factors not currently included in the tool (e.g., race), and how does that relationship inform knowledge about disadvantaged communities?
Tool construction decisions may be informed through validity analyses throughout the development and evaluation of the EJ tool. The performance of tools such as CEJST may also be improved through validation conducted between version releases. The validation result could be used to inform the public throughout tool development and may be published in external products (e.g., white papers, journal articles, websites, or the production of downloadable datasets). The following sections detail several of these methods, including ground truthing, convergent validation, community validation, advisory panels, and the incorporation of lived-experience data through mixed methodologies.
Convergent Validation
Convergent validation allows tool developers to evaluate how their tool results compare against other national, state, and local tools and data sets (Collins, Grineski and Nadybal, 2022; Kim and Verweij, 2016; Krabbe, 2017). Data used for validation can have many forms (e.g., satellite data) and numerous methodologies are available can be applied (for example, triangulation [e.g., Fielding, 2012]). An example of convergent validation would be comparing a specific indicator used in CEJST against a similar indicator in a state-level EJ tool, such as CalEnviroScreen. In the case of fine inhalable particulate matter (PM2.5), CEJST uses national-scale data from the U.S. Environmental Protection Agency (EPA); this can be compared to California’s independently collected data represented in CalEnviroscreen. If CEJST and CalEnviroScreen yield different PM2.5 estimates for the same geographic area, questions about the convergent validity of the indicator arise: Are the differences due to data source, temporal range, outcome measured, or some other cause? This type of analysis provides one dimension of tool validation and insight into the tool’s strengths, limitations, and applications.
Community Validation
Community validation is a critical component of every step of EJ tool development. This is not a unidirectional sharing of information but rather an iterative process grounded in ongoing collaborative relationships between government agencies and communities. Tool developers, such as CEQ, can validate data, approaches, and tool results through community engagement in a variety of ways: through targeted outreach to interested and affected parties, workshopping in disadvantaged communities via small-group discussions, providing office hours to respond to questions or receive input,5 or through creative approaches such as data challenges or hack-a-thons. Community validation may also take the form of community peer review (see Box 7.2). Conducting such activities continually during the development and upgrading of a tool will maximize the benefits gained from community validation. When tool developers (e.g., government agencies) directly engage with communities through community-based research and consultation, they can better understand and incorporate community concerns into their research (Shepard, 2002).
Members of disadvantaged communities may live near chemical facilities, landfills, and brownfields; may inhabit areas of food insecurity; or may suffer from living with extreme heat. The committee heard this feedback during its information-gathering workshop (NASEM, 2023a). Lived-experience data—for example, access to air-conditioning or newer air filtration systems—might be collected through community engagement to augment more traditional data sources. Such information provides context for how burdens could be represented in EJ tools. Communities and individuals have long urged federal agencies to incorporate lived experience into their research, programs, and policies.6 The Assistant Secretary for Planning and Evaluation (ASPE), an advisor to the U.S. Department of Health and Human Services (DHHS), provides a website of information with guidance for federal agencies on how to better incorporate community engagement and lived experience in programming, research, and policy (Skelton-Wilson et al., 2021).
Without ongoing input from community members, EJ tools like CEJST risk selecting irrelevant indicators, mischaracterizing communities, and creating a tool that could negatively affect decisions related to a community. Giving community members regular opportunities to verify or refute data, models, and outputs as consistent with lived observations is a practical approach to tool validation that is fundamental to EJ tool development, acceptance, effectiveness, and sustainability. This could be done, for example, by systematically incorporating mechanisms that allow those most familiar with a region to explore and critique tool results (such as a map showing census tracts designated as disadvantaged) to ensure that designations resulting from a chosen methodology reflect their knowledge and lived experiences. By partnering with community members and subject-matter experts, tool developers can iteratively validate and refine
___________________
5 EPA’s EJSCREEN tool holds public bimonthly conversations called “Office Hours,” where people can ask EPA EJSCREEN experts questions about many topics, including how to use the tool and technical issues.
6 ASPE echoes this sentiment on their website on lived experience at https://aspe.hhs.gov/lived-experience (accessed March 1, 2024).
BOX 7.2
Community Peer Review for Informing EJ Tool Development
Community peer review is a growing practice and research tool. It is intended to ensure the opportunity for community consent or refusal to participate in government processes or events if there are concerns these processes or events may cause community harm. Community peer review also provides the right to self-representation and the right to refute false yet established narratives regarding research practices and methodologies (Liboiron, Zahara, and Schoot, 2018). It helps communities determine if the work being done will cause or prevent them harm. Liboiron, Zahara, and Schoot (2018) describe steps in the community peer review process that can be applied to EJ tool development (see list below). They also provided a thorough analysis of their community peer-review sessions, including how to work with different interest groups on a specific issue (e.g., chemical industry and disadvantaged community representatives). Below is an example of a workflow for community peer review.
- Identify the community. The community may not geographically align with census tracts, census blocks, or other administrative boundaries. The community definition needs to be considered when determining the best way to represent the community (e.g., through indicators and data used in an EJ tool).
- Examine and analyze the economic, social, and cultural aspects of the community, allowing for increased context of the lived experience surrounding and interacting with observed data. This research need not be limited to the consideration of peer-reviewed studies and datasets. Spend time with community members to learn their histories, points of pride, and concerns.
the tool methodologies to result in a tool that minimizes discrepancies. Community members would be able to help developers determine if the current methodology is missing an important indicator or perhaps is erroneously classifying tracts because a chosen threshold was too high or too low. These partnerships have long-lasting effects, as communities can both advise on future revisions to tools and on targeted mitigation (e.g., types of investment) that could provide the greatest benefit.
Open data forums and events, sometimes referred to as “data challenges,” in which anyone can engage with government data and submit feedback, advice, and potential solutions to environmental issues are increasingly common at state7 and federal8 levels.
___________________
7 An example of a data challenge at the state level is the California Water Data Challenge: https://waterchallenge.data.ca.gov/background/ (accessed January 31, 2024).
8 An example of a data challenge at the federal level is DHHS’s Environmental Justice Community Innovator Challenge: https://www.hhs.gov/about/news/2023/09/18/hhs-launches-environmental-justice-community-innovator-challenge.html (accessed January 31, 2024).
- Hold a community meeting. A tool developer can identify datasets for which community meetings are part of the data collection process. Assuring that the community meeting can include widespread community representation may mean holding the meeting at a time when most community members can attend, offering childcare and food options, considering in what language to hold the meeting or whether interpreters are needed, and considering transportation access. Meetings need to be viewed as trustbuilding sessions, where listening to the community outweighs teaching the community. Hold follow-up meetings throughout the tool-development process and be accountable when discussing the results of community input. Community meetings are opportunities to discuss the Spectrum of Community Engagement to Community Ownership (Gonzalez, 2019; also see Chapter 3). The discussion can assist in ensuring interested and affected parties agree with roles and responsibilities.
- Ensure that communication and information gathering are accomplished in ways that are natural for the community. This may include focus groups, interviews, or other means of information collection (Liboiron, Zahara, and Schoot [2018], for example, used surveys). The goal is to mitigate community stress and begin to build trust-based relationships. It is a good practice to observe and listen. Even observations of the community and meeting environment can help further identify and research the community.
- Connect community feedback to community research. Ensure that all interpretations and conclusions are rooted in community research and all previous steps. This will be important in tool validation.
This moves beyond research and into exploration and can help establish trust. Plan to compensate community members for their participation.
Although there are several ways for government to engage with communities to validate EJ tools, community members may be unable to volunteer their time, and local community officials or representatives may not have the resources to engage them. It is becoming more common for government agencies to compensate communities for their time and expertise through stipends, offering food and drinks at meetings, making childcare available, and facilitating grants and technical assistance when available (CSCC, 2022; Daley and Reames, 2015; EPA, 2023e). Governments can work with communities to determine if assistance from technical experts would be more beneficial than assistance from those with lived experience, noting the history of racism as both an input and output from academia (Rahman, Sunder, and Jackson, 2022). Academia is exploring how to institutionalize concepts such as diversity, equity, and inclusion, critical race theory, and community engagement (Asmelash, 2023). However, institutionalizing these concepts and frameworks may have negative results, such as devaluing information about lived experience gained through community validation.
Whereas community engagement is vital, meaningful engagement programs could require significant resources and capacities. Given the scale and scope of national-level EJ tools, tool developers will need to consult experts in community engagement and rely on, for example, advisory panels to help design appropriate programs tailored for an individual tool. Because in-depth engagement cannot realistically occur at the national level with all communities represented by a tool, methods to identify representative communities, to design tool feedback methodologies, and to validate decisions made during indicator construction will necessarily be important in the design of an engagement program.
Ground Truthing
In mapping applications, ground truthing refers to the collection of reference data tied to specific locations on Earth’s surface used to gauge the validity of a theoretical model (e.g., Yonto and Schuch, 2020). In the context of EJ tools, the concept includes the traditional testing of theoretical models with empirical data and expands beyond it. It involves a partnership between researchers and community members (Sadd et al., 2014). An effective ground-truthing method is through CBPR, as outlined by ERIC and other research groups (Hacker, 2013; Israel et al., 2005; Leung, Yen, and Minkler, 2004). CBPR involves researcher-community collaborations to collectively select research questions, design studies, collect data, interpret findings, and disseminate results to protect public health and inform public policy (Israel et al., 1994). This approach involves key interested and affected parties in multiple qualitative and quantitative aspects of research to bring about change, such as model refinement. Box 7.3 discusses opportunities for ground truthing in CEJST.
Advisory Panels
Advisory panels (or workgroups) are often established to provide guidance during the construction or management of EJ tools and can be used as another mechanism for validating tools and their results. Advisory groups often include representatives from academic, community, government, nonprofit, and other organizations. U.S. states such as Massachusetts, Minnesota, Connecticut, Pennsylvania, and California have organized their advisory panels to ensure meaningful public participation related to government decisions (Daley and Reames, 2015). For example, the California Environmental Protection Agency formed the Cumulative Impacts and Precautionary Approaches (CIPA) workgroup,9 an external multidisciplinary stakeholder group that included perspectives from academia, industry, EJ, and community organizations. They provided input on approaches to evaluating cumulative impacts from 2008 to 2013 and contributed to the California Office of Environmental Health Hazard Assessment’s report on cumu-
___________________
9 Information about the CIPA work group’s meeting on June 5, 2008, can be found on the California Office of Environmental Health Hazard Assessment’s website at https://oehha.ca.gov/calenviroscreen/workgroup/cipa-meeting-june-5-2008 (accessed January 31, 2024).
BOX 7.3
Ground Truthing Opportunities for CEJST
Using ground-truthed datasets increases the validity of the tool. The CEJST Technical Support Document (CEQ, 2022a) does not indicate the number of CEJST input datasets that have undergone ground truthing. CEJST draws from several existing data systems and from other EJ tools, including the U.S. Environmental Protection Agency’s Environmental Justice Screening and Mapping tool, known as EJScreen.a Some of those data have been validated through ground truthing (Rowangould et al., 2019; Sadd et al., 2015). For example, Sadd and others (2015) evaluated three cumulative impacts with EJ tools in California for hazardous waste facility locational accuracy and found location errors of up to 10 km. As CEQ considers validating input datasets and output measures of disadvantage, they can build on existing ground-truthing approaches to achieve greater validity. Detailed documentation regarding ground truthing and other forms of validation will increase transparency and increase the tool’s legitimacy.
__________________
a EJScreen and other EJ tools are discussed in more detail in Chapter 4. See also EJScreen’s website at https://www.epa.gov/ejscreen (accessed February 16, 2024).
lative impacts (Alexeef et al., 2012). That report proposed the methodology used in CalEnviroScreen for identifying disproportionately burdened communities. The White House Environmental Justice Advisory Council (WHEJAC)10 functions as an advisory panel for CEJST, Justice40, and other environmental justice topics. In 2021, WHEJAC submitted a recommendations report to CEQ pertaining to Executive Order 12898, Justice40, and CEJST, which provided recommendations to improve these tools and policies (WHEJAC, 2021). Box 7.4 provides information about WHEJAC and community engagement in CEJST.
Mixed Methods
The methods described above result in a combination of quantitative and qualitative data that need to be integrated to both strengthen data types and offset the limitations of each. Research that combines the use of these data is called mixed-methods research. Mixed-methods approaches are rooted in the social sciences but have expanded into health and other fields. They are used to systematically integrate qualitative and quantitative data within one investigation and can be intertwined throughout the EJ tool
___________________
10 More information on the White House Environmental Justice Advisory Council (WHEJAC) can be found on EPA’s website at https://www.epa.gov/environmentaljustice/white-house-environmental-justice-advisory-council (accessed January 31, 2024).
BOX 7.4
CEQ and CEJST Community Engagement
CEQ engaged with communities before and during the development of the first version of CEJST. A major source of engagement has been through WHEJAC. CEQ states that many of these recommendations were adopted between the release of its beta and first versions of the CEJST. Changes included the addition of historical redlining data, the identification of Tribal nations, and the display of demographic information (CEQ, 2022b).
After the beta version of CEJST was publicly released, CEQ hosted a series of training webinars to give members of the public an opportunity to learn how to use the tool.a Concurrently, CEQ hosted a series of listening sessions “to seek input and feedback on the beta version of the tool, including on the datasets it includes and the methodology it uses.”a CEQ also stated on its public engagement page that this feedback would inform future updates of the tool so that it reflects conditions faced by communities. CEQ has promised future engagement opportunities.
__________________
a See the WHEJAC Charter at https://www.epa.gov/system/files/documents/2023-03/2023%20White%20House%20Environmental%20Justice%20Advisory%20Council%20Charter.pdf (accessed February 16, 2024).
development process. Wisdom and Creswell (2013), as part of the Agency for Healthcare Research and Quality,11 summarize the use, advantages, and limitations of mixed methods research. Although their research is focused on patient-centered medical home models, their methods can be adapted to EJ tool development and evaluation. They describe five core characteristics of well-designed mixed-methods studies:
- Collection and analysis of both qualitative and quantitative datasets;
- Rigorous collection and analysis procedures and criteria for each kind of data (e.g., data meet appropriate sample sizes for each type of data);
- Integration of data during all stages of research (e.g., during data collection, analysis, and discussion);
- Procedures that implement analyses of both quantitative and qualitative data types either sequentially or concurrently, and for the same or different datasets; and
___________________
11 See https://www.ahrq.gov/ (accessed March 13, 2024).
- Framing of research within theoretical or philosophical research models to better understand multiple perspectives of any single issue.
Mixed-methods research can result in comprehensive datasets that are multidisciplinary and it provides methodological flexibility for rigorous community validation of the tool and its results. However, as noted by Wisdom and Creswell (2013), the mixed methods have limitations. Because mixed-methods research is multidisciplinary, research can be more complex to design and implement; it can require more resources, labor, and time to ensure rigor. It may be difficult to locate qualitative experts and collect needed sample sizes, but the available datasets are more diverse. As described in Chapter 6, tool development and indicator construction rely on integrating different kinds of datasets resulting from different kinds of research. But because not all information that would benefit an EJ composite indicator is quantitative, mixed-method approaches provide the creative means to incorporate lived-experience data with statistical techniques. Although mixed methodologies challenge the status quo and may be difficult to plan and execute, their use will result in data interpretation and informed research practices that allow for the incorporation of lived experiences into data analyses while providing a pathway to tool validation.
LIVED EXPERIENCE AND CEJST
Lived experience represents the broader environmental conditions in which people live, work, worship, and play and cannot be understood from a single type of feedback or validation approach. EJ tools like CEJST can represent only aspects of the overall lived experience of communities. Efforts to gather lived-experience data can reveal how multiple indicators of burden may be related. During its public workshop held on June 5, 2023, proceedings of which are summarized in a separate document (NASEM, 2023a; see also Appendix B for the workshop agenda and list of participants), the study committee heard about the lived experiences of invited community members and others interested in and affected by CEJST. The purpose of the workshop was to explore how well data used in CEJST represent the lived experiences of historically marginalized and overburdened communities across the nation.
Input to Define the Concept to Be Measured
Although the Executive Order (E.O.) 14008 mandating the creation of CEJST by CEQ (EOP, 2021) stated that CEQ would develop a tool that would determine community disadvantage, it did not define community disadvantage. CEQ developed a definition that was consistent with the E.O., usable, and scientifically defensible. Multiple workshop participants questioned using census tracts as the spatial definition of community and unit of analysis, indicating that the census-tract scale lacks the granularity necessary to characterize their communities. Participants described that disparities experienced in their local communities were not recognized by CEJST because averaging values across the census tract for indicators (e.g., income) placed
the tract above CEJST’s low threshold. Community engagement could help refine the definitions of “community” and “community disadvantage,” which could then inform choices of scales, indicators, and analysis approaches. Communities would feel a sense of collaboration by having more input into how they are defined, and with better documentation of the engagement, the tool would gain trust, transparency, and legitimacy.
Community Input for Selecting Indicators
Participants of the committee’s information-gathering workshop (see Appendix B for the agenda and participant list) discussed issues or presented narratives about the burdens faced by their communities or the communities with which they work. Efforts to seek out such input by CEQ could inform the selection of new or different indicators and datasets that reflect lived experiences. Examples of issues discussed at the workshop are listed below, with more detail provided in the workshop Proceedings in Brief (NASEM, 2023a). Not all these examples can be measured currently with datasets that comply the CEJST data criteria.
- Nayamin Martinez, executive director of the Central California Environmental Justice Network, discussed the cumulative factors of heat, air pollution, pesticide exposure, and the reliance many California Central Valley communities have on evaporative “swamp” cooling systems that do not filter pollutants and exacerbate indoor air pollution.
- Loka Ashwood, associate professor at the University of Kentucky, referenced pollution issues in Burke County, Georgia, and that a census tract in this county hosts four nuclear reactors. That particular tract is not recognized by CEJST as disadvantaged because the CEJST legacy pollution category does not include data on nuclear reactors.
- Vi Waghiyi, member of the WHEJAC, explained that CEJST does not reflect the lived experience of her family and community in the Arctic, citing the impacts of persistent organic pollutants from ocean currents on her people’s food and water supplies.
Discussion among multiple workshop participants suggested that economic disparities can be captured with national income and poverty measures but are not currently reflected in CEJST.
Input to Define Indicator Integration
Community input can reveal the burdens of a particular community, measures for those burdens, and how those burdens combine to affect lived experiences. The input can inform tool developers regarding how to weight, aggregate, and analyze indicators. Participants at the committee’s information-gathering workshop (NASEM, 2023a) discussed the following issues and needs related to CEJST:
- The tool’s ability to understand cumulative impacts;
- Potential issues associated with the exclusive use of a single tool—especially one that employs a binary designation such as CEJST—to inform resource allocation to communities;
- The importance of differentiating among communities with more or fewer burdens;
- The appropriateness and implications of applying a uniform approach for designating a community as disadvantaged to the entire country (without the ability to distinguish between, for example, urban and rural communities);
- The inability to rank, prioritize, or micro-target communities with the greatest needs;
- The incorporation of community-based mapping; and
- Alternative ways of visually representing disadvantaged communities (e.g., the ability to look at results for different categories of burden or having a scale for magnitude of disadvantage).
Future CEQ efforts to engage with communities and gather and respond to their input iteratively could validate integration efforts and yield more legitimate results that reflect the communities being represented.
Input for Validation
Workshop participants discussed how well CEJST results compare to localized mapping efforts (NASEM, 2023a). Mathy Stanislaus and Alexis Schulman of the Environmental Collaboratory at Drexel University demonstrated that CEJST identified more areas as disadvantaged than their own Expanded Environmental Justice Index map for Philadelphia,12 but workshop participants acknowledged that CEJST may underrepresent disadvantage in other tracts. CEJST does not discern places with the highest disparity. This would be an example of using community engagement and input to “make sense of the data” (OECD and JRC, 2008, Step 9, as described in Chapter 3 of the present report); using data narratives and correlating the indicator with relevant, measurable phenomena to explain similarities and differences. This was described as convergent validation earlier in this chapter. No single tool will be able to represent every community perfectly, but seeking out this kind of input from community members and technical experts can help validate indicators and tool results.
Input Regarding Documentation
The CEJST map interface and documentation are important means of outward communication by CEQ. It is important for CEQ to determine the effectiveness of its communication through community engagement. The committee’s workshop included a hands-on CEJST exercise intended to gather input regarding tool results (for validation),
___________________
12 See https://greenlivingphl.com/ (accessed March 13, 2024).
but also regarding the user interface, functionality, and data accessibility (NASEM, 2023a). Some input gathered included that:
- A certain level of education and familiarity with indicators was required to navigate CEJST;
- CEJST could be more interactive when viewing community results, for example, by providing the ability to filter by a specific indicator or category; and
- CEJST could be made more accessible for vision-impaired users.
CEQ could engage with communities to validate its efforts and create greater trust, transparency, and legitimacy. Responding to input regarding user interfaces and the documentation that would be most helpful and informative will help CEQ create a more useful tool.
SUPPLEMENTAL ANALYSIS OF EXTERNAL VARIABLES
Supplemental analysis in the context of EJ tools refers to additional analysis or assessment conducted outside of the tool using independent external datasets. It is distinct from robustness analysis discussed in Chapter 6 for internally validating indicators during tool construction; supplemental analysis is useful for externally validating the outputs of EJ tools. A recent practical example of supplemental analysis in tool development validation was a comparison of COVID-19 testing and positive case rates from a county public health summary dashboard with cumulative impact ratings from the Washington State Environmental Health Disparities Map13 (Ingram et al., 2022). Analysis combining information from both tools allowed investigators to correlate COVID-19 positivity, low testing rates, census tracts with a greater proportion of people of color, low socioeconomic status outcomes, poor community health outcomes, and higher levels of PM2.5. Whereas this work was a first attempt at understanding the relationship between a particular disease and environmental exposures, it demonstrates how a tool developer might conduct similar techniques to test model validity. A more common example of supplemental analysis as validation are comparisons of metrics of environmental inequality and life expectancy. In these cases, the relationships of measures of burden to premature mortality are validated. The comparisons may be, for example, between pollution and income inequality (Hill et al., 2019) or the built environment (Kim, B. et al., 2023). These types of analysis involve evaluating the output of a measure against life expectancy, an external variable. The findings are consistent with longstanding claims from environmental justice leaders that EJ community members have shorter lifespans (Bullard, 2001).
___________________
13 See https://doh.wa.gov/data-and-statistical-reports/washington-tracking-network-wtn/washington-environmental-health-disparities-map (accessed March 14, 2024).
Purpose of Supplemental Analysis
Supplemental analysis of external variables can lead to multiple benefits, including a greater understanding of sociodemographic composition, determinants of health in communities identified, and in-depth case studies that generate localized narratives (Cushing et al., 2015; Prochaska et al., 2014; Williams et al., 2022). Supplemental analyses can also address fundamental questions about the impacts or implications of tool construction, including questions about the relationship between race/ethnicity and measures of environmental justice. For example, supplemental analysis comparing the distribution of race/ethnicity indicators and CEJST outputs could help CEQ tool developers gain a greater understanding of how well CEJST captures community disadvantage in its current formulation. Researchers at the Bullard Center for Environmental Justice developed an interactive map that does this.14 The map overlays proportional symbols showing the number of CEJST categories exceeded with choropleth symbols showing the percent people of color in communities. This map is a simple yet powerful example of supplemental analysis of CEJST and race/ethnicity, revealing relationships between indicators of burden and concentrations of people of color.
Because race is an important predictor of some environmental disparities, as discussed in Chapter 2, this analysis could help tool developers check their own indicator data sources for potential gaps or inaccuracies. Chapter 5 of this report describes the range of indicators or measures of racism that could be considered by CEQ tool developers. Future iterations of the tool might be refined in response to supplemental analyses which, in turn, could result in a tool more valid tool. Publication of supplemental analyses results regarding the relationship between race/ethnicity and CEJST would show CEQ responsiveness to public comments, increasing trust in the tool development process and tool results.
The next section provides an example of supplemental analysis applied to CEJST, showing relationships between the tool and racial/ethnic composition across communities in the country. It discusses the use of race and ethnicity data along with CEJST results to show the longstanding relationship between pollution and people of color in this country.
Supplemental Analysis: Disadvantaged Communities and Race/Ethnicity
Race reveals a stronger correlation than commonly used socioeconomic measures such as poverty (Bullard, 1993; Cutter, 1995; Mascarenhas, Grattet, and Mege, 2021; Mohai, Pellow, and Roberts, 2009; Commission for Racial Justice, 1987). Chapter 2 discusses the relationships between racism and unequal exposures and outcomes, as well as measuring racism. Chapter 5 notes that CEJST does not include indicators of race or ethnicity in determination of disadvantaged communities, but including race and ethnicity in CEJST has been raised during CEQ’s public comment period (McTarnaghan et al.,
___________________
14 See Bullard Center for Environmental and Climate Justice’s Historically Black Colleges and Universities (HBCU) Climate & Environmental Justice Screening Tool at https://cdu-gis.maps.arcgis.com/apps/instant/basic/index.html?appid=de6aa42f3ce24fb7999f2af01540be9f (accessed June 16, 2024).
2022) by environmental justice advocates and organizations (Chemnick, 2022; Shrestha, Rajpurohit, and Saha, 2023; Wang et al., 2023), and during the committee’s workshop (NASEM, 2023a). Instead, CEJST uses boundary data from the Home Owner’s Loan Corporation (HOLC; Aaronson et al., 2021) as an indicator of racial segregation and inequity. (See Box 2.1 for information on red lining.) However, this dataset is not sufficiently comprehensive to represent contemporary spatial patterns of race or racialized disadvantage (Mallach, 2024; Perry and Harshbarger, 2019). Measuring underlying processes of racism remains challenging due to the paucity of racism indicators, although developing such measures is a recent area of focus (Furtado et al., 2023). Appendix D includes examples of measures of segregation or racism that might be considered.
The California Office of Environmental Health Hazard Assessment (OEHHA) has conducted supplemental analysis of race and ethnicity alongside vintages of CalEnviroScreen since 2013 (CalEPA, 2021). The first version of CalEnviroScreen included race/ethnicity as an indicator, but that indicator was removed in an update to the tool (CalEPA, 2013). The change was made to “facilitate the use of the tool by government entities that may be restricted from considering race/ethnicity when making certain decisions.”15 However, in recognition of the relationship between race and environmental justice, a supplemental chapter was added describing the correlation between race/ethnicity and the pollution burdens of communities and the intention to update and expand that section as new versions of the tool are released. This position was maintained in subsequent versions of the tool.
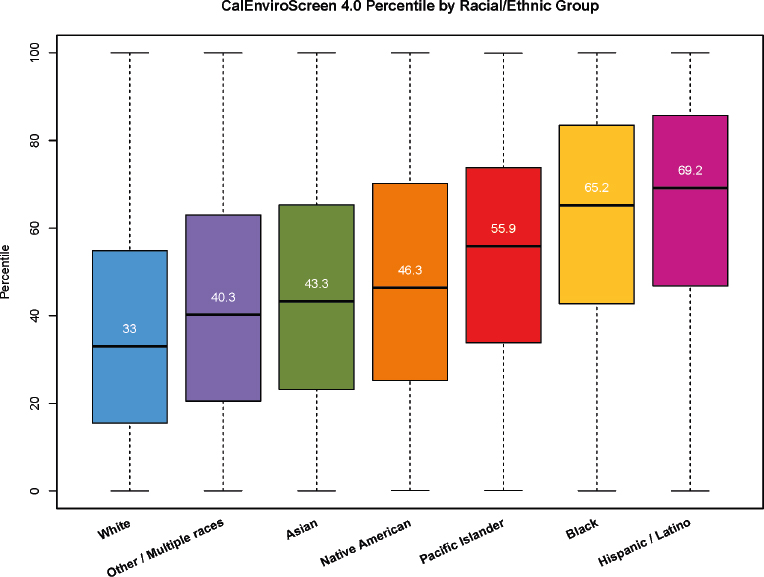
In the most recent release of CalEnviroScreen, their report states, “… CaTEnviroScreen 4.0 does not include indicators of race/ethnicity or age. However, the distribution of the CalEnviroScreen 4.0 cumulative impact scores by race or ethnicity is important. This information can be used to better understand issues related to environmental justice and racial equity in California.” They present relationships between the CalEnviroScreen cumulative impact score and Californians by race or ethnicity. Figure 7.1 shows all Californians when assigned a CalEnviroScreen cumulative impact index score (based on the census tract they reside in), grouped by race/ethnicity. All racial/ethnic groups have members living in communities with the lowest and highest overall CalEnviroScreen cumulative impact index scores, but the median CalEnviroScreen cumulative impact index scores are much higher for Latinos, Blacks, and Pacific Islanders than other groups, indicating greater experience of burden for those groups (CalEPA, 2021).
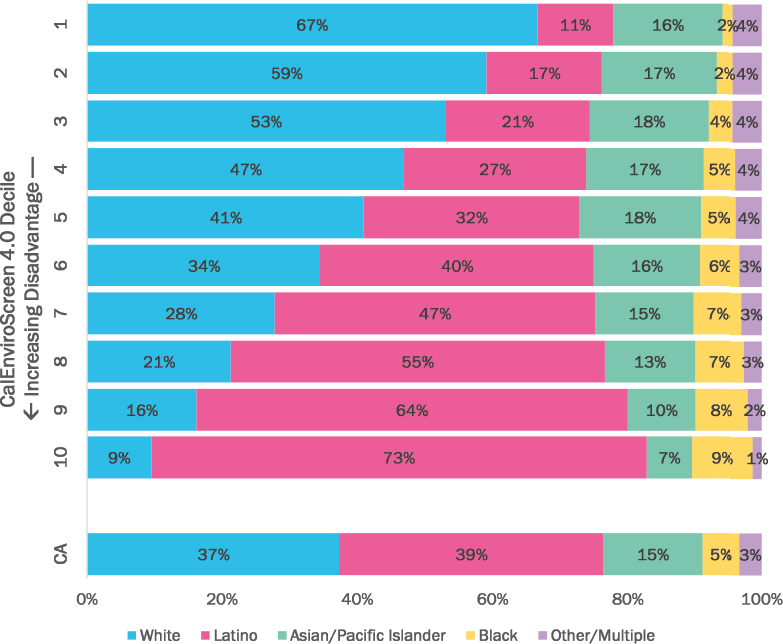
Figure 7.2 portrays supplemental analysis results that indicate the proportions of each racial/ethnic group residing within each decile percentile of CalEnviroScreen scores. Unlike CEJST, CalEnviroScreen uses a cumulative scoring that produces a continuous score for every census tract in the state. The topmost horizontal bar shows the racial/ethnic composition of the first decile, the least impacted census tracts in the state. Meanwhile, the 10th decile at the bottom of the chart shows the racial/ethnic makeup of the most impacted census tracts. The statewide racial/ethnic composition of California is shown at the bottom for reference. If burdens were distributed equally
___________________
15 See https://oehha.ca.gov/calenviroscreen/report-general-info/calenviroscreen-11 (accessed June 16, 2024).
among all groups, all bars from 1 to 10 would represent the same population proportions as found in the “CA” bar. However, the figure demonstrates that Latinos and African Americans disproportionately reside in highly impacted communities while other groups reside in less impacted communities. CEJST could conduct similar supplemental analyses. The binary (as opposed to cumulative) approach to designating disadvantage utilized in CEJST would require different analytical approaches than what is shown in CalEnviroScreen, but examining racial and ethnic disparities is still possible by CEQ.
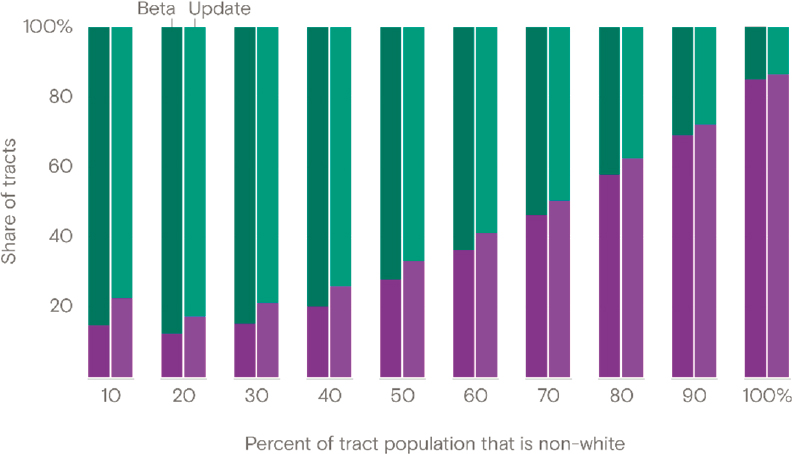
In response to criticisms about the absence of race as an indicator for disadvantaged communities, CEQ argued that their focus on income and environmental burdens would still effectively capture communities of color due to strong correlations between environmental and social inequities and the proportion of non-white residents (Friedman, 2022). Supplementary analyses of CEJST and the relationship of disadvantaged communities and their racial composition by journalists at Grist (Sadasivam and Aldern, 2022) and later at E&E News (Frank, 2023) lent support to the CEQ argument. These analyses showed a strong correlation between disadvantaged community status and the proportion of non-white residents: the higher the proportion of non-white residents, the higher the likelihood that a tract would be designated as disadvantaged (see Figure 7.3; Sadasivam, 2023). These findings might appear to validate assurances that the indica-
tors used by CEJST act as proxies for race without using race, echoing the findings for CalEnviroScreen described above. However, a more recent analysis by the World Resources Institute (WRI; Shrestha, Rajpurohit, and Saha 2023), shows that CEJST’s methods still underrepresent the degree of disadvantage and disparity for communities of color.
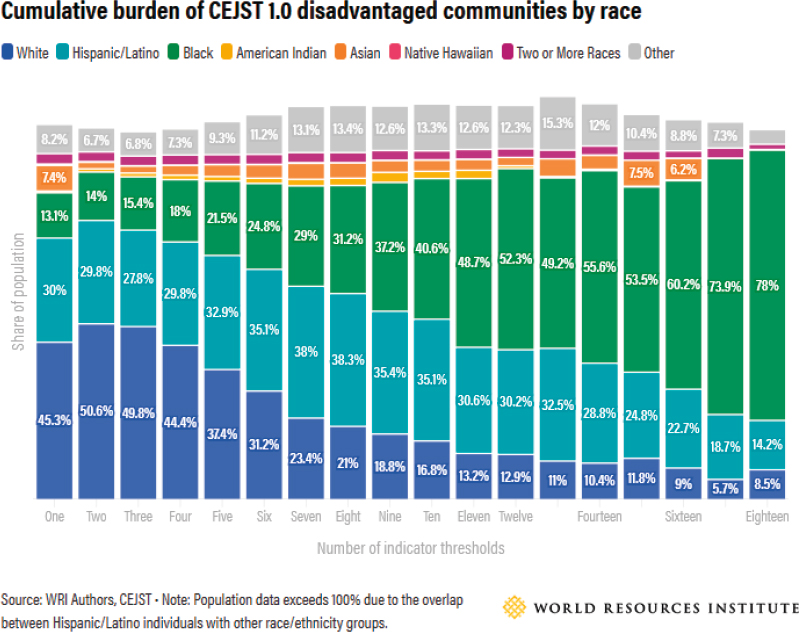
WRI did its own analysis of CEJST and examined tracts by the number of indicator thresholds exceeded and found a strong correlation between the number of indicator thresholds exceeded and the proportion of non-white residents: the higher the proportion of non-white residents, the greater the number of indicator thresholds exceeded (see Figure 7.4; Shrestha, Rajpurohit, and Saha 2023). The WRI report observed that in disadvantaged communities meeting at least one indicator threshold (i.e., the current methodology in CEJST), 45 percent of the population is white. By contrast, in com-
munities that meet the threshold for 10 indicators (which include 7.1 million residents or 7 percent of the population in disadvantaged communities), less than 17 percent of the population is white. The implication is that a cumulative approach to indicator construction would reveal greater disparities between communities that are overwhelmingly non-white and those that are overwhelmingly white. However, this pattern is not apparent or discernible based on how CEJST currently identifies disadvantaged communities. It should be noted that the WRI analysis also shows that this underrepresentation of racial disparity can be exacerbated as more burden indicators are added to the tool in its current formulation (Shrestha, Rajpurohit, and Saha 2023).
CHAPTER HIGHLIGHTS
Systematically identifying all burdens faced by communities throughout the country to determine if those communities are disadvantaged is challenging, and a certain amount of error in EJ tools is unavoidable. Tool validation techniques can be applied to allow tool developers to create a tool that is stable, accepted, and scientifically sound. Different validation approaches are available, for example:
- Convergent validation compares tool components or results with those of similar tools. They can take the form, for example, of correlation analysis of tool results.
- Community validation is an iterative process conducted through collaborative
- Mixed methods that allow collection and analysis of both qualitative and quantitative datasets are framed withing research models to better understand multiple perspectives of any issue and are well suited for tool validation. Although mixed methods challenge the “traditional” scientific mindset focused on quantitative data, their use will result in data interpretation and informed research practices that allow for the incorporation of lived experiences into data analyses.
engagement with communities to compare how well the tool reflects lived experiences. Consistent engagement throughout the tool development or upgrading process allows developers to test decisions, approaches, and tool results against community member narratives, while empowering communities to accept or refute definitions being assigned to them and gaining trust in the tool development process.
Supplemental analysis in the context of EJ tools refers to additional analysis or assessment conducted outside of the tool using independent external datasets. Many benefits can derive from supplemental analysis including a greater understanding of sociodemographic composition, determinants of health in communities identified, and generation of localized narratives and in-depth case studies. CEQ might conduct supplemental analysis to, for example, compare the distribution of race/ethnicity indicators and CEJST outputs to test the validity of CEJST’s current formulation. Such analysis could help tool developers check indicator data sources for potential gaps or inaccuracies. Future iterations of a tool might be refined in response to analysis findings. Documentation of all validation efforts, including supplemental analysis will increase the transparency, trust, and legitimacy of the tool and show responsiveness to input received during community engagement.
This page intentionally left blank.


