Artificial Intelligence and the Future of Work (2025)
Chapter: 6 Measurement
6
Measurement
This chapter summarizes what needs to be observed about the impact of artificial intelligence (AI) on the workforce and economy, and it considers how successful such measurements are at present and what new data should be collected and made available for access. It describes the measurement and data access needs of key stakeholders (businesses, workers, policy makers, and the research community). The discussion explores data collected by the statistical agencies, administrative data housed in many government agencies, and new private-sector data sources from the increased digitization of economic activity.
Relative to the 2017 National Academies of Sciences, Engineering, and Medicine report1 that emphasized that in many respects those looking at data were “flying blind” about the impact of AI and automation on the economy, this report describes the enormous progress that has been made in the availability of data tracking the development and use of advanced technologies and their impact on firms and workers. The cornucopia of data provides rich new perspectives and opportunities. A primary challenge now is how to provide access in a manner that enables integration of the increasingly rich data sources. Still, important knowledge gaps remain that are described in this chapter as well.
Compared to 2017, it is now possible to answer (or at least analyze) a range of questions and issues to a much greater extent. Statistical agency survey data collection by the U.S. Census Bureau through the new Annual Business Survey (ABS), discussed in
___________________
1National Academies of Sciences, Engineering, and Medicine, 2017, Information Technology and the U.S. Workforce: Where Are We and Where Do We Go from Here? The National Academies Press, https://doi.org/10.17226/24649.
detail below, now provides periodic measures of adoption and use of AI and advanced technologies at the firm level. The modules in the ABS vary over time, including information on the motivation for adoption of these technologies as well as barriers and obstacles to adoption. The ABS is a large firm-level survey that can be and has been integrated with a wide range of other business-level and worker-level data housed at the Census Bureau. This integration enables exploring the relationship between adoption of advanced technologies and key firm- and worker-level outcomes such as productivity, job creation, job destruction, and earnings. In a related manner, the integration with other business- and worker-level sources enables investigating the connection between changes in technology and the changing structure of the economy on measures such as market concentration, markups, and earnings inequality.
Private-sector digitized data sources provide novel perspectives on the changing nature of work by, for example, analyzing the skills and task requirements of job openings (scraped from the web). With machine learning methods, the requirements for skills and tasks involving AI and other advanced technologies can be identified. Other private data sources (e.g., ADP and LinkedIn) provide further insights into the changing nature of work.
Administrative data sources provide yet another rich source of information. For example, patent data from the U.S. Patent and Trademark Office now have been integrated into the longitudinal matched employer–employee data (i.e., Longitudinal Employer–Household Dynamics) at the Census Bureau. This data integration permits the tracking of inventors at the person and firm levels. The quality of patents for advanced technologies can be measured by the degree of citation for patents. Transformational versus incremental patents can be identified depending on whether primarily self-citations (within inventor/firm) or citations across inventors and firms exist. Clustering of inventors can be measured at specific firms and locations. The impact of patents on a wide range of outcomes at the firm, worker, and industry levels can be explored.
Substantial knowledge gaps and challenges remain for economics measurement and analysis of the impact of changing technology on the workforce. First, data access and integration of disparate sources are core challenges. Second, there are critical knowledge gaps in several areas. One is to measure the complementary intangible capital investments that inherently accompany adoption of new technologies. Historically, changes in the organization of firms adopting new technologies have been on many dimensions. The telegraph facilitated geographic dispersion of enterprises. The electric motor provided opportunities for factory designers to have greater flexibility in the placement of equipment. More recently, scanner data provided retailers and manufacturers with real-time tracking of sales, enabling changes in inventory management and distribution networks. Electronic data interchange, computer aided design, Internet-based
procurement systems, and other interorganizational information systems have made it easier, faster, and cheaper to interact with suppliers—thereby changing incentives for vertical integration as well as for use of globalized suppliers.
Research has shown that successful adopters of new technologies who make such changes in their organizational structure also change their worker mix and workplace practices, how workers interact with each other and equipment, and their hiring and training of workers.2,3,4 Finding the right mix of changes requires experimentation. Some firms inevitably will be more successful than others, so such experimentation typically yields restructuring and an accompanying shakeout process. Incumbents that have been successful under earlier technologies can find it challenging to change the firm and workplace culture to be successful with the new technologies.5
Measuring such intangible capital directly is inherently challenging and often is done indirectly (e.g., by constructing measures of the changes in the mix of capital and workers; the location of businesses; and the networks and relationships between businesses, between businesses and workers, and between businesses and customers). For the wave of technologies coming online now such as AI, it is unclear what organizational changes and other structural changes will emerge and in turn how best to track and measure these complementary intangible capital investments.6
Another knowledge gap reflects limited measurement of the task view of production and work. Traditional measurement of business and worker activity has focused on profits, employment (physical), capital investment, productivity, earnings, and skills by occupation and education. Productivity is measured as the output per unit of composite input (e.g., physical capital and labor). It has been increasingly recognized that quality adjustment of outputs and inputs is needed to measure productivity accurately. Adjusting for quality is especially important during periods of innovation in products and processes.7
___________________
2E. Brynjolfsson and L.M. Hitt, 2000, “Beyond Computation: Information Technology, Organizational Transformation and Business Performance,” Journal of Economic Perspectives 14(4):23–48.
3S.E. Black and L.M. Lynch, 2001, “How to Compete: The Impact of Workplace Practices and Information Technology on Productivity,” The Review of Economics and Statistics 83(3):434–445.
4E. Brynjolfsson, D. Rock, and C. Syverson, 2021, “The Productivity J-Curve: How Intangibles Complement General Purpose Technologies,” American Economic Journal: Macroeconomics 13(1):333–372.
5E. Brynjolfsson and L.M. Hitt, 2000, “Beyond Computation: Information Technology, Organizational Transformation and Business Performance,” Journal of Economic Perspectives 14(4):23–48.
6Some early work in this area is T. Babina, A. Fedyk, A.X. He, and J. Hodson, 2023, “Firm Investments in Artificial Intelligence Technologies and Changes in Workforce Composition,” NBER Working Paper No. 31325, June, National Bureau of Economic Research, https://doi.org/10.3386/w31325.
7See J. Fernald, 2015, “Productivity and Potential Output Before, During, and After the Great Recession,” pp. 1–51 in NBER Macroeconomics Annual 2014, J.A. Parker and M. Woodford, eds., University of Chicago Press; D.M. Byrne, J.G. Fernald, and M.B. Reinsdorf, 2016, “Does the United States Have a Productivity Slowdown or a Measurement Problem?” Brookings Papers on Economic Activity (1):109–182, https://doi.org/10.1353/eca.2016.0014; and G. Ehrlich, J.C. Haltiwanger, R.S. Jarmin, et al., 2023, “Quality Adjustment at Scale: Hedonic vs. Exact Demand-Based Price Indices,” NBER Working Paper No. 31309, June, National Bureau of Economic Research, https://doi.org/10.3386/w31309.
Recent research has emphasized that it is insightful to measure output and productivity by tracking the tasks accomplished by different inputs.8 This insight builds on historical studies of tasks9 and time and motion studies from Frederick Winslow Taylor10 in the early 20th century. This perspective is especially important to understand how adoption of advanced technologies (such as AI) affects the nature of production and work. Advanced technology adoption may substitute for or complement tasks accomplished by specific types of capital and labor. Measurement of tasks is an area that needs substantial work. Much effort has gone into mapping tasks to occupations (e.g., O*NET), with many insights emerging.11 However, the classification of occupations and the mapping to tasks is a slow-moving process, which is a limitation in times of rapidly changing technology.
A related ongoing challenge is for economics measurement to be sufficiently timely. The statistical agencies’ measurement of advanced technology in novel surveys such as the ABS is a major improvement, but the data are not very timely. Private data sources have the potential to provide real-time (or near real-time) tracking of the economy. The discussion below provides some ideas about how to improve the timeliness of data for tracking the impact of changing technology on the workforce.
This chapter proceeds as follows. The second section reviews new data sources—first from the statistical agencies and administrative sources, then from private entities. It also discusses how these data sources can be integrated with existing data sources to provide context for the impact of the changing structure of technology. The third section focuses on knowledge gaps and challenges.
NEW DATA SOURCES
Statistical Agencies
A major new data source is the ABS, first conducted in 2018. It is a large firm-level survey of a representative list of firms in the U.S. private sector. The ABS is conducted by the U.S. Bureau of the Census with the National Center for Science and Engineering Statistics at
___________________
8D. Acemoglu and P. Restrepo, 2018, “The Race Between Man and Machine: Implications of Technology for Growth, Factor Shares, and Employment,” American Economic Review 108(6):1488–1542.
9J. Atack, R.A. Margo, and P.W. Rhode, 2019, “‘Automation’ of Manufacturing in the Late Nineteenth Century: The Hand and Machine Labor Study,” Journal of Economic Perspectives 33(2):51–70.
10R. Kanigel, 2005, The One Best Way: Frederick Winslow Taylor and the Enigma of Efficiency, MIT Press.
11D. Acemoglu and D. Autor, 2011, “Skills, Tasks and Technologies: Implications for Employment and Earnings,” pp. 1043–1171 in Handbook of Labor Economics, Vol. 4, O. Ashenfelter and D. Card, eds., Elsevier. See also National Center for O*NET Development, n.d., “O*NET OnLine,” https://www.onetonline.org, accessed June 29, 2024; and D. Dorsey and S. Oppler, 2021, “An Occupational Taxonomic Approach to Assessing AI Capabilities,” in AI and the Future of Skills, Volume 1: Capabilities and Assessments, OECD Publishing, Paris, https://doi.org/10.1787/2c1d8961-en.
the National Science Foundation. In its first year, the ABS had a sample of 850,000 firms. From then on, the survey has had a sample of about 300,000 firms. The antecedents of the ABS are the Survey of Business Owners, Annual Survey of Entrepreneurs, and the innovation section of the Business R&D and Innovation Survey and the Business R&D and Innovation Survey–Microbusiness.
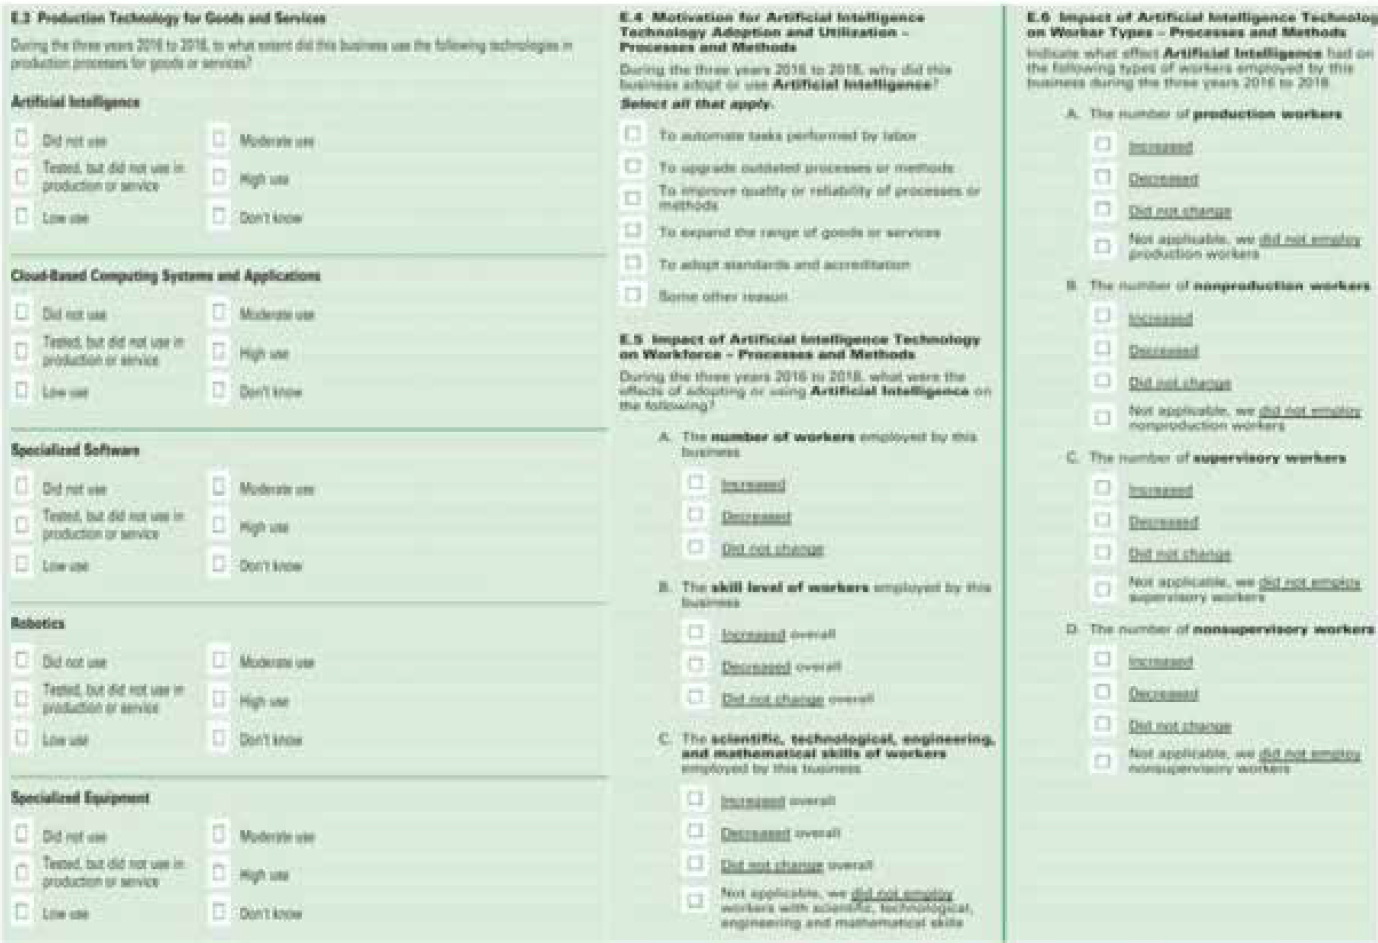
Critically, the ABS includes rotating modules on advanced technology use. These modules are designed in collaboration with leading experts in the field (e.g., the 2018 survey with a research team led by Erik Brynjolfsson and the 2019 survey with a research team led by Daron Acemoglu). Figure 6-1 shows the range of questions asked in the ABS. Given that it is a firm-level survey conducted by the Census Bureau, it can be and has been integrated with the full range of business administrative and survey data at the Census Bureau. This includes integration with the Longitudinal Business Database (LBD), which provides comprehensive information on firm-level jobs created by firm start-ups, firm expansion, firm contraction and firm exit, firm-level productivity, and earnings. Characteristics of firms include detailed industry, location, firm size, and firm age. The comprehensive nature of the LBD enables further integration with the Economic Censuses and ABSs in individual sectors. Examples include the Annual Survey of Manufactures (ASM), which permits measuring TFP at the micro level and has modules on robotics, and the Annual Capital Expenditures Survey (ACES), which provides details on capital expenditures. ACES includes details on expenditures on capital investments in advanced technologies.
Outcomes for workers as well as firms can be integrated with the ABS, ACES, and ASM data on firms’ adoption of and expenditures on advanced technologies. For example, these data on firms’ technology use can be integrated with the longitudinal matched employer–employee data that permit tracking of worker outcomes such as hires; separations; earnings; and worker characteristics such as worker age, gender, education, and occupation (from U.S. Census Bureau household surveys).
Rich new facts have already emerged from these new sources. For example, the ABS 2019 (reference year 2018) provides much information about the extent of adoption as well as the motivation for adoption of technologies such as AI and robotics.12
Adoption of AI in the 2016–2018 period is relatively rare, with only about 3.2 percent of firms using AI in production (see Figure 6-2). This small fraction is somewhat misleading because larger firms were more likely to adopt, with 12.6 percent of workers employed at adopting firms. Adoption and exposure are substantially larger in the information sector, with a firm-level adoption rate of 8 percent and 30 percent of workers employed at adopting firms.
___________________
12D. Acemoglu, G.W. Anderson, D.N. Beede, et al., 2022, “Automation and the Workforce: A Firm-Level View from the 2019 Annual Business Survey,” NBER Working Paper No. 30659, November, National Bureau of Economic Research, https://doi.org/10.3386/w30659.
SOURCE: Extracted from U.S. Bureau of the Census, 2019, “2019 Annual Business Survey Questionnaire,” https://www2.census.gov/programs-surveys/abs/information/abs_2019.pdf.
More mature advanced technologies exhibit higher adoption and worker exposure rates, especially in some sectors. Cloud computing has a firm adoption rate of 34 percent, and 62 percent of workers are at firms where cloud computing has been adopted. In the information sector, the firm adoption rate is more than 60 percent, and the worker exposure rate is about 80 percent. Robotics is mostly concentrated in manufacturing, with a firm adoption rate of 9 percent and a worker exposure rate of 45 percent.
Firms cite automation as a key driver for the adoption of AI and robotics, and to a smaller degree for the adoption of dedicated equipment and specialized software. About 30 percent of U.S. workers are employed at firms that use advanced technologies for automation. Moreover, firms often state that this adoption is to substitute for tasks previously conducted by workers. Firms that have adopted advanced technologies for automation have higher labor productivity, lower labor share, and higher wages than businesses of similar size and age in the same specific industry sector. Self-assessments by firms “point to an increase in the relative demand for skill but limited or ambiguous
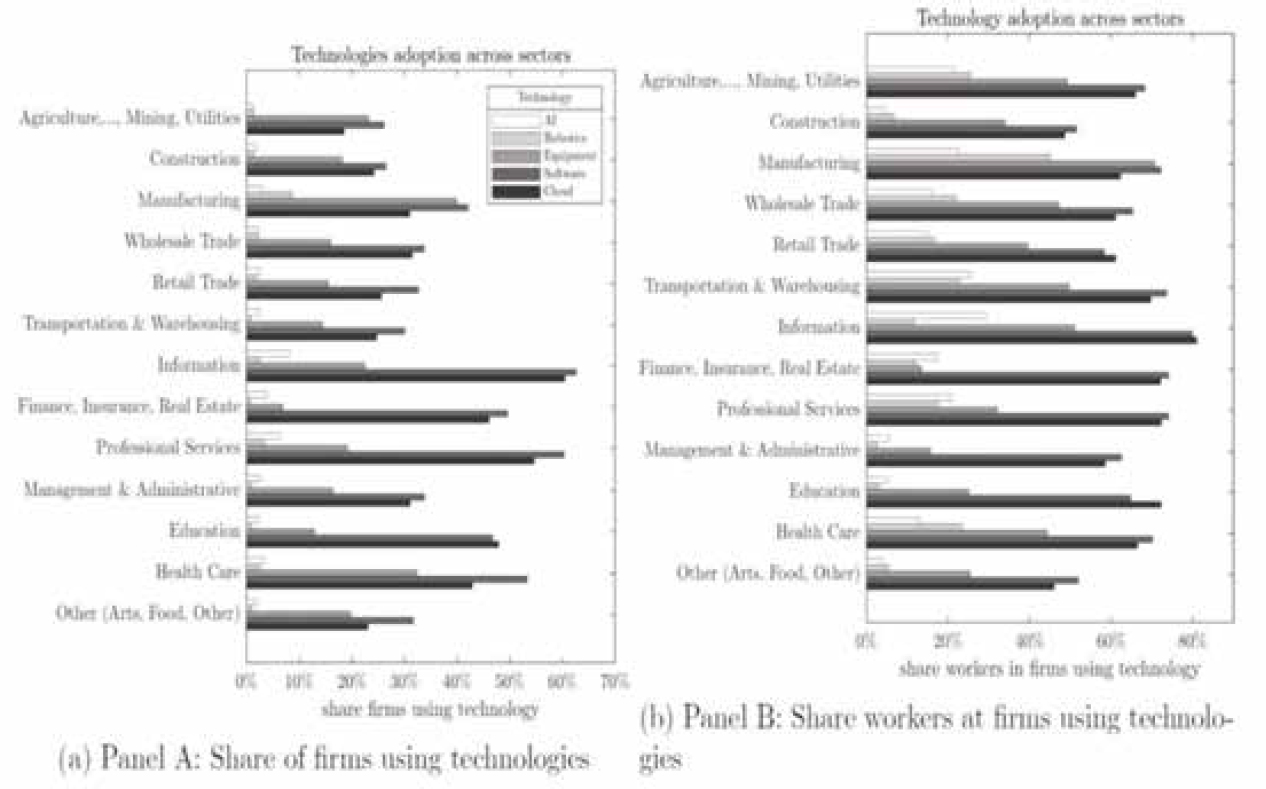
SOURCE: Figure 1 in D. Acemoglu, G.W. Anderson, D.N. Beede, et al., 2022, “Automation and the Workforce: A Firm-Level View from the 2019 Annual Business Survey,” NBER Working Paper No. 30659, November, National Bureau of Economic Research, https://doi.org/10.3386/w30659; forthcoming in 2025 in Technology, Productivity, and Economic Growth, Studies in Income and Wealth, Vol. 83, S. Basu, L. Eldridge, J. Haltiwanger, and E. Strassner, eds., University of Chicago Press, https://doi.org/10.3386/w30659.
effect on their employment level.”13 Interestingly, automation is not the primary reason firms indicate for adopting AI. Rather, the primary reason is to improve quality and processes. This includes a significant share of firms with motivation to improve quality, add new goods, and improve processes without automation.14
This type of large-scale representative information on AI and other advanced information technology use is novel and extremely valuable. However, the ABS, ACES, and ASM data are not very timely. Alternative existing or new sources that enable timelier tracking of the development and use of AI and advanced technologies are discussed below.
___________________
13D. Acemoglu, G.W. Anderson, D.N. Beede, et al., 2022, “Automation and the Workforce: A Firm-Level View from the 2019 Annual Business Survey,” NBER Working Paper No. 30659, November, National Bureau of Economic Research, https://doi.org/10.3386/w30659.
14Ibid, Figure 4.
New Digitized Data from the Private Sector
The digitization of economic activity has become widespread, offering novel tracking of economic activity. Firms increasingly are using companies such as ADP to handle their processing of payroll. This has led to the development of a rich alternative data source that tracks employment dynamics in the United States. ADP releases a national private-sector employment report (in partnership with the Stanford Digital Economy Lab) based on weekly ADP payroll data covering more than a half a million companies with more than 25 million employees on the Wednesday before the highly visible payroll report by the U.S. Bureau of Labor Statistics (BLS). While the latter is the standard, the underlying microdata from ADP offer great promise as they enable a real-time, matched employer–employee data infrastructure tracking employment, payroll, industry, location, and occupation. In contrast, the Current Employment Statistics (Establishment Survey) (CES) is a large-scale survey of establishments (about 300,000 per month), with limited information on employment, payroll, and hours and accompanying information on industry and location.
Other high-frequency and timely sources for tracking the workforce include Lightcast (formerly Burning Glass), which offers a comprehensive web-based scraping of job postings in the United States. The information collected provides novel insights in essentially real time into the skills and tasks needed. An advantage of these data relative to the occupation and task data from the statistical agencies is that they are much more flexible in capturing changes in the mix of skills and tasks as new technologies are being developed and adopted.
A potential limitation of these sources is their representativeness. Although ADP and Lightcast cover a large number of businesses and openings, a strength of the statistical agencies is that they have core benchmark sources that enable their statistics to be tied to the population of businesses and households.
Despite this limitation, private-sector data can complement the representativeness of public data sources. For example, Cajner and colleagues assess the quality of ADP data compared to the CES and the Quarterly Census of Employment and Wages (QCEW) produced by the BLS.15 The QCEW provides a near-complete tally of businesses and employment in the United States, but it is released with an approximate 6-month lag, reducing its effectiveness as a policy tool. The researchers find that the ADP sample provides a better representation relative to the QCEW for smaller firms than the CES.
A similar example of complementarity is shown in the job postings data collected by Lightcast, which aggregates data from 51,000 job boards and company websites at a
___________________
15T. Cajner, L.D. Crane, R. Decker, A. Hamins-Puertolas, C.J. Kurz, and T. Radler, 2018, “Using Payroll Processor Microdata to Measure Aggregate Labor Market Activity,” FEDS Working Paper No. 2018-5, http://dx.doi.org/10.17016/FEDS.2018.005.
daily frequency.16 Its methodology builds on and expands the O*NET taxonomy to better leverage two key features of its postings data: granularity and high frequency. The full Lightcast product is updated every 2 weeks. In the rapid world of AI generation, innovation, and adoption, high-frequency taxonomies are equipped to keep pace.
The downside of private-sector taxonomy is the lack of standardization across other private- and public-sector sources of occupational skill attributes. Social media sources of self-reported skills on websites such as Indeed, LinkedIn, and ZipRecruiter can provide both skill demand by companies and skill supply by workers.
For example, from user-generated data, LinkedIn has offered through its partnership program data covering 100,000 users in 148 countries, providing information on 39,000 skills spanning more than 374,000 aliases (i.e., different ways to refer to the same skill).17 This feature allows for the observability of skill creation and destruction in near real time on national and global scales.
As promising as new sources of data are, the lack of standardization across private and public data sources could be an impediment to broad-based analysis unless these sources are integrated into a consistent framework. The potential of blended data is that rich new data from government and private sources can be integrated at various levels of aggregation (industry, location, occupation, and in some cases micro level).
Blended data have become essential features of the national statistical infrastructure in general,18 but the rapid evolution of AI technologies adds the complexity of combining slow-moving and largely survey-based public sources with customer-driven company transaction–based inputs that produce quickly evolving and idiosyncratic private taxonomies. AI technologies may be useful in developing new methods for blending.
A related but distinct limitation discussed in more detail below is data access. While some access has been provided to researchers on a case-by-case basis and new data products have been produced, the private-sector data sources are proprietary and sharing and integration of these novel sources with federal and state agency survey and administrative data is challenging.
As an additional note, AI can be used to improve the information available to firms, workers, and others in making decisions. For example, WorkRise, hosted by the Urban Institute, is an innovative research and action network on jobs, workers, and mobility.19
___________________
16The website for Lightcast is https://lightcast.io/about/data, accessed June 29, 2024.
17S. Macskássy, Y. Pan, J. Yan, Y. Li, D. Zhou, and S. Lin, 2022, “Building LinkedIn’s Skills Graph to Power a Skills-First World,” LinkedIn Engineering Blog, November 30, https://www.linkedin.com/blog/engineering/skills-graph/building-linkedin-s-skills-graph-to-power-a-skills-first-world.
18National Academies of Sciences, Engineering, and Medicine, 2023, Toward a 21st Century National Data Infrastructure: Mobilizing Information for the Common Good, The National Academies Press, https://doi.org/10.17226/26688.
19The website for WorkRise is https://www.workrisenetwork.org/working-knowledge/topics/job-search-and-matching, accessed June 29, 2024.
The objective is to use online platforms assisted by AI to improve the matching of firms seeking workers with workers seeking jobs.
KNOWLEDGE GAPS AND CHALLENGES
Although great progress has been made, many knowledge gaps and challenges remain. An important knowledge gap relates to tracking the tasks and processes for which AI is being used. AI use varies both between firms and within firms across employees. Quantifying both the between-firm and within-firm heterogeneity is important. Firm-level surveys such as the ABS and the Business Trends and Outlook Survey (BTOS) are asking questions about the tasks for which AI is being used and the intensity of use, but this remains an ongoing knowledge gap and challenge.
Another important knowledge gap relates to measuring and tracking the investments in complementary intangible assets that have been shown to be critically important in the adoption of new technologies—especially new general-purpose technologies. These intangible assets are inherently difficult to measure, especially because they include changes in the organizational structure of firms. Measuring organizational changes is difficult, especially because the successful organizational changes that will accompany the latest innovations (i.e., AI) are uncertain. It was only in retrospect that it became clear what organizational changes accompanied successful adoption of information technology in the 1980s and 1990s.
To understand productivity and economic growth, it is important to measure and model intangible capital. The most comprehensive definition of intangible capital comes from Corrado and colleagues.20 Their characterization is summarized by Haltiwanger as follows:
Intangible capital investment includes any inputs into future rather than current period production. In practice, the measurement of intangible capital has focused on key but limited components of such inputs: R&D, training, and brand capital.21
Measurement of organizational capital investments is less straightforward. The U.S. statistical agencies have helped contribute to measuring such activity, but there is ample scope for further measurement efforts. For example, young businesses, especially
___________________
20C. Corrado, C. Hulten, and D. Sichel, 2009, “Intangible Capital and U.S. Economic Growth,” Review of Income and Wealth 55(3):661–685.
21J. Haltiwanger, 2023, “Reflections on FESAC (Federal Economic Statistical Advisory Committee) ‘Ongoing Topics,’” Federal Economic Statistics Advisory Committee, June 9, https://apps.bea.gov/fesac/meetings/2023-06-09/reflections-on-ongoing-topics-for-fesac-6-9-23.pdf.
innovation-intensive industries, are inherently engaged in intangible capital investment in that they are developing products and processes for the future. Such investments are not well captured in current economic measurement. For organizational changes accompanying AI and automation, both the concepts and the measurement of accompanying intangible capital investment need attention.
The evidence on adoption of AI22 highlights heterogeneity in patterns by sector and across firms within sectors. Agrawal and colleagues highlight that such heterogeneous patterns are inherently part of the adoption dynamics of new technologies including GPTs.23 As they note, the benefits and costs of adopting GPTs are distinct across specific applications and will vary across sectors and firms within sectors. A measurement challenge is to quantify the nature of such heterogeneity in adoption patterns along with information on the idiosyncratic benefits and costs of adoption. The implications of AI adoption for productivity and its impact on the workforce depend not only on the average rate of adoption but also on the heterogeneous nature of adoption.
Another core, but not new, challenge is that the measurement of productivity and real output growth from advanced technology is limited by methodology and source data. The statistical agencies measure productivity using survey and measurement methods largely developed in the mid-20th century. These methods are better suited to measuring productivity and growth in the goods-producing sectors such as manufacturing, although they have limitations even for U.S. manufacturing given the challenges U.S. statistical agencies have in integrating their business data.24 But for services (and much of the technology advancements in the 21st century developed and used in service sectors), these limitations are even more severe. An added complication is that the survey-centric approach of the 20th century is becoming less tenable given falling response rates on household and business surveys.
As already noted, data integration is a challenge not only between the statistical agencies but also with administrative and private-sector sources. Overcoming this challenge is of great importance because bringing together the needed information and overcoming the timeliness challenge of the statistical agencies (compared to private-sector sources of real-time data) are critical. Statistical agency sources are representative
___________________
22D. Acemoglu, G.W. Anderson, D.N. Beede, et al., 2022, “Automation and the Workforce: A Firm-Level View from the 2019 Annual Business Survey,” NBER Working Paper No. 30659, November, National Bureau of Economic Research, https://doi.org/10.3386/w30659.
23A.K. Agrawal, J.S. Gans, and A. Goldfarb, 2023, “Similarities and Differences in the Adoption of General Purpose Technologies,” NBER Working Paper No. 30976.
24Although the Bureau of Economic Analysis, BLS, and the Census Bureau are covered by common privacy and confidentiality protections under the Confidential Information Protection and Statistical Efficiency Act, which was passed to facilitate the sharing of their business data, the legislation that would enable the sharing of the federal tax information that underlies the Census Business Register (used for all Census business surveys) has yet to be passed. An implication of this restriction is that BLS and the Census Bureau have different business registers that are used for their respective business surveys. Research has shown that there are substantial discrepancies in the measurement of economic activity by location and industry.
but slow while private-sector sources have open questions about representativeness. An important issue is providing incentives for private-sector firms to share their data. Using secure remote computing is one option. Another is to enable private-sector firms to learn more about themselves and their data through such data integration.
ADDRESSING KNOWLEDGE GAPS
Several steps could be taken to help overcome these knowledge gaps and challenges. Enabling the legislation for the statistical agencies to share their business data (see footnote 24) would be a big step and would also facilitate integration of data from external (e.g., private sector) data sources. Even if the statistical agencies can share their business data, much work needs to be done to reconcile the data because the agencies have developed independent business data infrastructures. Data integration has particular value for tracking the impacts of advanced technologies such as AI on the workforce. Substantial insights could be gained by integrating business surveys at the Census Bureau that track technology and business outcomes with the business surveys at BLS that track earnings, employment, hours, and occupation. Integration of firm-level surveys with employee-level information about the tasks and processes for which AI is intensively being used is important. An open question is whether such information can be collected with sufficient probing questions about tasks and processes in firm-level surveys. Employee-level data from surveys or other sources are likely needed, and in turn that information would be integrated with firm-level data sources.
In addition, beyond integration and reconciliation of the data across the agencies, access to such data is still limited. The Federal Statistical Research Data Centers provide access to multiple agencies’ proprietary data for approved projects, but typically data from multiple agencies cannot be integrated in a research project. Advanced technology has the promise of facilitating the integration of data from disparate sources as well as access to such data. For instance, machine learning can be used for integrating data from disparate sources. Furthermore, multiparty secure computing could be used to permit data users to tap into data sources from multiple providers while preserving privacy and confidentiality.25
Periodic modules on AI, automation, and tasks could be used to fill knowledge gaps on both household and business surveys in a timelier manner. The COVID-19 pandemic showed that the BLS and Census Bureau could put timely household and business surveys in the field (e.g., the Census Bureau’s Business and Household Pulse
___________________
25Related to these objectives is the agenda of the Evidence-Based Policymaking Commission Act of 2016, P.L. 114-140.
surveys and the BLS Business Response Survey) and pivot questions to the rapidly changing conditions. Building on that approach, it would be useful to have periodic modules on AI and automation use in timely surveys such as the new BTOS conducted by the Census Bureau. The BTOS survey is conducted every 2 weeks, with sampled respondents rotating so that an individual business responds to questions every 12 weeks. It is a large survey, with 200,000 businesses surveyed in each 2-week round. Data are released biweekly on an almost real-time basis. A promising step in that direction is that the Census Bureau added questions on both current and future AI use to the fall 2023 survey.26
Timelier data are feasible from administrative sources as well. Enhancement of the new Business Formation Statistics (BFS) from the Census Bureau could be very beneficial. The BFS tracks the universe of applications for new businesses in an almost real-time manner. For example, the monthly BFS is released within 2 weeks of the end of each reference month. The BFS already provides novel data on the location and industry for business formation. Young businesses play a critical role in innovation and experimentation of new technologies.27 The BFS statistics show a surge in new business formation since 2020 persisting through April 2023. Some of this reflects the changing nature of work and lifestyles during and after the COVID-19 pandemic. However, there has also been a surge in the nonmanufacturing high-tech industries such as the information sector and the professional, scientific, and technical sector.28 Write-in information on the applications could be used to track businesses entering to develop specific new technologies (e.g., AI).
The core administrative data on payroll and unemployment insurance (UI) taxes that underlie the tracking of U.S. business activity have the potential to be timelier. Currently, BLS and the Census Bureau use these data to build their business registers and to produce key high value–added data products such as QCEW, County Business Patterns (CBP), the BLS Business Employment Dynamics (BED), and the Census Bureau Business Dynamics Statistics (BDS). However, the data are not timely. Tracking business dynamics is complicated and takes time to do correctly. However, administrative data are available on an almost real-time basis from quarterly payroll and UI tax reports filed
___________________
26See https://www.census.gov/hfp/btos/downloads/BTOS%20Content%20V2%20Supplement%2011.29.2023_Watermarked.pdf, accessed June 29, 2024.
27See, for example, R. Decker, J. Haltiwanger, R. Jarmin, and J. Miranda, 2014, “The Role of Entrepreneurship in US Job Creation and Economic Dynamism,” Journal of Economic Perspectives 28(3):3–24, https://doi.org/10.1257/jep.28.3.3; L. Foster, C. Grim, and N.J. Zolas, 2016, “A Portrait of Firms That Invest in R&D,” U.S. Census Bureau Center for Economic Studies Paper No. CES-WP-16-41, http://dx.doi.org/10.2139/ssrn.2845982; and D. Acemoglu, U. Akcigit, H. Alp, N. Bloom, and W. Kerr, 2018, “Innovation, Reallocation, and Growth,” American Economic Review 108(11):3450–3491, https://doi.org/10.1257/aer.20130470.
28AI businesses are likely to be classified in one of these two sectors. For discussions of the surge in business formation in the past few years, see R. Decker and J. Haltiwanger, 2023, “Surging Business Formation in the Pandemic: Causes and Consequences?” Brookings Papers on Economic Activity, Fall:249–302, https://www.brookings.edu/wp-content/uploads/2023/09/Decker-Haltiwanger_16820-BPEA-FA23_WEB.pdf.
by employers.29 Although this information is not a substitute for the benchmark statistics underlying CBP, BDS, QCEW, and BED, it could be a useful and timely complement. Moreover, modeling the relationship between the gold standard benchmark statistics and the real-time flow, potentially along with other sources (see below), appears to be a promising approach.30,31
Timelier processing of administrative data that permits tracking of alternative work arrangements, independent contractors, freelance work, and the gig economy is needed. AI has the potential to change the incentives for alternative work arrangements substantially for both firms and workers. The Census Bureau’s nonemployer statistics and the Internal Revenue Service/Statistics of Income–related data are rich sources for this activity (both the microdata available for restricted-use approved projects and published statistics). However, the data are not timely (e.g., the public nonemployer statistics from the census for 2020 were just being published in summer 2023). The Current Population Survey tracks self-employment activity, but research shows a widening gap between self-employment activity in the administrative data relative to the survey data.32 This reflects not only that self-employment is often supplemental activity but also that survey respondents are confused (e.g., they report that they are wage and salary workers when in fact they are independent contractors). The Contingent Worker Supplement conducted by the BLS in 2017 encountered challenges in eliciting responses about these alternative work arrangements, given this type of confusion.33
In sum, there is an increased rich and diverse data set available from both statistical agencies and the private sector that provides the opportunity for tracking the impact of AI on the economy and the workforce in a timely manner. Given the potential for the rapid changes AI may induce in the economy, developing these opportunities is of critical importance. Overcoming data access and data integration issues across the wide range of available sources will be key to enable the tracking of changes in AI use and in turn
___________________
29 “The UI data flow from state UI agencies to BLS to build the QCEW (along with multiple BLS business surveys) and the payroll tax data flow from IRS to Census to build the Census Business Register (along with multiple Census business surveys). To build the high quality QCEW and CBP (and other) public domain data products takes time. However, given that there is a quarterly flow of data there is the potential for developing preliminary statistics on a timelier basis.” See J. Haltiwanger, 2023, “Reflections on FESAC (Federal Economic Statistical Advisory Committee) ‘Ongoing Topics,’” Federal Economic Statistics Advisory Committee, June 9, https://apps.bea.gov/fesac/meetings/2023-06-09/reflections-on-ongoing-topics-for-fesac-6-9-23.pdf.
30J. Haltiwanger, 2023, “Reflections on FESAC (Federal Economic Statistical Advisory Committee) ‘Ongoing Topics,’” Federal Economic Statistics Advisory Committee, June 9, https://apps.bea.gov/fesac/meetings/2023-06-09/reflections-on-ongoing-topics-for-fesac-6-9-23.pdf.
31The JEDx (Jobs and Employment Data Exchange, see https://www.uschamberfoundation.org/JEDx) project for improving and enhancing the UI wage and employer records has many related ideas for making further progress using UI tax data.
32K. Abraham, J. Haltiwanger, K. Sandusky, and J. Spletzer, 2021, “Measuring the Gig Economy: Current Knowledge and Open Issues,” in NBER/CRIW Conference Volume on Measuring and Accounting for Innovation in the 21st Century, National Bureau of Economic Research, pp. 257–298.
33U.S. Bureau of Labor Statistics, 2018, “Electronically Mediated Work: New Questions in the Contingent Worker Supplement,” Monthly Labor Review, September, https://www.bls.gov/opub/mlr/2018/article/electronically-mediated-work-new-questions-in-the-contingent-worker-supplement.htm.
the impact on businesses, workers, and households on a timely basis. An aspirational objective might be, for example, to enable a timely and frequent task report analogous in spirit to the monthly jobs report that receives wide attention. One could imagine the task report providing guidance to businesses, households, and policy makers about the changing nature of tasks being performed by capital and labor as AI and other new technologies transform the economy.


