Sustaining Zero-Fare Public Transit in a Post COVID-19 World: A Guide for State DOTs (2024)
Chapter: 3 Data Assembly and Analysis

CHAPTER 3
Data Assembly and Analysis
This chapter summarizes the data that were assembled and used to inform the development of the practitioners’ tool. The data were gathered from the NTD, TCRP reports, agency reports, and agency staff. Data from 22 agencies in Colorado, Maryland, Massachusetts, Missouri, New Hampshire, North Carolina, Utah, Vermont, Virginia, and Washington were summarized in tabular form. Of these 22 agencies, 13 offer full fare-free transit services, and nine offer partial fare-free transit services. The partial fare-free transit services include socially limited, spatially limited, and temporally limited policies, including discontinued/scaled-down full fare-free policies that were introduced as a temporary response to the COVID-19 pandemic.
To facilitate comparisons between the study agencies, agency profile data were gathered from the NTD for 2019. Table 2 summarizes these data. When available, quantitative benefits and costs of the fare-free policies were gathered. Table 3 summarizes these data.
Where possible, additional measures were calculated. The paratransit cost as a percentage of annual OPEXs (OPEXs = operating expenses) was calculated by dividing the increased annual costs due to paratransit demand by the operating expenses, as follows:
![]()
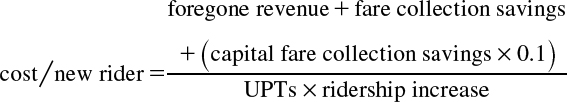
The estimated annual cost per new rider was calculated by summing the annual foregone revenue, annual fare collection savings, and capital fare collection savings (assumed to be distributed over a period of 10 years), and dividing by the product of the annual unlinked passenger trips (UPTs) and the ridership increase as follows:
The benefit–cost ratio was calculated by dividing the sum of the annual fare collection savings and the capital fare collection savings (assumed to be distributed over a period of 10 years) by the annual foregone revenue as follows:

Table 4 summarizes the available data for each of these additional measures.
Table 2. Summary of 2019 NTD agency profiles across study agencies.
| Agency Type/Policy Type | Annual Unlinked Passenger Trips (UPTs) | Annual Operating Expenses (OPEXs) | Farebox Recovery Ratio | OPEXs per UPT | |
|---|---|---|---|---|---|
| Bus | Demand Response (Paratransit) | ||||
| Rural/full | 200,000–800,000 | $3.3–$6.8 million | 0%–3% | $3.63–$13.02 | $20.29–$48.15 |
| Urban/full | 600,000–12.4 million | $4.2–$99.6 million | 6%–28.7% | $5.06–$12.69 | $27.58–$51.57 |
| Urban/partial | 1.7–366 million | $18.1 million–$1.8 billion | 13%–49% | $4.29–$18.13 | $31.77–$69.11 |
Table 3. Summary of fare-free policy quantitative benefits and costs across study agencies.
| Agency Type/Policy Type | Increased Ridership Percentage | Fare Collection Savings | Annual Foregone Revenue (2019 Dollars) | Annual Increased Cost Due to Paratransit Demand | |
|---|---|---|---|---|---|
| Annual | Capital | ||||
| Rural/full | 10.7%–32% | $10,000–$48,000 | $37,000–$611,000 | $29,000–$390,000 | NA |
| Urban/full | 20%–40% | $16,000–$935,000 | Up to $5.8 million | $640,000–$8.9 million | $795,000–$1.2 million |
| Urban/partial | 12%–35.6% | $0–$2.2 million | $0–$431,000 | $1.6–$28 million | $420,000–$7.8 million |
Note: NA = not available.
Table 4. Summary of key additional measures for fare-free operations across study agencies.
| Agency Type/Policy Type | Paratransit Cost as Percentage of Annual OPEXs | Estimated Cost per New Rider | Benefit–Cost Ratio |
|---|---|---|---|
| Rural/full | NA | $0.75–$1.41 | 0.10–0.42 |
| Urban/full | 1.2%–5.29% | $1.62–$3.35 | 0.04–0.10 |
| Urban/partial | 0.02%–2.52% | $0.05–$4.10 | 0.00–0.12 |
Note: NA = not available.
In the following series of tables (Table 5 to Table 8), the qualitative benefits, costs, and additional measures summarized previously are shown in greater detail. Table 9 lists the sources used to develop the benefits, costs, and additional measures tables. A full list of sources is included in the References section.
Table 5. Detailed 2019 NTD agency profiles for the study agencies.
| Policy Type | Agency | Location | Agency Type | 2019 | ||||
|---|---|---|---|---|---|---|---|---|
| Annual UPTs | Annual OPEXs | OPEX Percentage from Fares/Direct | OPEXs per UPT | |||||
| Para-transit | Bus | |||||||
| Full | Advance Transit | Windsor Co., VT/Grafton Co., NH | Rural | 758,025 | $3,338,559 | 0% | $48.15 | $4.03 |
| Green Mountain Community Network | Bennington Co., VT | Rural | 200,154 | $3,555,912 | 0.70% | $24.90 | $8.58 | |
| Green Mountain Transit (rural) | Chittenden Co., Capital District, Mad River Valley, Stowe/Lamoille, Franklin/Grand Isle Region, VT | Rural | 428,622 | $6,434,345 | 1.60% | $32.72 | $8.55 | |
| Marble Valley Regional Transit District | Rutland Co., VT | Rural | 806,778 | $6,848,347 | 2.70% | $23.51 | $3.63 | |
| Rural Community Transportation | Northeast Kingdom/Lamoille Co., VT | Rural | 264,752 | $4,982,305 | 0% | $23.69 | $6.88 | |
| Southeast Vermont Transit | Windham/Southern Windsor Co., VT | Rural | 445,702 | $4,306,434 | 3% | $30.12 | $7.71 | |
| Tri-Valley Transit | Addison/Orange/North Windsor Co., VT | Rural | 282,751 | $5,143,346 | 2.10% | $20.29 | $13.02 | |
| VTrans (rural agencies) | Rural VT | Rural | NA | NA | NA | Variable | NA | |
| Chapel Hill Transit | Chapel Hill, Carrboro, University of North Carolina, NC | University town | 6,641,553 | $19,964,823 | 3.30% | $45.15 | $2.57 | |
| KCATA | Greater Kansas City, MO | Urban | 12,409,231 | $99,663,654 | 10.90% | $41.12 | $7.28 | |
| Link Transit | Chelan/Douglas Co., WA | Urban | 1,036,007 | $15,031,915 | 6.10% | $45.80 | $12.69 | |
| Intercity Transit | Olympia, WA | Urban | 4,736,809 | $44,575,341 | 15.60% | $51.57 | $7.35 | |
| Alexandria Transit | Alexandria, VA | Urban | 3,996,676 | $21,708,129 | 28.70% | $27.58 | $5.06 | |
| City of Fairfax Transit | Fairfax, VA | Urban | 601,813 | $4,208,277 | 27.00% | NA | $6.99 | |
| Partial | Ride On | Montgomery Co., MD | Urban | 20,596,520 | $124,622,335 | 16.90% | NA | $6.05 |
| Utah Transit Authority | Salt Lake City, UT | Urban | 44,578,161 | $311,049,152 | 15.90% | $52.17 | $7.46 | |
| Massachusetts Bay Transportation Authority | Boston, MA | Urban | 366,716,896 | $1,866,447,835 | 46.70% | $69.11 | $4.29 | |
| Regional Transportation District | Denver, CO | Urban | 5,207,476 | $870,018,988 | 23.40% | $45.20 | $5.40 | |
| Green Mountain Transit (urban) | Chittenden Co., Capital District, Mad River Valley, Stowe/Lamoille, Franklin/Grand Isle Region, VT | Urban | 13,831,126 | $20,958,905 | 13% | $31.77 | $5.11 | |
| Arlington Transit | Arlington, VA | Urban | 2,917,849 | $18,134,248 | 22% | $50.86 | $5.26 | |
| Loudon County Transit | Loudoun Co., VA | Urban | 1,708,121 | $18,177,156 | 47.70% | $55.23 | $12.03 | |
| OmniRide | Prince William Area, VA | Urban | 3,813,055 | $39,927,120 | 49% | NA | $18.13 | |
| Fairfax County Connector | Fairfax Co., VA | Urban | 8,334,449 | $85,469,022 | 13.40% | NA | $10.25 | |
Note: NA = not available.
Table 6. Detailed fare-free policy quantitative benefits for the study agencies.
| Policy Type | Agency | Location | Type of Agency | Increased Ridership Percentage | Fare Collection Savings | |||
|---|---|---|---|---|---|---|---|---|
| Annual | Capital | |||||||
| Reported Value | Report Year | 2019 Estimate | ||||||
| Full | Advance Transit | Windsor Co., VT/Grafton Co., NH | Rural | 32.0% | $73,854 | $611,070 | 2023 | $542,630 |
| Green Mountain Community Network | Bennington Co., VT | Rural | 11.7% | $10,300 | NA | NA | NA | |
| Green Mountain Transit (rural) | Chittenden Co., Capital District, Mad River Valley, Stowe/Lamoille, Franklin/Grand Isle Region, VT | Rural | 15.1% | $10,000 | NA | NA | NA | |
| Marble Valley Regional Transit District | Rutland Co., VT | Rural | 10.7% | $48,000 | NA | NA | NA | |
| Rural Community Transportation | Northeast Kingdom/Lamoille Co., VT | Rural | NA | NA | NA | NA | NA | |
| Southeast Vermont Transit | Windham//Southern Windsor Co., VT | Rural | 19.9% | $31,000 | $37,000 | 2023 | $32,856 | |
| Tri-Valley Transit | Addison/Orange/North Windsor Co., VT | Rural | 11.8% | $50,000 | $50,000 | NA | NA | |
| VTrans (rural agencies) | Rural VT | Rural | 11.5% | $150,000 | NA | NA | NA | |
| Chapel Hill Transit | Chapel Hill, Carrboro, University of North Carolina, NC | University town | 54.5% | NA | NA | NA | NA | |
| KCATA | Greater Kansas City, MO | Urban | 40.0% | $935,000 | NA | NA | NA | |
| Link Transit | Chelan/Douglas Co., WA | Urban | 20.0% | $57,000 | NA | NA | NA | |
| Intercity Transit | Olympia, WA | Urban | NA | NA | NA | NA | NA | |
| Alexandria Transit | Alexandria, VA | Urban | 21.0% | $123,000 | $5,833,333a | 2021 | $5,489,166 | |
| City of Fairfax Transit | Fairfax, VA | Urban | NA | NA | $5,833,333a | 2021 | $5,489,166 | |
| Partial | Ride On | Montgomery Co., MD | Urban | 20.0% | $2,200,000 | NA | NA | NA |
| Utah Transit Authority | Salt Lake City, UT | Urban | 35.6% | $1,276,000 | NA | NA | NA | |
| Massachusetts Bay Transportation Authority | Boston, MA | Urban | 20.0% | NA | NA | NA | NA | |
| Regional Transportation District | Denver, CO | Urban | 12.0% | $16,000 | NA | NA | NA | |
| Green Mountain Transit (urban) | Chittenden Co., Capital District, Mad River Valley, Stowe/Lamoille, Franklin/Grand Isle Region, VT | Urban | 18.6% | $36,000 | NA | NA | NA | |
| Arlington Transit | Arlington, VA | Urban | NA | NA | $5,833,333a | 2021 | $5,489,166 | |
| Loudon County Transit | Loudoun Co., VA | Urban | NA | NA | $5,833,333a | 2021 | $5,489,166 | |
| OmniRide | Prince William Area, VA | Urban | NA | NA | $5,833,333a | 2021 | $5,489,166 | |
| Fairfax County Connector | Fairfax Co. VA | Urban | NA | NA | $5 833 333a | 2021 | $5 489 166 | |
Notes: NA = not available; aValue reflects total reported fare collection savings of $35 million allocated equally across six agencies (Northern Virginia Transportation Commission 2021).
Table 7. Detailed fare-free policy quantitative costs for the study agencies.
| Policy Type | Agency | Location | Agency Type | Annual Fregone Revenue | Annual Increased Cost Due to Paratransit Demand | ||
|---|---|---|---|---|---|---|---|
| Reported Value | Report Year | 2019 Estimate | |||||
| Full | Advance Transit | Windsor Co., VT/Grafton Co., NH | Rural | NA | NA | ||
| Green Mountain Community Network | Bennington Co., VT | Rural | $34,000 | 2024 | $29,342 | NA | |
| Green Mountain Transit (rural) | Chittenden Co., Capital District, Mad River Valley, Stowe/Lamoille, Franklin/Grand Isle Region, VT | Rural | $117,000 | 2024 | $100,971 | NA | |
| Marble Valley Regional Transit District | Rutland Co., VT | Rural | $131,000 | 2024 | $113,053 | NA | |
| Rural Community Transportation | Northeast Kingdom/Lamoille Co., VT | Rural | Alw | ys fare | free | Always fare free | |
| Southeast Vermont Transit | Windham/Southern Windsor Co., VT | Rural | $108,000 | 2024 | $93,204 | NA | |
| Tri-Valley Transit | Addison/Orange/North Windsor Co., VT | Rural | $63,000 | 2024 | $54,369 | NA | |
| VTrans (rural agencies) | Rural VT | Rural | $453,000 | 2024 | $390,939 | NA | |
| Chapel Hill Transit | Chapel Hill, Carrboro, University of North Carolina, NC | University town | $250,000 | 2001 | NAa | NA | |
| KCATA | Greater Kansas City, MO | Urban | $8,960,000 | 2019 | $8,960,000 | $1,200,000 | |
| Link Transit | Chelan/Douglas Co., WA | Urban | $640,000 | 2019 | $640,000 | $795,500 | |
| Intercity Transit | Olympia, WA | Urban | $207,000 | 1990 | NAa | NA | |
| Alexandria Transit | Alexandria, VA | Urban | $3,750,000 | 2022 | $3,431,250 | NA | |
| City of Fairfax Transit | Fairfax, VA | Urban | $1,100,000 | 2019 | $1,100,000 | NA | |
| Partial | Ride On | Montgomery Co., MD | Urban | $19,100,000 | 2019 | $19,100,000 | $1,400,000 |
| Utah Transit Authority | Salt Lake City, UT | Urban | $31,935,000 | 2023 | $28,358,280 | $7,829,000 | |
| Massachusetts Bay Transportation Authority | Boston, MA | Urban | $3,800,000 | 2022 | $3,477,000 | $420,000 | |
| Regional Transportation District | Denver, CO | Urban | $15,207,272b | 2023 | $13,504,058 | NA | |
| Green Mountain Transit (urban) | Chittenden Co., Capital District, Mad River Valley, Stowe/Lamoille, Franklin/Grand Isle Region, VT | Urban | $1,920,000 | 2024 | $1,656,960 | NA | |
| Arlington Transit | Arlington, VA | Urban | $3,700,000 | 2019 | $3,700,000 | NA | |
| Loudon County Transit | Loudoun Co., VA | Urban | $9,600,000 | 2019 | $9,600,000 | NA | |
| OmniRide | Prince William Area, VA | Urban | $11,200,000 | 2019 | $11,200,000 | NA | |
| Fairfax County Connector | Fairfax Co., VA | Urban | $10,900,000 | 2019 | $10,900,000 | NA | |
Notes: NA = not available; a Information was outdated; b Value reflects July/August only.
Table 8. Detailed key additional measures for fare-free operations for the study agencies.
| Policy Type | Agency | Location | Agency Type | Paratransit Cost as Percentage of Annual OPEXs | Estimated Cost per New Rider | Benefit–Cost Ratio |
|---|---|---|---|---|---|---|
| Full | Advance Transit | Windsor Co., VT/Grafton Co., NH | Rural | NA | NA | NA |
| Green Mountain Community Network | Bennington Co., VT | Rural | NA | $0.81 | 0.35 | |
| Green Mountain Transit (rural) | Chittenden Co., Capital District, Mad River Valley, Stowe/Lamoille, Franklin/Grand Isle Region, VT | Rural | NA | $1.41 | 0.10 | |
| Marble Valley Regional Transit District | Rutland Co., VT | Rural | NA | $0.75 | 0.42 | |
| Rural Community Transportation | Northeast Kingdom/Lamoille Co., VT | Rural | NA | NA | NA | |
| Southeast Vermont Transit | Windham/Southern Windsor Co., VT | Rural | NA | NA | NA | |
| Tri-Valley Transit | Addison/Orange/North Windsor Co., VT | Rural | NA | NA | NA | |
| VTrans (rural agencies) | Rural VT | Rural | NA | NA | NA | |
| Chapel Hill Transit | Chapel Hill, Carrboro, University of North Carolina, NC | University town | NA | NA | NA | |
| KCATA | Greater Kansas City, MO | Urban | 1.20% | $1.62 | 0.10 | |
| Link Transit | Chelan/Douglas Co., WA | Urban | 5.29% | $2.81 | 0.09 | |
| Intercity Transit | Olympia, WA | Urban | NA | NA | NA | |
| Alexandria Transit | Alexandria, VA | Urban | NA | $3.29 | 0.04 | |
| City of Fairfax Transit | Fairfax, VA | Urban | NA | NA | NA | |
| Partial | Ride On | Montgomery Co., MD | Urban | 1.12% | $4.10 | 0.12 |
| Utah Transit Authority | Salt Lake City, UT | Urban | 2.52% | $1.71 | 0.04 | |
| Massachusetts Bay Transportation Authority | Boston, MA | Urban | 0.02% | $0.05 | 0.00 | |
| Regional Transportation District | Denver, CO | Urban | NA | NA | NA | |
| Green Mountain Transit (urban) | Chittenden Co., Capital District, Mad River Valley, Stowe/Lamoille, Franklin/Grand Isle Region, VT | Urban | NA | $0.63 | 0.02 | |
| Arlington Transit | Arlington, VA | Urban | NA | NA | NA | |
| Loudon County Transit | Loudoun Co., VA | Urban | NA | NA | NA | |
| OmniRide | Prince William Area, VA | Urban | NA | NA | NA | |
| Fairfax County Connector | Fairfax Co., VA | Urban | NA | NA | NA |
Note: NA = not available.
Table 9. Sources for the benefits, costs, and additional measures tables.
| Agency | Source |
|---|---|
| Advance Transit | Vermont Agency of Transportation (VTrans). (2023). Report on Impacts of Zero-Fare Transit Service in State Fiscal Year 2024. The Vermont House and Senate Committees on Transportation. |
| Green Mountain Community Network | |
| Green Mountain Transit (rural) | |
| Marble Valley Regional Transit District | |
| Rural Community Transportation | |
| Southeast Vermont Transit | |
| Tri-Valley Transit | |
| VTrans (rural agencies) | |
| Chapel Hill Transit | Northern Virginia Transportation Commission. (2021). Zero-Fare and Reduced-Fare Options for Northern Virginia Transit Providers. https://novatransit.org/uploads/studiesarchive/Zero-Fare%20and%20Reduced-Fare%20White%20Paper%20Final%202021-08-30.pdf. |
| KCATA | Mid-America Regional Council. (2022). Transit Zero Fare Impact Analysis. Kansas City Area Transportation Authority. https://www.marc.org/transportation/plans-and-studies/transit-zero-fare-impact-analysis. |
| Link Transit | Hodge, D. C., James, I., Orrell, D., and Strauss, T. R. (1994). Fare-Free Policy: Costs, Impacts on Transit Service, and Attainment of Transit System Goals. Washington State Department of Transportation. http://www.wsdot.wa.gov/research/reports/fullreports/277.1.pdf. |
| Intercity Transit | Hodge, D. C., James, I., Orrell, D., and Strauss, T. R. (1994). Fare-Free Policy: Costs, Impacts on Transit Service, and Attainment of Transit System Goals. Washington State Department of Transportation. http://www.wsdot.wa.gov/research/reports/fullreports/277.1.pdf. |
| Alexandria Transit |
Northern Virginia Transportation Commission. (2021). Zero-Fare and Reduced-Fare Options for Northern Virginia Transit Providers. https://novatransit.org/uploads/studiesarchive/Zero-Fare%20and%20Reduced-Fare%20White%20Paper%20Final%202021-08-30.pdf. Alexandria Transit Company (ATC). (2022, December 14). DASH Free Fares Program Annual Report–2022 [Presentation to the ATC DASH Board of Directors]. https://www.dashbus.com/. |
| City of Fairfax Transit | Northern Virginia Transportation Commission. (2021). Zero-Fare and Reduced-Fare Options for Northern Virginia Transit Providers. https://novatransit.org/uploads/studiesarchive/Zero-Fare%20and%20Reduced-Fare%20White%20Paper%20Final%202021-08-30.pdf. |
| Ride On | IBI Group. (2021). Ride On Zero & Reduced Fare Study. Montgomery County Department of Transportation. https://www.montgomerycountymd.gov/DOT-Transit/Resources/Files/Ride%20On%20Zero%20and%20Reduced%20Fare%20Study%20Report%20Final.pdf. |
| Utah Transit Authority | Utah Transit Authority. (2022). Fare Free February Final Report. https://rideuta.com/-/media/Files/Rider-Info/Free-Fare-February/FFF_Report_FINAL_Apr2022.ashx. |
| Massachusetts Bay Transportation Authority | City of Boston. (2023). City of Boston Fare Free Program: Mid Program Report. https://content.boston.gov/sites/default/files/file/2023/03/Fare%20Free%20Mid%20Program%20Report.pdf. |
| Regional Transportation District | Regional Transit District. (2023). Zero Fare for Better Air: 2023 Evaluation Report. https://cdn.rtd-denver.com/image/upload/v1701363542/2023_ZFBA_Evaluation_Report_2023.11.27_54_mukmbl.pdf. |
| Green Mountain Transit (urban) | Vermont Agency of Transportation. (2023). Report on Impacts of Zero-Fare Transit Service in State Fiscal Year 2024. The Vermont House and Senate Committees on Transportation. |
| Arlington Transit | Northern Virginia Transportation Commission. (2021). Zero-Fare and Reduced-Fare Options for Northern Virginia Transit Providers. https://novatransit.org/uploads/studiesarchive/Zero-Fare%20and%20Reduced-Fare%20White%20Paper%20Final%202021-08-30.pdf. |
| Loudon County Transit | |
| OmniRide | |
| Fairfax County Connector |


