Sustaining Zero-Fare Public Transit in a Post COVID-19 World: A Guide for State DOTs (2024)
Chapter: 6 Practitioners' Tool Usage

CHAPTER 6
Practitioners’ Tool Usage
Detailed instructions, accompanied by screen captures of three example scenario analyses, are included in the appendix. This chapter provides a more limited description of the practitioners’ tool usage.
6.1 Maximizing Tool Utility
To maximize the utility of the practitioners’ tool, the research team compiled a list of action items for state DOT (or transit agency) staff to work through before using the tool. Carefully considering each of these items will increase the utility of the practitioners’ tool.
6.1.1 Fully Understand the Goals and Their Ability to Be Achieved
Increasing ridership and addressing equity concerns are likely achievable outcomes. Some fare collection cost savings can be expected, but these savings rarely offset lost revenues.
6.1.2 Understand the Decision-Making Context for Fare-Free Operations
Understanding the community and its needs and securing the community’s support are critical to fare-free transit service success. Current challenges may improve or decline, but they must be fully understood in order to take steps to address them.
6.1.3 Distinguish Between Partial and Full Fare-Free Operations
Partial fare-free transit services that can be applied temporally, socially, or spatially are being considered in many locations as a means of achieving desired policy goals without the complete loss of fare revenue. Section 2.1.4 provides a detailed description of partial fare-free policies, including several references on this topic, to help guide users.
When using the practitioners’ tool, it is important for the user to distinguish between partial and full fare-free transit services. When entering applicable agency data, the user should include data only for the portion of the system affected by fare-free operation. For full fare-free operations, the values entered should reflect the entire agency and system. If fare-free operations apply to only a specific area or mode (i.e., partial fare-free operations), only data for that area or mode should be entered. For example, if fare-free operations apply to bus services only, then only ridership data for bus services should be entered.
In a highly charged, divisive environment, partial fare-free policies can either be thought of as a step toward or a step away from full fare-free transit services—two sides of the same coin.
Fare collection cost savings must be carefully determined in the case of partial fare-free operation. For example, if a portion of the system (e.g., a bus rapid transit route or a downtown circulator) is fare-free, but the rest of the system is still collecting fares, the staff, facilities, and processes that the agency uses to secure, collect, reconcile, and manage fares must remain in place. Accounting for socially based fare-free programs can be especially complex, and additional research is required (MetroLink, 2023).
6.1.4 Recognize Ridership Data Limitations Regarding the Impacts of Fare-Free Operations, Particularly for Partial Fare-Free Operations
Users should rely on their knowledge of the local system to place ridership growth assumptions in the proper context. Ridership is likely to increase, but this will often not be attributable to a mode shift away from personal vehicles. Without this shift from personal vehicles to transit, any reduction in emissions will likely not be realized.
6.1.5 Look Outside the Boundaries of Fare-Free Operations for the Full Context
Whether boundaries are administrative (at the agency level) or jurisdictional (at regional or state lines), riders who need to cross these boundaries as part of their trips may face different requirements, including different fare collection mechanisms. A bus used both in and out of a fare-free area must be prepared to serve both paying and nonpaying riders. Transfers across these boundaries can be complicated and confusing for riders. Users should ensure that these boundary characteristics are reflected in the data entered into the tool.
6.1.6 Thoroughly Understand the Perspectives of Actual and Potential Transit Users
A thorough understanding of the diverse perspectives of actual and potential users of the fare-free transit services will encourage the services’ success. Does a fare-free service help the users and to what extent? Consider a system with a fare-free bus service but a fare-based train service. If commuting to a job location requires a train trip for one leg of the trip, the rider still needs to pay a fare for the trip. The equity benefit of the fare-free bus service is limited by the necessity to pay the fare for the train trip. If a rider using the bus service is a caregiver, consider whether the implementation of fare-free services affects their ability to complete chained trips (multiple stops in one overall trip).
While launching a low-income discount program, Metrolink utilized an Electronic Benefit Transfer card as proof of eligibility. Use of this card eliminated the need for a burdensome application process (MetroLink, 2023).
6.1.7 Consider the Perspectives of Transit Vehicle Operators
Fare-free operations may eliminate negative driver–passenger interactions over fares but may increase the number of disruptive passengers and passenger–passenger conflicts. Transit operators are on the front line of service and can provide valuable input. Users should reach out to operators and their unions to gain their perspectives before using the tool.
6.1.8 Fully Consider Potential Second-Order Impacts
Transit agencies should consider various potential second-order impacts of a fare-free transit service implementation prior to using the tool. For example, how much will paratransit ridership
and costs increase if fares are eliminated? How will the agency compensate for lost fare revenues in operations and capital investments? If fare revenues are unrestricted for use as a local match, will the local revenues used to replace fare revenues be similarly unrestricted?
Costs can increase dramatically under fare-free operations, so the impacts of fare-free operations should be considered carefully. The identification of a funding source to offset the loss in fares and a potential net increase in costs is essential to the long-term success of a fare-free policy.
6.2 Using the Tool
To assist state DOT (and transit agency) staff in using the practitioners’ tool, the tool’s structure, step-by-step usage instructions, and limitations are described in the following subsections.
6.2.1 Tool Structure
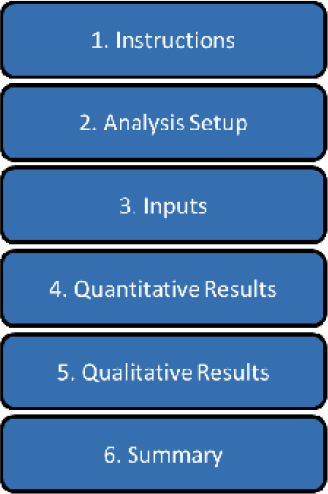
The practitioners’ tool was developed in Microsoft Excel using no macros or other special elements of the application that would make it difficult for users to understand the structure of the tool or trigger violations of institutional policies. The tool includes the following six tabs or worksheets, which form the basis of the tool (see Figure 6):
- Instructions: To allow for stand-alone functionality, the instructions for use are embedded in the tool.
- Analysis setup: Assuming that the analysis process will involve numerous iterations, the analysis setup tab allows the user to record the agency name, the analysis year, a scenario label, and some descriptive notes. This feature helps with version control and tracking.
- Inputs: Users enter data and operational characteristics of the system being analyzed into the inputs tab. When analyzing partial fare-free operations, only data for the affected service should be entered. If some fares are still being collected in the system, cost savings related to data collection, equipment maintenance, and so forth will likely be negligible.
- Quantitative results: Quantitative results are calculated for a range (minimum/maximum) of ridership increases. A cost per new rider metric is calculated, allowing for comparisons with other alternatives for increasing ridership (e.g., adding or expanding service).
- Qualitative results: Based on user inputs, qualitative results are estimated across a range of categories. The magnitude and direction of impacts for each category are presented.
- Summary: For ease of use and presentation purposes, a summary report is provided in a printable format.
6.2.2 Step-by-Step Instructions
Detailed step-by-step instructions, accompanied by screen captures of three example scenario analyses, are included in the appendix. These steps can be summarized as follows:
- Start with the instructions tab and move through the other tabs from left to right.
- Enter text/data only in the purple-shaded cells. Where provided, use the dropdowns to select the most appropriate input. Most inputs are required on the analysis setup and inputs tabs. Optional inputs are included on the quantitative results tab. All input data should reflect a common base year.
- Review the quantitative results in detail on the quantitative results tab.
- Review the qualitative results in detail on the qualitative results tab.
- View or print a summary of the quantitative and qualitative results on the summary tab.
Both the quantitative and qualitative results should be used to inform decision-making.
6.2.3 Tool Limitations
The practitioners’ tool developed as part of this study is not without limitations. When using this tool, state DOT (and transit agency) staff should be aware of the following limitations:
- This tool offers only a starting point for evaluating fare-free transit services.
- This tool does not account for political, community, staff, union, or other entities’ support of or opposition to fare-free policies. Understanding the local context is extremely important.
- The addition of additional buses is not specifically addressed and must be considered if this is a result of greatly increased ridership on a given route.
- Emerging transit service models may require additional consideration and evaluation. One example is the high cost and operational impact of microtransit no-shows when there is no established consequence for requesting rides and not completing the trips.
- While appropriate ranges are provided in the tool, the inputs to the model are not rigidly limited. This feature provides the opportunity to investigate options fully and, in some cases, determine boundary conditions. This feature also has the potential to show results that are not realistic or properly applied within the context of the state or community in question. The user must use care in providing input data and reviewing the results for proper process integrity and applicability.


