Impacts and Performance of State DOT Resilience Efforts (2025)
Chapter: 3 Developing a Strategic Implementation Model and Compendium of Resilience Performance Measures
CHAPTER 3
Developing a Strategic Implementation Model and Compendium of Resilience Performance Measures
Chapter 3 summarizes the processes that were employed to develop the materials in Task 4. This task included the:
- Task 4: Develop Strategic Implementation Model—To provide a systematic approach for state DOTs to identify, develop, and integrate RPMs into ongoing performance-based planning and programming processes.
This task encompassed the “drawing board” for all the three key deliverables (the SIM, the Compendium, and the framework for NCHRP Research Report 1159). These deliverables involved expert solicitation, panel feedback, and overall RPM refinement. The Final Report transitions to discuss the research products developed under Task 4, including the reasoning behind and approach of the SIM. Then, it covers the development of a Compendium of RPMs that agencies can use as options to measure the resilience of various classes of roadway assets. These research findings were presented at an October 2023 stakeholder engagement workshop, and this chapter concludes with takeaways gleaned from that workshop and additional engagement during Phase 2. Thus, this chapter includes details on the:
- SIM.
- Compendium of RPMs.
- Stakeholder and Panel Feedback and Affirmation.
Task 4. Strategic Implementation Model
As described in the problem statement for this research, DOTs need a systematic approach to identify, develop, and integrate RPMs into ongoing performance-based planning and programming processes. Through this research, the SIM was created to assist agencies in this approach (Figure 8 below). The SIM follows a stepwise approach designed for practitioners. The steps are:
- Based on agency understanding of resilience (Step 1), develop goals and objectives (Step 2) of what the practitioner (or the agency) wants to accomplish.
- Then, practitioners select RPMs (Step 3) tied to their goals and objectives that best measure the resilience of their assets and systems.
- Next, the practitioner will conduct a baseline assessment (Step 4) of the resilience of their assets, corridors, and/or systems based on historic data.
- After that, practitioners will set targets based on a future assessment (Step 5) that, depending on the RPM, either extends the baseline assessment forecast or incorporates future projections.
- Then, the practitioner will select actions (Step 6) to achieve those targets and implement (Step 7) those actions, evaluating their progress as they go.
- Finally, the practitioner will measure the impact (Step 8) of their actions by assessing the change in the RPMs and then report progress (Step 9) to their internal and external stakeholders.
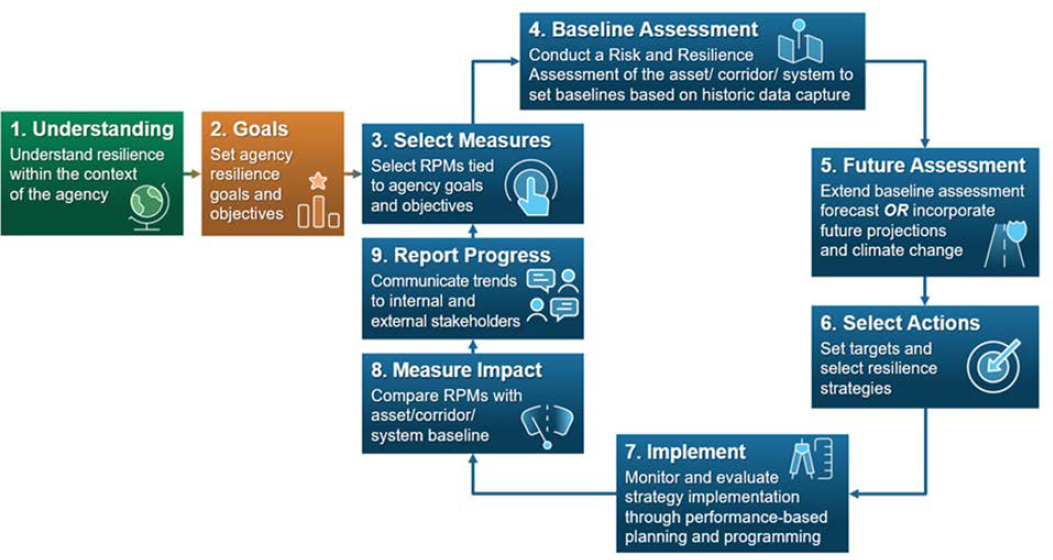
The SIM begins with foundational and visionary steps (Step 1 and 2) which support how a practitioner understands what resilience means to their agency and how it manifests in their unique context. This answers the questions of “where are we today?” Step 2 ensures that once agencies grasp the resilience context in which they operate, the next action is to establish goals and objectives that envision where agencies want to be from a resilience perspective, answering the question “Where do we want to go and how do we want to get there?”
After an understanding and goals in the agency are established from a resilience perspective, the model moves into a recurring cycle of steps starting with selecting RPMs (Step 3). After goals and RPMs are created, two assessments are performed: a baseline assessment (Step 4) and a future assessment (Step 5). In the baseline assessment, specific risk and resilience baselines are set based on historical data. In the second assessment, future projections and natural hazard variability are evaluated to understand future resilience concerns and predictions in the region.
Utilizing the information from the two assessments, the resilience goals and objectives, and the RPMs, the agency selects actions to take and sets targets (Step 6). In target setting, a quantifiable level of resiliency performance within a specific timeframe is established and resilience strategies are determined for the agency. The resiliency strategies are then implemented (Step 7), and the results of the strategies are monitored to understand the progress the agency is making and to identify any improvements or adjustments that need to be made. Then the RPMs are compared with the previous baselines to measure the impact of the strategies (Step 8). The cycle concludes with reporting progress to internal and external stakeholders (Step 9). This cycle can then be repeated to determine if the agency’s resilience approach needs to be adjusted based on past or current performance or based on new information or concerns in the region.
To develop an accepted and familiar model and approach, the research team leveraged the TPM framework for development of the SIM. The TPM framework is a federal strategic approach that uses system information to make investment and policy decisions to achieve national performance goals (Federal Highway Administration 2023). Through this process, targets and goals are set to create a better-performing transportation system. As in the TPM framework, RPMs map directly to the resilience goals and objectives. RPMs will come alongside existing agency goals to serve several purposes in the region. For example, when looking at the Robustness of the asset conditions in the region, agencies can tie the RPMs into existing system preservation goals for bridge and pavement conditions. In another example, an RPM related to the rapidity of the system (time to recover normal system operations) can be tied to the travel time reliability goals in the region.
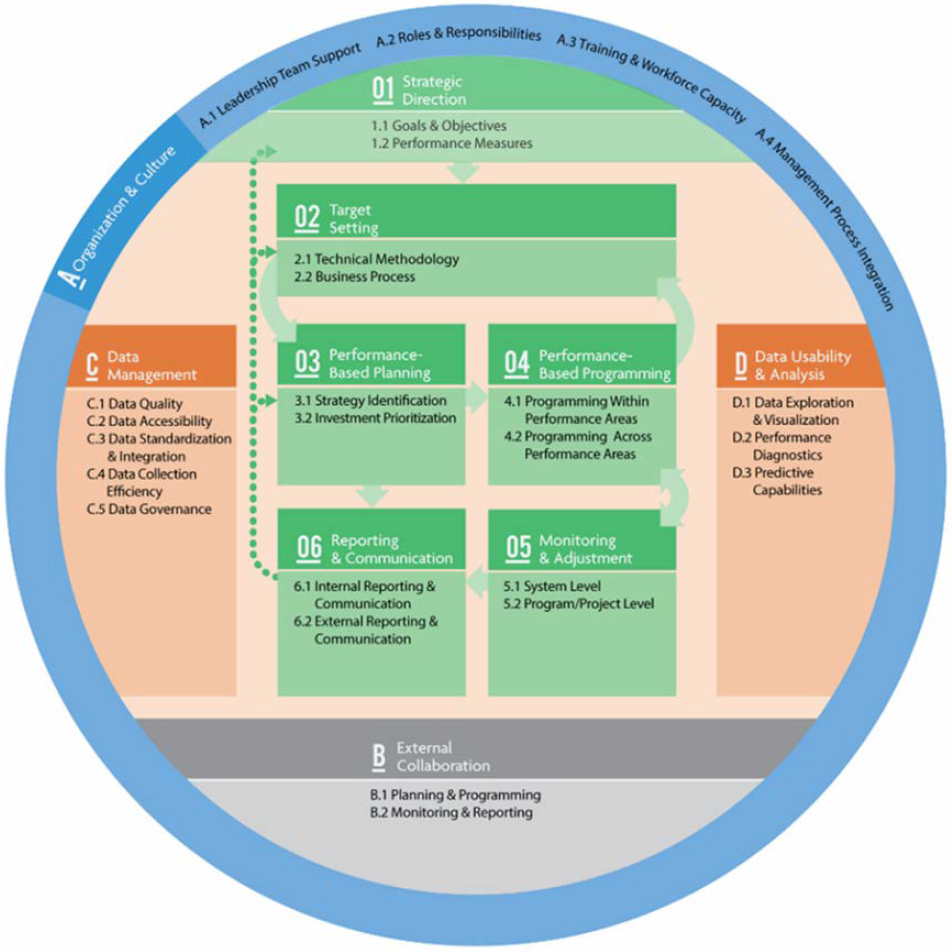
These RPMs can be measured at the asset, system, or agency level. As seen in Figure 9, the TPM framework has six iterative steps along with four additional components for organization and culture, data usability and analysis, data management, and external collaboration.
While the TPM framework is useful in many aspects of transportation planning, the unique aspects of resilience planning necessitate a step-by-step process model to help agencies integrate resilience into performance management processes. These unique aspects include the development of technical and modeling approaches to include future assessments and modeling the performance of assets or the system in those future conditions. After reviewing other risk and resilience frameworks, such as the Sustainability Performance Measures framework, the Investing in Resilience Consensus Report framework, and the NCHRP Project 23-09, “Framework for a Risk and Resilience Assessment,” the SIM was created to assist DOTs with measuring their resilience initiatives (Zietsman et al. 2011; Special Report 340, 2021; Pena et al. 2023).
Development of the Compendium of RPMs
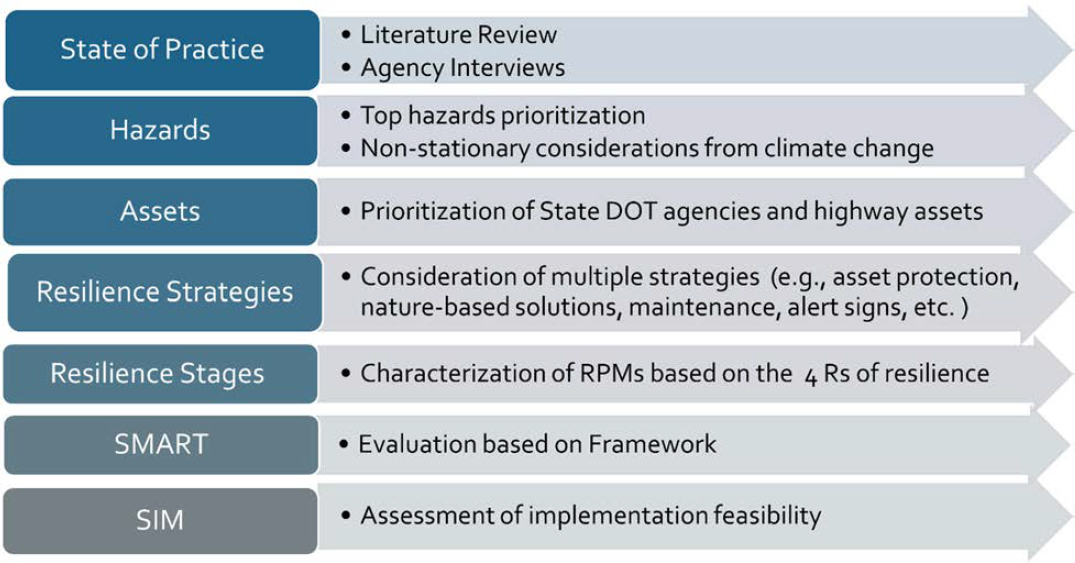
A critical component of SIM is selecting measures (Step 3) for DOTs to track the resilience of various classes of assets. To assist in this, the research team developed a Compendium of RPMs that agencies can use as options when selecting measures (Table 2 below). The major goals of developing the Compendium are to 1) identify/develop key RPMs for state transportation agencies; and 2) use the RPMs to make investment decisions and evaluate and monitor them. Figure 10 presents an overview of the RPM development and selection process.
As discussed before, the research team adopted the Four Rs definitions and approach to develop and organize the Compendium of RPMs based on the measure’s primary connection to each of the Four Rs. Essentially, this meant that every RPM was assigned an “R” with some RPMs notably applying to more than one “R.” One key caveat is that the research team has used this association to classify each measure and attribute it to one of the Rs but does not necessary mean to limit its association to that property of resilience. Given agencies face challenges at all points of the resilience curve, the Compendium stratifies all “Rs” with five Robustness measures, three Redundancy, three Rapidity, and two Resourcefulness (see Table 2). This
stratification was used during the October 2023 Workshop when practitioners discussed how they aim to implement solutions at all phases of an event or disruption. However, as discussed in the NCHRP Research Report 1159: Measuring Impacts and Performance of State DOT Resilience Efforts: A Guide, many agencies naturally focus on Robustness (design and construction functions) and Rapidity (operations and maintenance functions).
As part of the literature review, the research team also collected information regarding existing resilience improvement efforts agencies are incorporating into their practices (e.g., strengthening roadway prisms by adding riprap to embankments) and grouped those efforts by asset and threat of relevance. The resilience efforts were then grouped by functional area as follows:
- Planning, Policy, Capacity Building and Collaboration.
- Operations and Maintenance.
- Engineering and Design.
This delineation by functional area added an element of practicality to the Compendium. By assigning responsibility, practitioners can better understand which division, or which bureau of a DOT may be best suited to implement an RPM. In addition to the extensive literature review, and as described in the prior Developing Representative Case Studies section, the research team conducted interviews with state DOT staff and transportation practitioners to identify how their agencies incorporate resilience initiatives and use PMs to capture the efficacy of initiatives.
Evaluation of the RPMs
To evaluate the draft RPMs the research team compiled, each member of the research team applied the SMART Framework, which has been widely accepted and used to identify and evaluate PMs (United States Department of State n.d.). Each one of the draft RPMs was evaluated against each criterion or component of the framework as presented in Figure 11, and assigned a total score. As part of the evaluation process, each member provided recommendations for improvement on each of the five components of the framework which were discussed and addressed, as necessary.
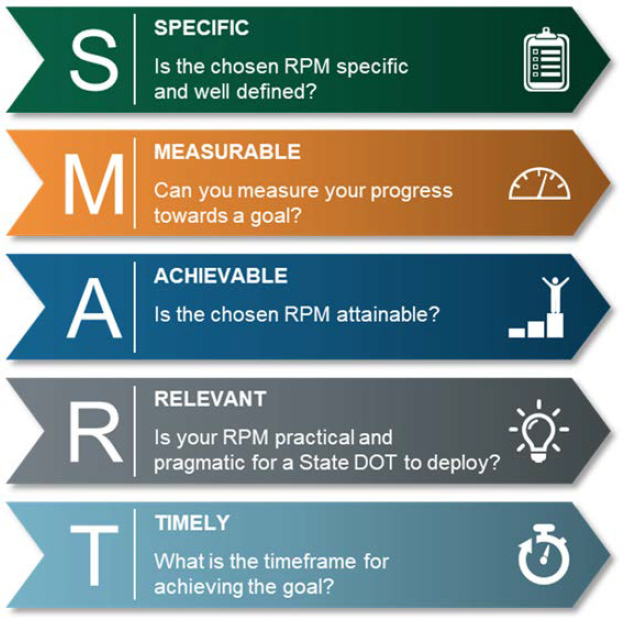
Based on the SMART evaluation, the research team selected the top two to five RPMs for each of the Four Rs to further present (and evaluate via SMART) during the October 2023 Workshop with a broader audience of state DOT members from different functional areas. In total, 40 practitioners were in attendance.
This workshop provided guidance on DOT interest, feasibility, and barriers to DOT implementation of the RPMs. The feedback received helped the research team to refine the Compendium and craft the structure and content of the NCHRP Research Report 1159 (see Chapter 4)—two of the three primary research
objectives of this project. In parallel, opportunities to gather knowledgeable resilience practitioners are rare; therefore, the workshop was an opportunity to discuss the breadth of this research, affirm the understanding of an RPM, and share mutual DOT experiences to further advance the practice. In total, 13 draft RPMs were finally included in Table 2.
| Measure Title | Description | Primary “R” Connection |
|---|---|---|
| RPM 1. Reduction in Risk | The reduction in cumulative annual risk from project investments or operations and maintenance funds that address known risks on critical corridors. | Robustness |
| RPM 2. Implementing Resilient Design Standards | Incorporate resilience standards* and future weather conditions and implement them for assets that are at-risk as identified in the Resilience Improvement Plan or work programs (STIP or TIP). | Robustness |
| RPM 3. Redundancy Ratio and/or Multi-Scale Robustness (MRI) Index | A direct measure of network redundancy based on the number of available routes connected to network nodes. The MRI goes beyond redundancy to incorporate a series of indicators that are developed based on topology -based and flow-based models to represent connectivity, redundancy, and the impacts on users. | Redundancy |
| RPM 4. Stranded or Severely Detoured Communities | Population, or areas, that would be isolated or access-restricted due to disruptions to lifeline access facilities. | Redundancy |
| RPM 5. Training and Education of DOT Staff | The share of state DOT staff who participate in resilience training (e.g., National Highway Institute’s (NHI), FHWA, AASHTO) or an equivalent DOT-approved training program. | Resourcefulness |
| RPM 6. Corridors Recovered Within Timeframes | The time it takes to return to normal operations divided by natural hazard event magnitude. | Rapidity |
| RPM 7. Bus Transit Service Restoration Post-Disruption | Tracking restoration of bus service post-disruption (due to result of natural hazards) is a measure of service availability, especially for affected communities. This measure could be applied to fixed guideway systems e.g., rail, BRT, trolley, and on-demand/paratransit if data is available. | Rapidity |
| RPM 8. Implementing Countermeasures for Scour Critical Bridges | Share of scour critical bridges where plans of action or countermeasures have been implemented. | Robustness |
| Measure Title | Description | Primary “R” Connection |
|---|---|---|
| RPM 9. Evaluation of Facilities Repeatedly Requiring Repair and Reconstruction Due to Emergency Events | Evaluation of damaged assets that include a risk-based damage assessment to identify the cause of damage and include included resilience improvement features to mitigate future damage identified in the assessments. Can also incorporate percent of assets on Part 667 Report categorized by threat. | Robustness |
| RPM 10. Strengthening of Evacuation Routes | Reduction in vulnerability of evacuation routes recovered from flooding in a desirable timeframe. | Robustness |
| RPM 11. Avoided Maintenance Costs as a Result of Resilience Improvements | Develop a baseline of estimated maintenance and rebuilding costs associated with existing and future hazard risk over the asset lifecycle. Compare it with reduced maintenance and rebuilding costs due to resilience improvements. Also account for non-hazard maintenance costs (refer to PROTECT NOFO guidance). This can be extended to estimate return on investment. | Resourcefulness |
| RPM 12. Travel Time Reliability | Changes in travel time reliability are attributable to increased travel time, closures, or reductions in capacity due to extreme hazards or weather events. Can incorporate community resilience by measuring separately on roadways in affected communities or other critical designations. | Rapidity |
| RPM 13. Alternate Route Planning | Percent of critical corridors, in urbanized and rural areas, with alternate route plans/guidelines in place (see FHWA Ops Alternate Route Planning resources). | Redundancy |
*Definition and source located in accompanying RPM template.
Affirmation Through Stakeholder Engagement
Based on feedback received during the workshop and from the NCHRP Project 23-26 panel, practitioners noted the overwhelming need for more detail on methodology and data requirements for several RPMs, particularly those utilizing modeling and projections. Thus, the research team conceived two parts of the Compendium.
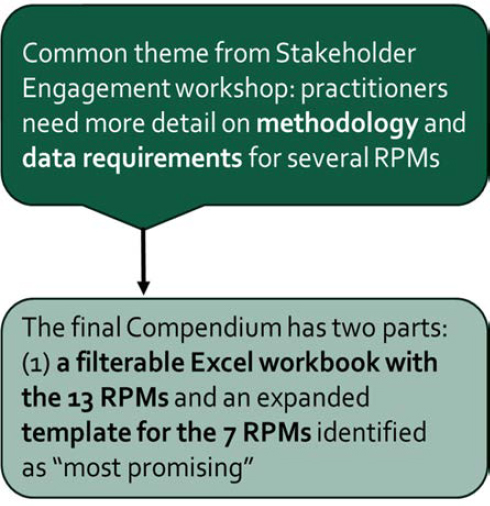
As Figure 12 highlights, the final Compendium of RPMs would thus include two components: (1) an Excel workbook of all 13 RPMs drafted during this project (listed in Table 2); and (2) seven extensive RPM templates that walk the user through each step of the SIM for each RPM. These templates are appended to the final NCHRP Research Report 1159 (see Chapter 4).
The seven RPMs that were prioritized during the workshop and affirmed by the panel were chosen to be expanded in the templates. This was determined during the stakeholder workshop through the SMART evaluation and subsequently presented to the panel for their affirmation. These RPMs are:
- RPM 1: Reduction in Risk.
- RPM 2: Implementing Resilient Design Standards.
- RPM 3: Redundancy Ratio and/or Multi-scale Resilience Index (MRI).
- RPM 4: Stranded or Severely Detoured Zones.
- RPM 5: Training and Education of DOT Staff.
- RPM 6: Corridors Recovered within Timeframes.
- RPM 7: Bus Transit Service Restoration Post-Disruption.
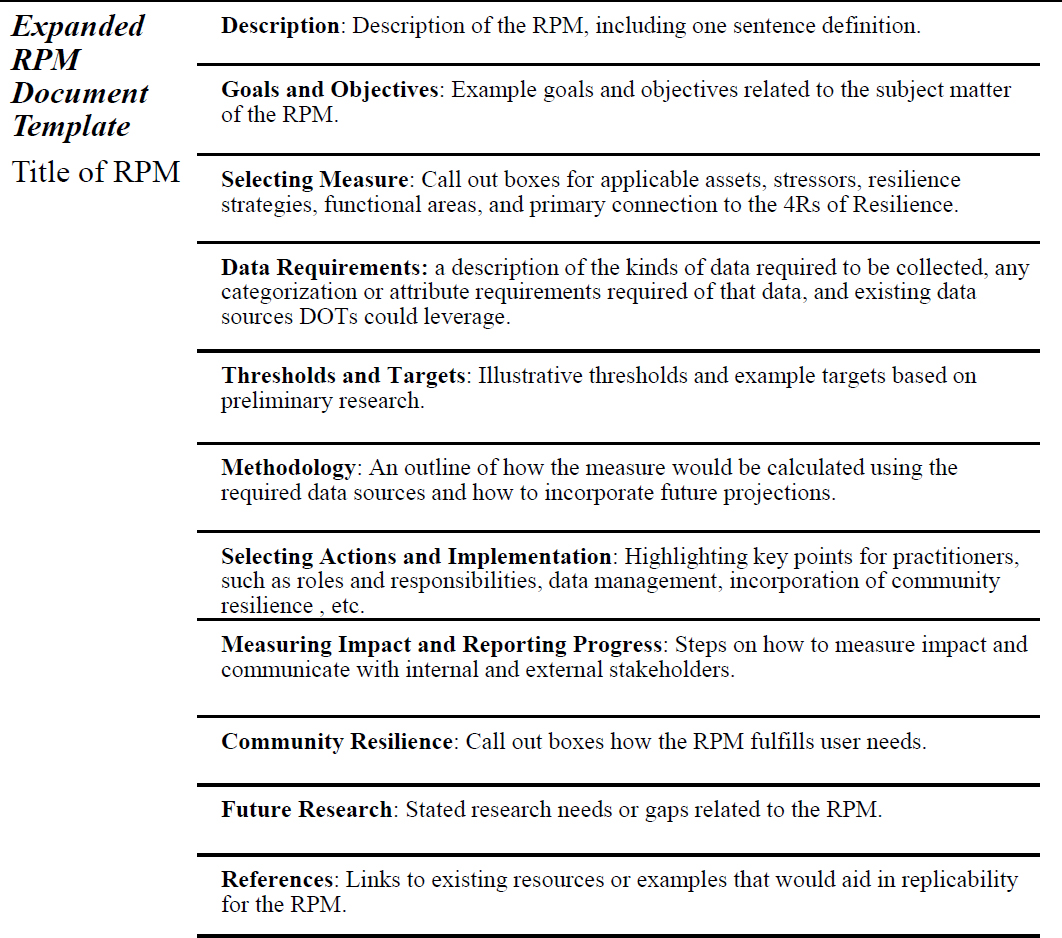
These seven RPMs were developed into the expanded document template outlined in Figure 13. The expanded RPM templates include a description, example target, and primary connection to the Four Rs, along with expanded sections for data requirements, methodology, implementation considerations, community resilience considerations, potential future research, and references to aid in RPM adoption and general resilience understanding.
In summary, the scoped Excel workbook includes filters for resilience strategies, applicable hazard, functional area, and primary connection to the Four Rs to aid practitioners in selecting appropriate RPMs that are tied to their goals and objectives. For the RPMs that practitioners have selected for advancement and evaluation at the stakeholder workshop, an expanded document template for each RPM provides greater detail on calculation methodology, data requirements, incorporation of future projections, implementation considerations, and references to existing resources. This is reflective of consideration to practitioner input and their priorities reflected through this research effort as identified during the October 2023 stakeholder workshop.
In addition to the practitioner engagement and feedback garnered in October 2023, the research team also sought expert opinion and practical guidance from transportation agencies and internal resources to improve and finalize the RPMs for a more practicable adoption and application. While developing the expanded RPM templates, the research team engaged with subject matter experts at Iowa DOT and the Southeast Michigan Council of Governments (SEMCOG). Iowa DOT provided feedback on RPM 3 Redundancy Ratio and/or MRI. SEMCOG met with the research team to provide their input. The research team also reached out to other consultant staff who performed work under the Southern California Association of Governments, supporting the development of RPM 4 Stranded or Severely Detoured Zones.
The following chapter (Chapter 4) discusses the application of these RPMs as explained in the NCHRP Research Report 1159.


