Impacts and Performance of State DOT Resilience Efforts (2025)
Chapter: 2 Literature Review and State of the Practice Summary
CHAPTER 2
Literature Review and State of the Practice Summary
Chapter 2 encompasses the main findings of the research completed in Tasks 2 and 3. These tasks comprised two foundational steps:
- Task 2: Literature Review—Relevant practice, research findings, data sources, and other information pertaining to RPMs used by state transportation agencies and others for roadway transportation systems for various classes of assets.
- Task 3: Scan of Case Studies—Documented examples of the current state of resilience practice at transportation agencies in using RPMs to measure the resilience of their system and the impact that their strategies and investments are having to prepare to mete future stressors.
Overall, this chapter summarizes the
- Literature Review.
- State of Practice.
- Key Terms and Definitions.
- Four Rs of Resilience Framework.
- Developing Representative Case Studies.
Task 2: Literature Review
The literature review was the initial task under the NCHRP Project 23-26. Its objective was to compile and assess current findings and research related to the resilience practice in transportation, augmented by examples from sectors such as water, energy, and cybersecurity. The objective was to gather insights on identifying and measuring key RPMs for state transportation agencies managing surface transportation systems and various asset types. This resulted in a comprehensive report with key takeaways, particularly those focused on identifying barriers, lessons learned, and communication considerations. The full literature review is available in Appendix A of this Final Report.
The literature review was divided into several sections centering on the topics seen in Figure 2. The topics were developed to build upon recent research that would ensure the research team, and users of this research, have a firm understanding of performance measurement in transportation, how to define and measure different components of resilience, and how to successfully implement RPMs into DOT decision-making.
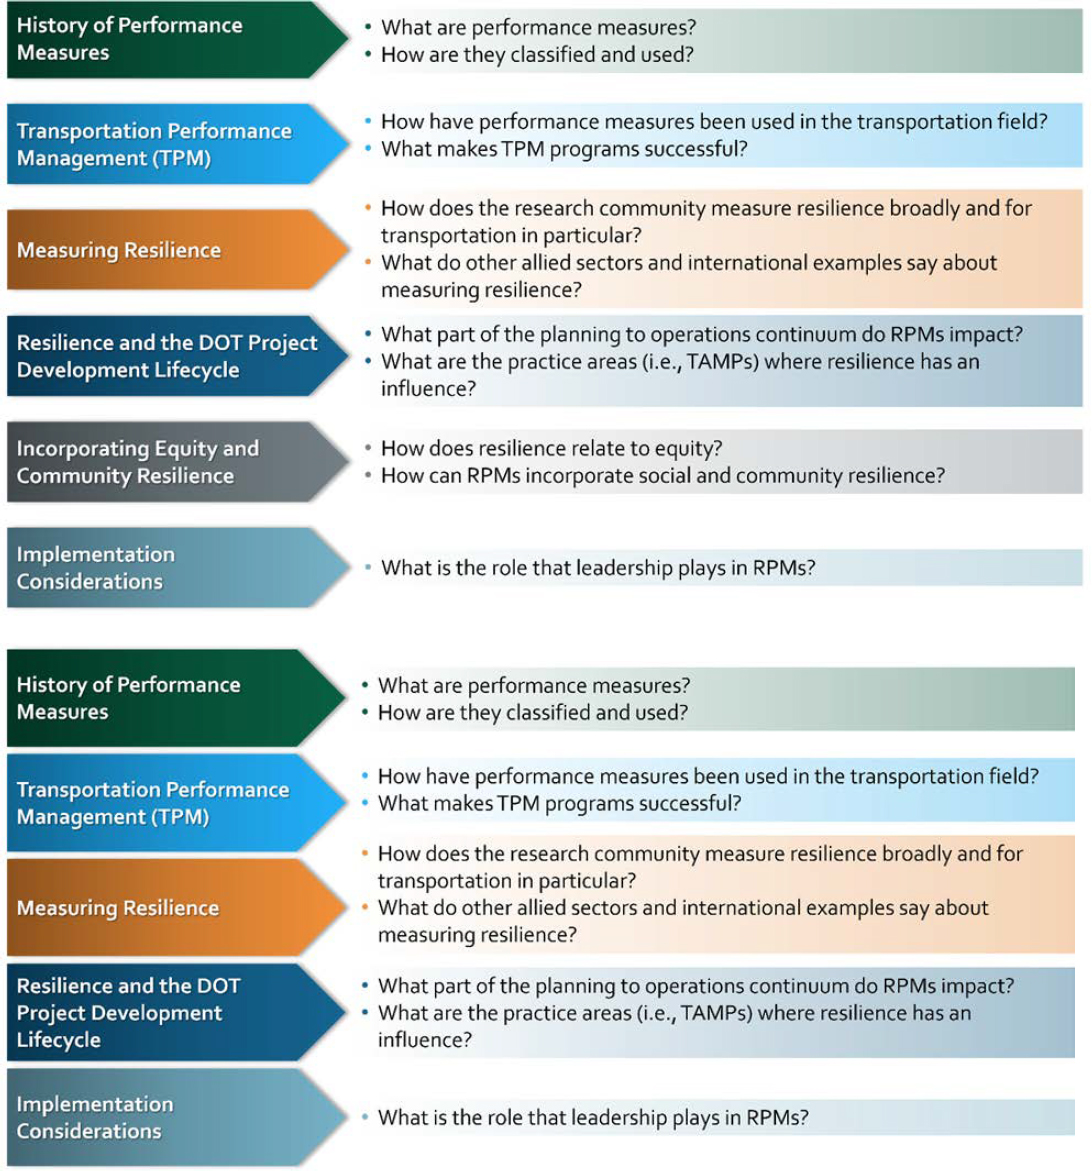
Following the literature review, the research team used the reviewed written materials, presentations, and other works as connective tissue, drawing from the body of work to the experiences of the research team to develop, and articulate, an understanding of the state of the practice and gaps in practice, which was used as an input to identify opportunities to advance the state of the practice. Table 1 outlines the takeaways from each of the six topics as well as those gaps/opportunities.
Table 1. Literature Review Informs State of Practice
| Topic | State of the Practice | Gaps and Potential Opportunities |
|---|---|---|
| History of Performance Measures (PMs) | PMs are essential for understanding system effectiveness but are not interchangeable between disciplines. Their specific application must be customized to meet the goals and objectives of practitioners, policymakers, and the broader public. This has not been fully developed in the resilience space. | Before being able to measure and evaluate resilience efforts, it is vital to define and understand the different types of PMs including those that measure resilience. Understanding the different types of PMs will allow for better evaluation in a specific topic area. |
| Transportation Performance Management (TPM) | TPM requires strong governance and leadership, and existing PMs (e.g., Time Travel Reliability) do not incorporate risk from probable events. | Agencies may not be fully accounting for the underlying risks to their ability to meet their established PMs, meaning they are not accounting for the probability of extreme weather events or hazards to impede their ability to reach their performance goals. |
| Measuring Resilience | While certain measures exist for resilience, they are used for past or present performance and do not project resilience of infrastructure against future weather disruptions. | Resilience is not seen as a single outcome or a post-disaster recovery measure, but rather as a dynamic process that uses a risk and lifecycle-based method for addressing the vulnerabilities of critical infrastructure systems, making systems better able to adapt to unexpected challenges. The development and implementation of RPMs will help transportation agencies to measure how effective their resilience initiatives and efforts are with respect to their goals, enabling agencies to make data-driven decisions, monitor and improve their system resilience and performance. |
| Resilience and DOT Project Development Life Cycle | Currently, there is no standardized approach to incorporating resilience, and developing RPMs within transportation asset management plans. Standardized RPMs can help agencies measure how effective their resilience initiatives are and be incorporated into other processes. | There are many federal and state requirements that encourage transportation agencies to incorporate resilience into their activities and efforts. However, given the lack of resilience measurement tools, agencies must rely on nearby or established examples. This can include Transportation Incident Management and Road Weather Management, which have laid significant groundwork for developing PMs, thresholds, and targets. Instead of reinventing the wheel, practitioners can build upon the work that has been already successfully implemented at the DOT level. |
| Topic | State of the Practice | Gaps and Potential Opportunities |
|---|---|---|
| Incorporating Community Resilience | Though several tools exist to guide resilience investments and projects in affected geographical areas, there is limited experience in selecting and implementing RPMs based on their relevance to, and impact on, users and impacted populations. | A basic understanding of how users, transportation, and resilience are intrinsically linked helps construct a community resilience approach to RPMs. Examples of tools that measure social and community resilience to hazards and stressors are helpful to review current RPMs and methodologies used to create them. |
| Implementation Considerations | Though resources exist to help practitioners obtain leadership buy-in for resilience investments, there is no silver bullet for obtaining leadership support for resilience investment. Additionally, there is little information available for how to obtain leadership buy-in for incorporating resilience into performance management programs and then using those measures to track the effectiveness of resilience initiatives. | Implementation of RPMs into TPM programs is a key topic for this research effort and steps that need to be taken to obtain leadership buy-in for successful adoption and implementation of RPMs will be explored in detail in the SIM, stakeholder engagement workshops, and the implementation guide. |
Key Terms and Definitions
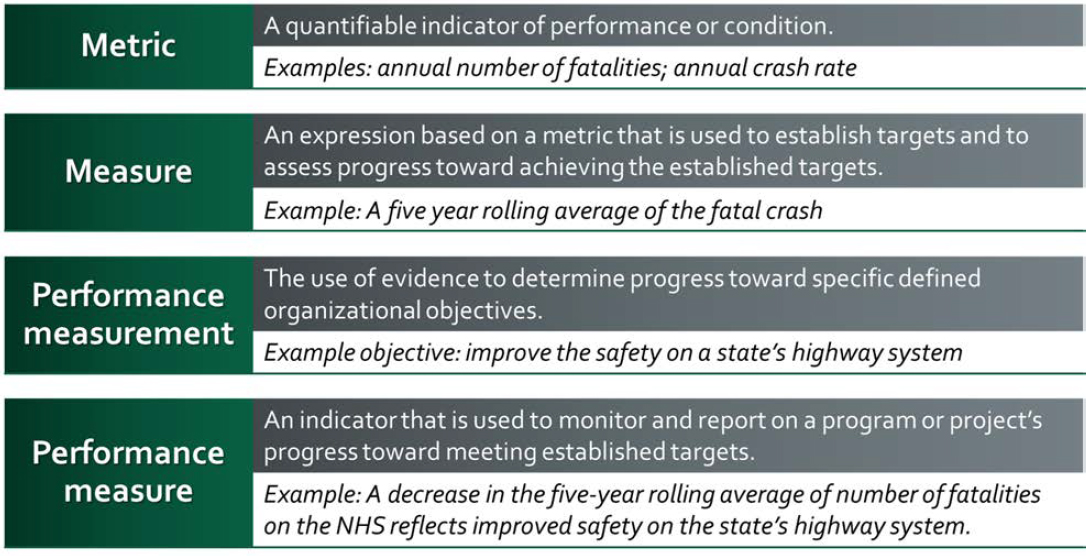
Within Task 2, the research team summarized key findings to determine the state of practice. For example, this task made clear that it is necessary to establish clear definitions for use in this project (and beyond), which are covered below. The research team concluded that it was essential to practitioner understanding and to this research’s efficacy that terminology and definitions were made clear at the outset; to highlight the clear distinction between commonly used terms like “metric” and “measure.”
Figure 3 provides a visual of the four key terms, their definitions, and accompanying examples of each. These definitions are intended to illustrate how performance management components “roll up” from individual data points that practitioners can measure into an evidence-based decision-making process that tracks progress towards defined goals and objectives.
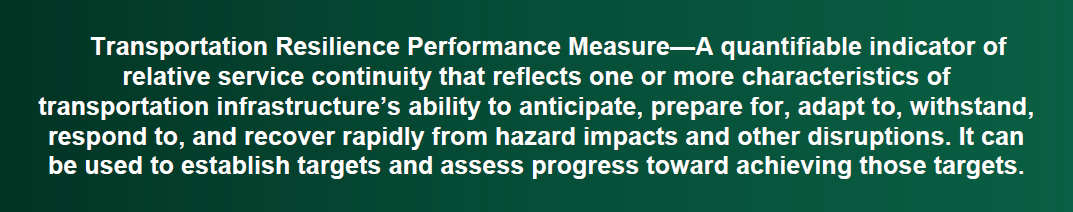
With this knowledge in hand and the definitions determined, the research team then developed the subsequent definition of a transportation RPM (a key element of this research). Figure 4 defines an RPM as:
The Four Rs of Resilience
A critical component of the literature review was the understanding of resilience as well as the quantification of resilience and subsequent investments. As defined by FHWA, resilience is “the ability to anticipate, prepare for, and adapt to changing conditions and withstand, respond to, and recover rapidly from disruptions” (FHWA 2017).
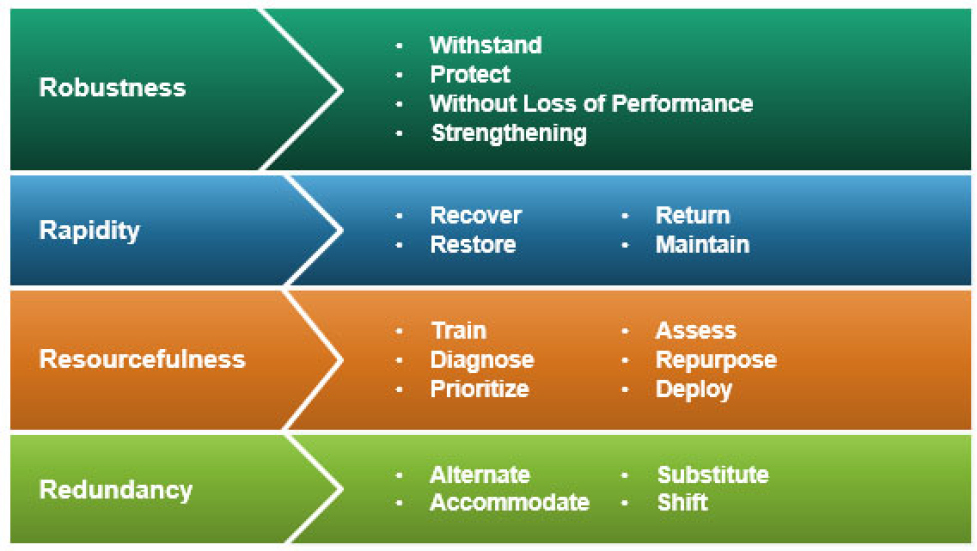
Resilience for physical and social systems has been defined by four properties as follows: Robustness, Redundancy, Resourcefulness, and Rapidity (the Four Rs) (Bruneau, Michel et al. 2003).
- Robustness—The ability of systems, system elements, and other units of analysis to withstand disaster forces without significant degradation or loss of performance;
- Redundancy—The extent to which systems, system elements, or other units are substitutable, that is, capable of satisfying functional requirements, if significant degradation or loss of functionality occurs;
- Resourcefulness—The ability to diagnose and prioritize problems and to initiate solutions by identifying and mobilizing material, monetary, informational, technological, and human resources;
- Rapidity—The capacity to restore functionality in a timely way, containing losses and avoiding disruptions.
These terms may or may not be familiar to state transportation agencies or practitioners, but the meaning behind them is widely recognizable as Figure 5 details. For example, if an agency is concerned with roadway clearance times, response and recovery or prompt service restoration, their efforts would be related to improving rapidity; whereas, if an agency is focused on strengthening assets by reinforcing their designs or raising roadway profiles to reduce flood exposure, that would be associated with enhancing robustness.
Similarly, each of the Four Rs corresponds to a different part of the resilience curve (see orange curve in Figure 6) known as the “Resilience Triangle.” For example, how quickly an agency recovers functionality (fr) after a hazard is connected to the agency’s resourcefulness and their ability to implement solutions (Tierney and Bruneau, Conceptualizing and Measuring Resilience—A Key to Disaster Loss Reduction 2007).
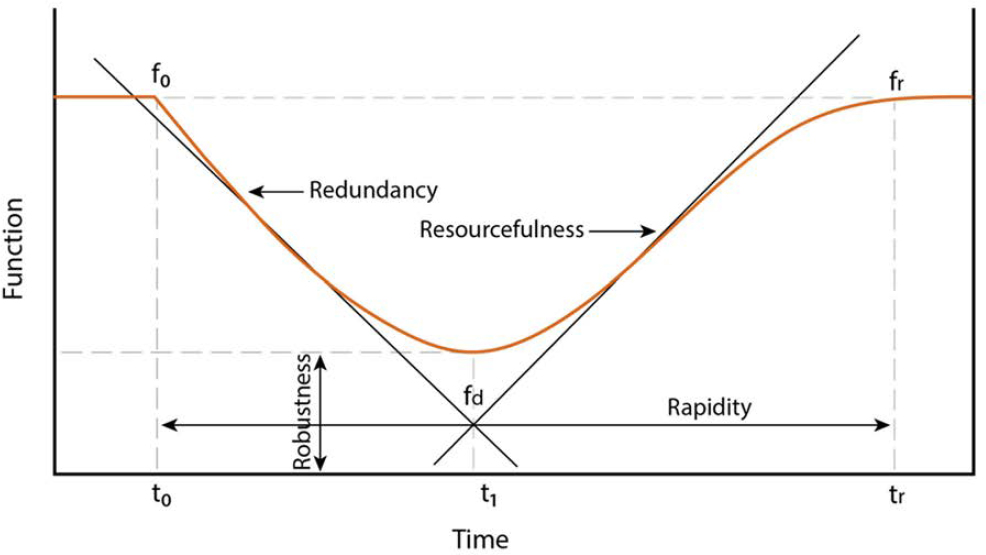
To conceptualize the Four Rs of Resilience, we provide an analogy of a person experiencing a flat tire to their vehicle. This event would reduce their ability to conduct day-to-day tasks and disrupt their activities. There are various actions they could take either before, during, or after this event that could help them be more resilient to this disruption and conduct their activities. Access to a spare tire in the car or having another vehicle in the household signifies redundancy. Maintaining the condition of their tires or having puncture-resistant tires installed indicates robustness. Access to towing to or a tire inflator to be able to take the vehicle to a repair facility is a measure of resourcefulness. Being able to schedule a prompt repair of their vehicle indicates rapidity.
Task 3. Developing Representative Case Studies
Following the literature review, the research team developed five case studies to develop a deeper understanding of the state of practice into how state DOTs are measuring resilience. Originally called a “best practices” scan in the Amplified Workplan, this was renamed to “case study” so as not to constrain continued evolution of DOT practice into measuring resilience by classifying something as a “best practice”, to indicate the upside for more creative practices and methods as research and practice continues to improve. The objective of this review was to understand the current context and level of maturity that DOTs have in setting resilience goals and objectives, developing measures to track the progress toward those goals and objectives, and implementing those measures into their performance management processes.
Figure 7 provides an overview of the case study development process that the research team undertook to identify and develop the case studies. This process started with a desk scan of 18 cases selected based on research team experience and consultation with other experienced practitioners.
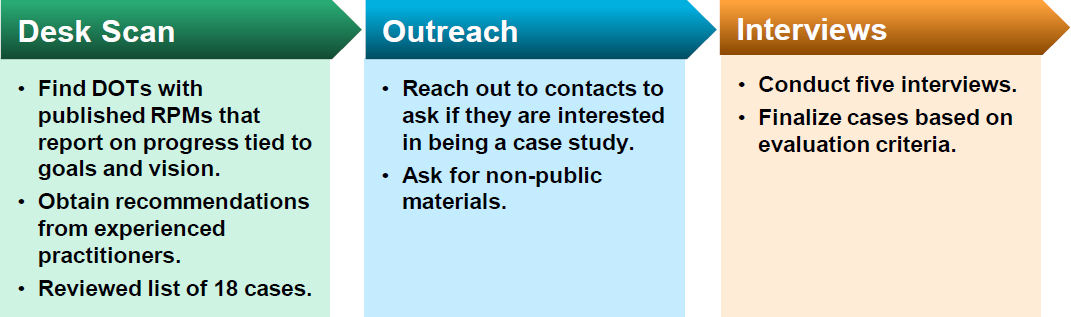
Based on the desk scan, the research team identified eight potential cases to develop into case studies and proceeded to conduct outreach to those cases based on a set of common evaluation criteria. These criteria were centered around a series of questions addressing topics such as the process and usage of RPMs, measurement and data collection, and community resilience. The questions included:
- What agency goals and visions are the RPMs aligned to? (Process and Usage)
- Have the RPMs been incorporated into decision-making? (Process and Usage)
- Are there targets that have been set and tracked over time? (Process and Usage)
- What data is the agency collecting to measure their RPMs? (Measurement and Data Collection)
- How are they using data measurements to track resilience efforts? (Measurement and Data Collection)
- Is there a standardized data collection process to generate and report their metrics? (Measurement and Data Collection)
- What data is the agency collecting to measure their RPMs? (Community Resilience)
- How are they using data measurements to track resilience efforts? (Community Resilience)
- Is there a standardized data collection process to generate and report their metrics? (Community Resilience)
As part of that outreach, the research team conducted five interviews and developed five “final” case studies from what they have learned. These final five case studies represented examples from diverse geographies, applicable to roadway assets of various classes (e.g., bridges, ITS, pavement, culverts), with one international example. These included:
- Colorado DOT—This agency has a robust process for calculating annualized risk that it applies to a variety of assets and incorporates into decision-making. Additionally, its criticality construct incorporates community resilience such that its measurement of risk considering impacted communities, making it the best example the research team found of an RPM that considers users.
- Maryland DOT—This agency has a standardized process for measuring response to winter weather events, and it incorporates that measurement into its decision-making about how to improve its response and reduce the time it takes to restore normal service.
- Iowa DOT—This agency has invested in developing a multi-scale resilience index that attempts to capture multiple components of resilience including network density, delays, and canceled trips resulting from hazard events.
- Minnesota DOT—This agency has developed measures related to culverts and the trunk highway system and measures the impact of natural solutions to achieve goals established by the state legislature. The process of how these measures have been developed can help inform other agencies how to implement RPMs.
- Examples from the European Union (EU)—Two projects from the EU and European Commission, the FORESEE project and the ICARUS project, provide a model for how to measure resilience using a consistent framework tied to the Resilience Triangle. This model can be applied to agencies facing different contexts and hazards, thus allowing for an equivalent comparison of resilience across many situations.
The case studies reveal that state DOTs have made significant progress in incorporating resilience into their agencies. Many strategically preparing for natural hazards and other disruptions that have impacted them already and are expected to worsen, such as Minnesota DOT’s measurements of flooding on the trunk highway system or Colorado DOT’s annualized risk calculation methodology.
A common success factor among several DOTs is the creation of cross-disciplinary resilience groups that explore how to measure resilience, implement draft PMs, and change the culture of the agency, leading to broader acceptance of the resilience practice. Finally, agencies are taking advantage of opportunities to leverage existing processes, such as snow removal operations (road weather information systems) or asset management data collection (condition information like scour criticality), to leverage lower-hanging fruit and implement resilience performance measures.
However, state DOTs are also facing challenges in measuring the impact of their resilience initiatives. The review of the practices in the EU elucidates that they are making considerable progress in using a systematic and holistic approach to measuring resilience. Additionally, one key takeaway is that agencies are finding it challenging to incorporate future projections and natural hazard variability into assessing future performance and setting targets to track progress. As well, some agencies have made progress on developing robust methodologies to incorporate community resilience into its measurement and assessment of resilience. This has continued to become more prevalent due to the development of PROTECT compliant resilience improvement plans and incorporation of community resilience as part of plan development (primarily through designation criteria and evaluation of potential strategies). Yet, many recognize there are opportunities for RPMs to consider the distribution of impacts to different users of the system. For more information, each case study is included in Appendix B of this Final Report.


