Impacts and Performance of State DOT Resilience Efforts (2025)
Chapter: Appendix B: Case Studies

COLORADO DEPARTMENT OF TRANSPORTATION (CDOT)
BACKGROUND AND IMPETUS
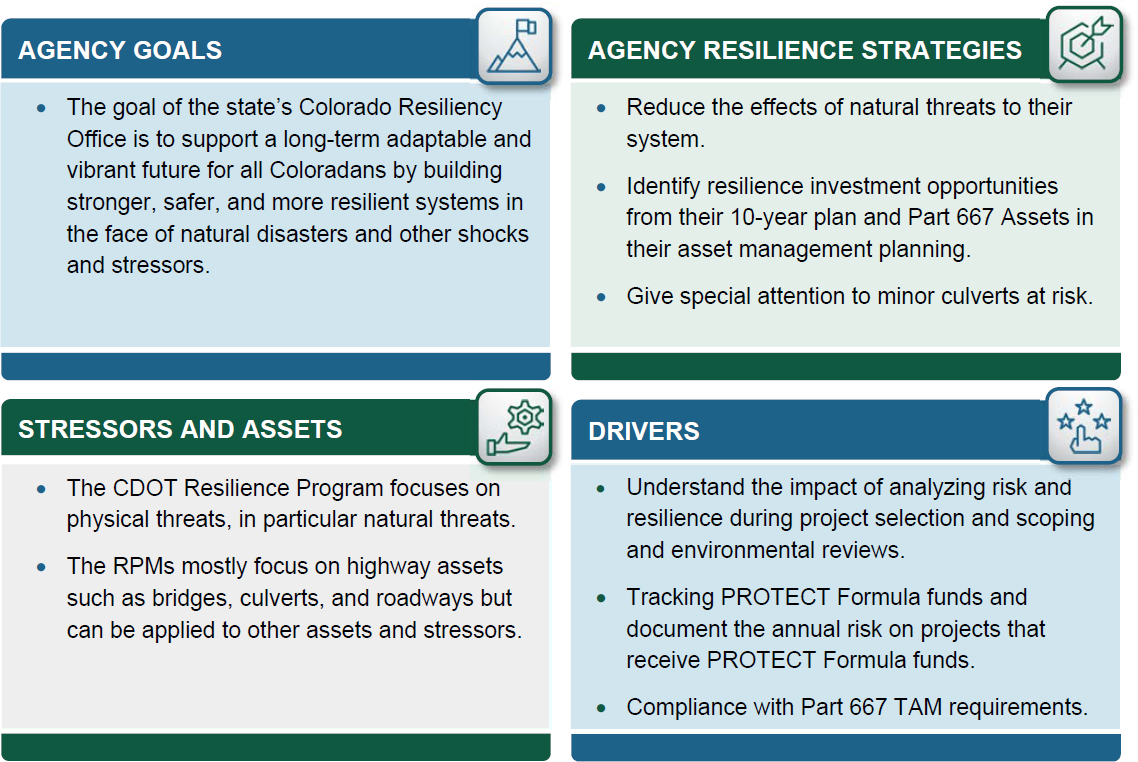
Resilience has been a priority for CDOT since Colorado experienced catastrophic flood events in 2013, requiring more than $700 million in emergency repairs. Since then, CDOT has invested in developing resilience assessment methodologies, system criticality maps, and improved data collection. They created a resilience program to be better prepared to withstand the negative effects of natural threats and make better informed investment decisions. In addition, to support the state’s resilience goals, the Transportation Commission adopted a policy directive in November 2018 which directs CDOT to incorporate resilience in strategic decisions regarding assets and operations.
In 2022, CDOT published a manual to guide their staff conducting quantitative (monetized) risk assessments and economic analysis of resilience improvement efforts. This methodology is the basis for how CDOT prioritizes and selects resilience investments (R&R Project Scoring Tool). Following the manual, CDOT developed multiple tools including a Detour Identification Tool and an Asset Resilience Mapping Application. CDOT developed performance measures to estimate the effectiveness of their resilience decisions. As of September 2023, these draft RPMs are currently under revision for approval.
DRAFT RESILIENCE PERFORMANCE MEASURES
| RPM | Description | Applicable Assets | Applicable Hazards | Thresholds or Targets | Data Sources |
|---|---|---|---|---|---|
| Reduce the annualized risk of Projects in the 10-year plan that include PROTECT funding. | Ensures that projects that are already planned and budgeted for include factors that help to reduce the risk of the assets/site from particular stressors, making sure they will withstand damage, reducing the need for repair or replacement from those stressors. | Any | Any | Potential Target = X% reduction per year. CDOT can set the target based on the funding per year and estimated construction schedule | Asset(s) data, threat data, traffic data, and CDOT Risk and Resilience Analysis Procedure |
| Track compliance with Part 667 Asset Management Requirements | The areas where damage has occurred in the past and needed emergency repairs are tracked and analyzed to identify the potential stressors and vulnerabilities. | Roads, Highways, and Bridges | Any | N/A | Database of Twice-Damaged assets |
| Reduce the overall annualized risk of poor rated culverts on critical routes. | Identifies critical poor-rated minor culverts at risk from flooding and other related threats and measure the effectiveness of resilience improvement strategies (e.g., increase in maintenance) and the effect on risk reduction. | Minor culverts | Flood | Target = XX% each Fiscal Year | Criticality and risk assessments; minor culvert data; and rain and flood data, and CDOT Risk and Resilience Analysis Procedure |
| Capital construction projects that complete a resiliency analysis | This measure identifies and prioritizes projects that have resilience components and that help to reduce risk. It also helps to identify resilience strategies that provide higher risk reduction and greater benefit-cost ratios. | Any | Any | Potential Target = 100% | Project data; threat data; and risk assessment data |
| Track environmental reviews that analyze and document risk and potential resilient solutions. | This measure incorporates resilience at an early stage during environmental review. The assumption is that this will identify resilience concerns and to include resilience strategies during project development. | Any | Any | N/A | Environmental review data |
CDOT’s RPMs are currently in draft status.
CDOT’s proposed RPMs will measure the effectiveness of resilience improvements in the following areas: PROTECT Formula Funds, Asset Management, Maintenance and Operations, Project Prioritization and Scoping, and Environmental Documents. Even though CDOT’s RPMs are not tied to particular goals, all the RPMs help CDOT to support the Colorado Resiliency Office’s resilience goal to support a long-term adaptable and vibrant future for all Coloradans by building stronger, safer, and more resilient systems in the face of natural disasters and other shocks and stressors.
IMPLEMENTATION TAKEAWAYS
Though CDOT’s RPMs have not been implemented yet, the use of the RPMs will require a deep understanding of resilience (all RPMs) and specific knowlwedge on how to conduct annualized risk assessments following their methodology (RPMs 1-4). Since 2013, resilience has been a priority for the agency and the state with the adoption of resilience PD 1950.0. CDOT has established a Resilience Program, a Resiliency Working Group and an Executive Oversight Committee to help implementing resilience across all aspects of agency operations and created a better culture for resilience. In addition, CDOT resilience efforts include collaboration from agency’s subject matter experts from different areas identifying the importance and benefits of incorporating resilience in all functions. As an example, the Chief Engineer and Deputy Chief Engineer fully support the integration of resilience into the project scoping.
SUCCESS FACTORS
The adoption of a resilience policy and creation of a Resilience Program have encouraged collaboration among the different agency functions and fostered a culture for resilience and leading to organizational change. The development of a risk and resilience standard procedure to conduct quantitative risk assessments and associated tools, and supporting resilience capacity building, have been key factors in the development and future implementation of RPMs.
REFERENCES
- Interview with the Performance and Asset Management Branch Manager at Colorado DOT
- CDOT Website - CDOT Resilience Program and associated content
- CDOT’s draft Resilience Performance Measures report

EXAMPLES FROM THE EUROPEAN UNION
BACKGROUND AND IMPETUS
Over the past several years, the European Union (EU) has funded research and innovation projects throughout Europe, including resiliency-focused research. This includes a series of two projects. First, the FORESEE project, funded by the European Commission, was developed with the aim to create guidelines for the assessment of resilient transport infrastructure. These guidelines led to the subsequent project, ICARUS, funded by the Conference of European Directors of Roads (CEDR) which focused on resilience of road infrastructure in relation to climate change. These projects are supporting national regulatory authorities (NRA) in Europe to bolster road infrastructure resilience in the face of climate change, while also creating a “decision tree” to help NRAs to choose appropriate climate change adaptation measures, for different stages of the project life cycle, and at different organizational levels. FORESEE and ICARUS have varying levels of implementation, but certain partner cities have demonstrated case studies.
These years of research and development have now led to an array of deliverables. The focus of this case study example is the Resilience Impact Score that provides guidelines and approaches for classifying the effect of hazards and impacts on the resilience of roads.

RESILIENCE PERFORMANCE MEASURES
| RPM | Description | Applicable Assets | Applicable Hazards | Thresholds or Targets | Data Sources |
|---|---|---|---|---|---|
| Resilience Impact Score |
| Any | Any | See Figure 1 and 2 below. | Multiple |
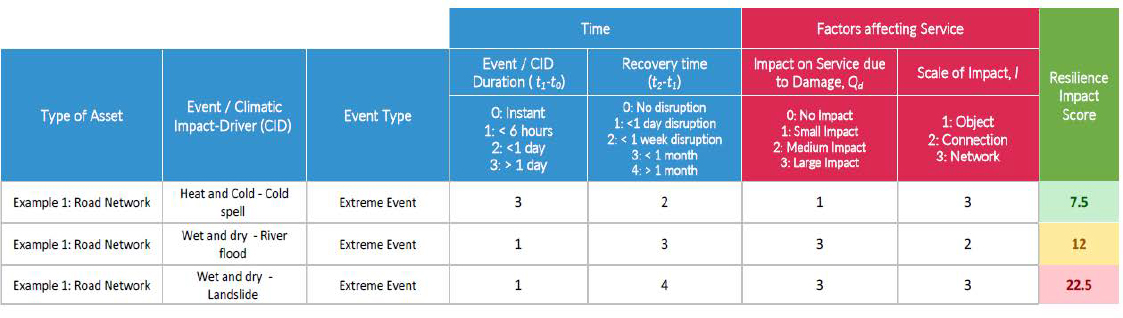
- The European Commission’s model for measuring resilience starts with the resilience triangle (Figure 1). From this triangle, the Resilience Impact Score is calculated as the area of the triangle based on the time of the event (tE) plus the time of the recovery (tR), and the loss of functionality due to the impact on service and scale of damage (QD) multiplied by the scale of impact (I). Figure 2 provides an example of three asset-threat pairs used to illustrate the impact of relative resilience.
- This classification technique may be used to identify high impact climate events which cause network disruptions. It can also be used to compare impacts of different events on assets and help with decision-making processes. For example, “impact of service due to damage,” can be a proxy measure for robustness resilience strategies. If higher scores are achieved, then adaptation options should be considered to increase asset resilience.

Source: Garcia-Sanchez, D., de Paor, C., Turienzo, E., Connolly, L., Paz, J. (2023), Report on impact chains, vulnerability and hazard classification, ICARUS project, CEDR research
Source: Garcia-Sanchez, D., de Paor, C., Turienzo, E., Connolly, L., Paz, J. (2023), Report on impact chains, vulnerability and hazard classification, ICARUS project, CEDR research
IMPLEMENTATION TAKEAWAYS
- In respect to the NRAs, there are a lot of barriers to implementation of resilience assessments or climate change adaptation from within their organizations. These may range from cost, lack of awareness or other reasons.
- Stakeholders and agencies interchangeably using the concepts of risk and resilience can lead to divergent expectations and confusion.
- Assessing an agency’s priorities and importance of resilience (e.g. redundancy versus robustness) is a critical decision factor in weighing scores.
SUCCESS FACTORS
- Quantifying resilience is a key step in understanding how to measure resilience. This also helps determine a baseline of resilience, where impacts are most felt and supports comparison and prioritization. Prior to quantifying resilience, it is important to first understand the decision-making context of the agency in order to understand how resilience should be quantified and link outcomes of a resilience assessment to the decision-making process.
- Generally resilience measurements and assessments are very complex as there are so many variables, so simplifying that process while providing a way to compare resilience of different assets is a benefit.
REFERENCES
- Interview with Alan O’Connor, Professor of Structural Engineering at Trinity College (Dublin)
- Adey, Bryan Tyrone; Martani, Claudio; Kielhauser, Clemens; Robles Urquijo, Ignacio; Papathanasiou, Natalia; Burkhalter Marcel (May 2019) Guideline to measure Levels of Service and resilience in infrastructures: Deliverable 1.1 ICARUS project, CEDR research, available via https://icarus.project.cedr.eu/icarus-resources/
- Kielhauser, Clemens; Martani, Claudio; Adey, Bryan Tyrone (December 2019) Guideline to set target levels of service and resilience for infrastructures: Deliverable 1.2 ICARUS project, CEDR research, available via https://icarus.project.cedr.eu/icarus-resources/
- Garcia-Sanchez, D., de Paor, C., Turienzo, E., Connolly, L., Paz, J. (2023), Report on impact chains, vulnerability and hazard classification, ICARUS project, CEDR research, available via https://icarus.project.cedr.eu/icarus-resources/
- Bles, Thomas et al., (2023), Guidelines on using performance metrics to make the case for adaptation: Deliverable 2.2 ICAURS Project, CEDR Research, available via https://icarus.project.cedr.eu/icarus-resources/
THE IOWA DEPARTMENT OF TRANSPORTATION (IOWA DOT)
BACKGROUND AND IMPETUS
Following the 2019 floods that severely impacted the Missouri River and Mississippi River, resiliency has become a building block of stewardship at Iowa DOT, with the department beginning to integrate resiliency principles into the decision-making process and project development. This includes conducting a flood resiliency analysis to identify locations on the Primary Highway System vulnerable to a 100-year flood event, focusing on the robustness and redundancy of the system. This analysis was eventually integrated into the State Long-Range Transportation Plan. There are two established working groups, Resiliency and Sustainability, who meet regularly to fulfill established charters. The Resiliency Working Group has been created to ensure that, in the face of uncertainty caused by natural or man-made disruptions, the Department will be ready to meet its commitment of providing a safe, efficient, and convenient transportation system. In the same vein, the DOT has acquired services from the Iowa State University to develop the Multi-Scale Resilience Index, a system-level resilience measure that can be used to evaluate system performance and costs and estimate the impact of investments on system resilience; this research forms the basis of this case study.

RESILIENCE PERFORMANCE MEASURES
| RPM | Description | Applicable Assets | Applicable Hazards | Thresholds or Targets | Data Sources |
|---|---|---|---|---|---|
| Multiscale Resilience Index (MRI) | The MRI helps to determine how much a flood disrupts a network or a community. See below for details | Roadways | Flooding | N/A | Roadway management system, traffic systems data and 2040–2050 projections, bridge management system, maintenance and inspection information, asset structural data |
- The MRI methodology (diagramed in Figure 1) creates a network with nodes and links and evaluates the damage to the network for different sized flooding events. It includes calculating:
- » Geographical performance - the number of closed assets
- » Topological performance - the performance of the network based on node degree, link density, and network robustness.
- » Operational performance - the delay experienced by users and associated fuel costs.
- » Opportunity costs - cancelled trips due to the hazard damage.
- Two different projects were undertaken to prove the robustness of the MRI as a way to assess and enhance the resilience of a transportation network and use it as a tool for prioritizing projects and foment pre-event mitigation and post-event recovery strategies:
- » The first project used the MRI on the large network of Iowa DOT District 6, a 12-county region in east-central Iowa with 4,280 lane miles of highways, including 872 lane miles of Interstate and 860 bridges. Under different flood scenarios the MRI was used to identify flooding hotspots. The availability to adjust weights of different contributing measures in the MRI allows for inclusion of the DOT’s missions and goals as they change for the purpose of decision making.
- » In the second project, the MRI was utilized at the project level. For this project, Iowa Highway 21 (IA 21), which has had multiple recurrent flooding events was chosen. As well, IA 21 has had multiple recurrent flooding events, and once IA 21 floods, there is no close travel route to the west or east that is usable given other roads also being flooded. The MRI was used to measure the impact of different flood mitigation strategies. The applicable mitigation strategy was to raise the roadway (a strategy being evaluated by Iowa DOT to prevent the recurring closures on this road). A benefit/cost analysis based on the MRI concept was used to assess the best strategy under the variety of flood hazards.
- The MRI is being considered as a possible new factor in the project prioritization tool (PPT). The current factors are safety, mobility, traffic, bridge, pavement, freight, and road class. Thus, when the Department is conducting a feasibility study for investments, if there are two assets (or set of assets) that have the same ranking, the one with a higher resilience need would score higher.

Source: Alipour, A. (October 2020). Assessing and Enhancing Transportation Resilience for the State of Iowa - Tech Transfer Summary
IMPLEMENTATION TAKEAWAYS
- The MRI considers the impact of different measures on network performance after flood events. It can be used to evaluate the performance of transportation networks based on the extent of disruptions, measuring the impacts when transportation network elements, including nodes and links, are disabled, degraded, or destructed.
- The Iowa DOT is planning to include resilience indices, like the MRI, as a factor for planning and investment purposes. They are currently using the MRI more qualitatively in the PPT process.
- Iowa State University began the development of the MRI by merging and layering multiple different data systems (see Data Sources above). Once the data was compiled, calculation of the MRI was discussed collaboratively within various DOT teams. The DOT is now moving to automate and standardize all those data sources to further integrate for MRI in their planning and performance management processes.
SUCCESS FACTORS
- Iowa DOT worked collaboratively with the Iowa State University research team to compile the data they needed. Regularly scheduled weekly meetings with multiple offices and bureaus, and a real willingness to explore data and learn, were key success factors.
- Project champions and visionary DOT personnel helped push this project forward.
- Completing this study modularly, in two separate yet complementary projects, was a benefit because of the robust research methodology that resulted.
REFERENCES
- Interview with Principal Investigator Professor Alice Alipour from the Department of Civil, Construction and Environmental Engineering at Iowa State University, working on behalf of the Iowa DOT.
- Alipour, A., Shafei, B., Zhang, N., and Lichty, B. (October 2020). Assessing and Enhancing Transportation Resilience for the State of Iowa.
- Alipour, A. (October 2020). Assessing and Enhancing Transportation Resilience for the State of Iowa - Tech Transfer Summary.
MARYLAND DEPARTMENT OF TRANSPORTATION – STATE HIGHWAY ADMINISTRATION
BACKGROUND AND IMPETUS
In their recent Climate Change Resilience Strategy document, Maryland State Highway Administration (SHA) identified coastal hazards, flood hazards, extreme temperatures, soil movement, and severe weather as threats that are most likely to impact the highway system. Because Maryland’s coastal zone encompasses two-thirds of the state’s land area and is home to almost 70% of Maryland residents, hazards, such as sea level rise, storm surge, saltwater intrusion, and accelerated coastal erosion are significant threats to Maryland’s transportation system infrastructure overall.
Given current and projected climate change risks, Maryland policymakers recognize the importance of mitigation and resilience improvement actions, and have passed two critical pieces of legislation:
- Maryland General Assembly 2018 Senate Bill 1006 (House Bill 1350) and House Bill 1427 (2019) which required the adoption and application of specific “Coast Smart” siting and design criteria to address impacts associated sea level rise and coastal flooding on future capital projects.
- Maryland Climate Solutions Now Act (2022) which sets goals of reducing greenhouse gas emissions by 60% by 2031 and establishing a carbon neutral goal by 2045.
Development of Resilience Performance Metrics (RPM)
MDOT modal administrations have been pursuing resilience metrics for several years with the primary emphasis being on return to normal operations. There is also a recognition by MDOT that the range of threats and magnitudes should be reflected in their resilience metrics – for example – the time required to return to normal operations after a major tropical storm affecting a large portion of the state would be expected to vary from the recovery time for a micro-burst storm affecting a smaller portion of the system. The agency is moving toward the development of Resilience Performance Measures (RPMs) that capture this nuance to help better understand how the agency’s investments may improve return to normal operations for a range of events. Similarly, MDOT is considering RPMs that are at the asset level as well as the system level. For example, bridge conditions may contribute to that asset’s ability to withstand a particular magnitude of threat, but the performance of that individual asset may also drive system resilience. MDOT leadership is considering both in the development of new performance metrics.

RESILIENCE PERFORMANCE MEASURES
| RPM | Description | Applicable Assets | Applicable Hazards | Thresholds or Targets | Data Sources |
|---|---|---|---|---|---|
| Number of cost-benefit analyses completed | Implementation-based metric to track assessments completed to determine ROI for resilience investments | All | All | Not established/provided | Not provided |
| Number of roadway closures due to flooding | Impact-based metric to track the effect of flood events on travelers | All | Flooding, tropical storms, rain-on-snow | Not established/provided | E911, police reports, CHART data (traffic operations center) |
| Number of (repeat) reactive maintenance/repair work orders due to climate/flooding incidents | Maintenance-based to track repeat impact from flooding to roadway operations | All | Flooding, tropical storms, snow, ice | Not established/provided | Maintenance work-orders |
| Percentage of facilities that can accommodate a set threshold of sea level rise (e.g., 3 ft) | Design-based to track the number of projects incorporating resiliency measures | All | Flooding, tropical storms, precipitation | Not established/provided | MDOT SHA Climate Change Vulnerability Viewer |
| Time to bare pavement post-winter events | Time required to clear SHA-maintained roadways of winter precipitation | Pavements/bridges | Winter precipitation | 4-hours | Winter-maintenance crew records, CHART data (traffic operations center) |
IMPLEMENTATION TAKEAWAYS
Maryland State Highway Administration (SHA) for many years has focused on developing resilience metrics tied to “time to bare pavement” post-winter events. The current target the agency has set post-winter storms is to regain bare pavement within 4 hours of a winter event.
SHA is now in the process of developing new RPMs that address other components of system resilience, for example, system robustness and redundancy. These measures are still under development but are intended to help capture the extent of potential risk from natural threats across the system as well as the potential reduction in travel time through integrated traffic management operations. Additional efforts are being made to capture the investment being made to address system performance in light of climate challenges.
The agency’s climate change resilience strategy outlines over 50 actions to address three major functional areas within SHA including Planning & Programming, Design, and Maintenance and Operations. This strategy also outlines a number of example resilience metrics, some noted in the above table, however, the strategy leaves room for further refinement and adoption of RPMs. The agency views this strategy as a starting point for SHA to manage system resilience and outlines several implementation next steps including training of staff, tracking of performance, expanding vulnerability assessments, and mainstreaming climate risk data into existing processes.
SUCCESS FACTORS
SHA has expended efforts to build tools to assist practitioners in better understanding the vulnerability of highways from inundation through their Climate Change Vulnerability Viewer. These types of tools help to streamline information for decision-making with the intent to expedite the implementation of such information into highway design, planning, and operations.
REFERENCES
- Maryland Department of Transportation State Highway Administration Climate Change Resilience Strategy: A Programmatic Approach to Identifying Actionable Steps to Improve System Resilience.
- Interview with Maryland DOT staff.

MINNESOTA DEPARTMENT OF TRANSPORTATION (MNDOT)
BACKGROUND AND IMPETUS
Minnesota DOT (MnDOT) began its formal exploration into the resiliency practice around 2010. Through strong stewardship and knowledgeable staff, defined working groups and technical advisory committees emerged e.g., the Sustainable Transportation Advisory Council (STAC) and the multidisciplinary Resilience Advisory Team (RAT). Additionally, in 2018, MnDOT formed the Sustainability and Public Health Office with a focus on Transportation System Resilience. RAT was charged with identifying and recommending resilience priorities, discussing potential barriers, redefining how the agency measures climate resilience. They were also tasked with satisfying recent legislative reporting requirements in Minnesota State Statutes 174.01 and 174.03 Subd. 12, which requires MnDOT to enumerate the State’s transportation goals and implement performance measures and annual targets for the trunk highway system to achieve those goals. These resilience performance measures are currently being implemented and are reported annually.

RESILIENCE PERFORMANCE MEASURES
| RPM | Description | Applicable Assets | Applicable Hazards | Thresholds | Data Sources |
|---|---|---|---|---|---|
| RPM 1: Number of stormwater treatment facilities on the trunk highway system | Provides measurement of facilities to mitigate stormwater flooding on the trunk highway system. | Trunk highway system | Flooding, Debris | TBD | Enterprise Asset Management System |
| RPM 2: Number of trees and shrubs planted each year (urban and rural) | Measures a component of a nature-based solution that mitigates flooding impacts. | Trunk highway system | Flooding, Debris | TBD | Enterprise Asset Management System, Maintenance Funds |
| RPM 3: Percentage of seeding using native vegetation | Measures a component of a nature-based solution that mitigates flooding impacts. | Trunk highway system | Flooding, Debris | 75% | Enterprise Asset Management System, Maintenance Funds |
| RPM 4: Percentage of planting using native vegetation | Measures a component of a nature-based solution that mitigates flooding impacts. | Trunk highway system | Flooding, Debris | 85% | Enterprise Asset Management System, Maintenance Funds |
| RPM 5: Highway Culvert Condition | Maintains a state of good repair to harden infrastructure to flooding impacts. | Trunk highway system culverts | Flooding, Debris | 10% or fewer in poor or very poor | Enterprise Asset Management System, AGOL Risk Based Map |
| RPM 6: Bridge Culvert Condition | Maintains a state of good repair to harden infrastructure to flooding impacts. | Trunk highway system bridge culverts | Flooding, Debris | 4% or fewer poor on NHS, 10% or fewer poor | Enterprise Asset Management System, AGOL Risk Based Map |
| RPM 7: Scour Critical Bridges | Maintains a state of good repair to harden infrastructure to flooding impacts. | Trunk highway system scour critical bridges | Scour, flooding, erosion | 0 scour critical on the trunk highway system | Enterprise Asset Management System, AGOL Risk Based Map |
| RPM 8: Maintenance Dollars Spent on Flooding and Washouts | Tracks maintenance dollars expended on the trunk highway system in relation to water hazards | Trunk highway system | Flooding, Erosion | TBD | AGOL Risk Based Map, Enterprise Asset Management System, Maintenance Funds |
| RPM 9: Maintenance Dollars Spent on Pavement Blow-ups | Tracks maintenance dollars expended on the trunk highway system in relation to pavement | Trunk highway system | Extreme heat | TBD | AGOL Risk Based Map, Enterprise Asset Management System, Maintenance Funds |
MnDOT’s proposed RPMs help meet legislative requirements regarding the resilience and condition of the trunk highway system and fulfilling the state transportation goals.
- RPM 1 incorporates best management practices (BMPs) for stormwater management, a component of asset management.
- RPMs 2, 3 and 4 incorporate nature based solutions into a project’s life cycle. These solutions offset impacts from construction, reduce heat and localized flooding, and increasing wildlife habitats.
- RPMs 4, 5, 6, and 7 monitor asset-level resiliency with the ability to be rolled up to the system-level. These also point to assets that need investment and project prioritization to remain in a state of good repair.
- RPMs 8 and 9 track maintenance costs over time that are directly tied to climate-induced incidents and measure MnDOT’s practices (such as full depth reclamation and cold in-place recycling) to determine if these strategies are increasing asset and system resiliency.
IMPLEMENTATION TAKEAWAYS
- The RPMs must be measured annually and provide data foundation for future performance measurements.
- The wide array of typology and data required is a challenge. Likewise, it is hard to take a network level approach to specific project decisions. Estimating costs and future reductions in maintenance costs, for example, is difficult.
- In the beginning, MnDOT took the small wins. For example, as an Asset Management Division, they were able to pull performance measures from the TAM and work collaboratively to see what was available and what benefits they could use their data to measure.
SUCCESS FACTORS
- The formation of the Sustainability and Public Health Office began because of innovative leadership who understood that systems are interconnected and changing. Thus, leadership who intentionally crossed disciplines, created safe spaces to explore, held staff accountable, and provided encouragement were all seen as success factors in growing the resiliency practice.
- MnDOT applies the concept that “resiliency is a verb,” happening across multiple divisions over time. The formalization of collaborative groups, such as the RAT, were valuable to include those with different skills and tools coordinate knowledge sharing from one functional area to another. Benefits from these efforts include increased collaboration across divisions, legislative compliance, and enhanced data collection and sharing.
REFERENCES
- Interview with MnDOT personnel: Manger of Asset Management Project Office and Principal Climate and Resilience Planner.
- MnDOT webpages: Performance Measures, Asset Management, and Sustainability and Public Health.
- 2022 Minnesota Statutes.
- Building Consensus on Resilience Metrics, Transportation Research Board (TRB) Presentation (January 2023).


