Impacts and Performance of State DOT Resilience Efforts (2025)
Chapter: Appendix A: Literature Review
TABLE OF CONTENTS
HISTORY OF PERFORMANCE MEASURES
Defining and Evaluating Performance Measures
Performance Measure Typologies
Classifying Performance Measures: Availability, Productivity, and Quality Measures
TRANSPORTATION PERFORMANCE MANAGEMENT
Performance Based Planning and LRTPs
Performance Measures supporting Agency Objectives
Factors for Success and Lessons Learned
Monetizing Annual Risk to Highway Assets
Critical Infrastructure Sectors
Cybersecurity and Information Technology (IT)
RESILIENCE AND DOT PROJECT DEVELOPMENT LIFE CYCLE
RPMs and the Planning to Operations Continuum
These performance metrics were collected through a series of
Use of RPMs in FEMA Continuity of Operations Plan (COOP)
INCORPORATING COMMUNITY RESILIENCE
Community Resilience in RPM Selection & Evaluation
Measuring Social & Community Resilience to Hazards & Stressors
Building a Case for Resilience Investments
LIST OF FIGURES
Figure 1 Performance Measurement Process
Figure 2 Performance Measure Typologies Flow
Figure 3 Sustainability Performance Measure Framework
Figure 4 Critical Infrastructure Sectors
Figure 5 Utility Resilience Index (URI) Indicators
Figure 6 Assessable or Measurable Aspects of Cyber Resiliency for a System
Figure 7 Cyber Resiliency Metrics Can Repurpose Security, Risk, or Resilience Metrics
Figure 8 Proposed Infrastructure Resilience Indicators and Their Relation to Absorb and Recover
Figure 9 Infrastructure Indicators for What Will Happen During the Hazard Event
Figure 10 Infrastructure: Indicators of What Will Happen After the Hazard Event
Figure 11 Benefits of Collaboration for Performance Measures
Figure 12 Eleven Aspects of Resilience
Figure 13 Acceleration of Deterioration Rates
LIST OF TABLES
Table 1. Literature Review Topics and Sub-Topics
Table 2 FHWA Performance Measures
Table 5 Resiliency Metrics/Measures
Table 7 Example of Energy Resilience Metrics for Electricity Systems at the Facility/System Level
Table 8 Examples of Grid Resilience Metrics for Consequence Categories
Table 9 Examples of Resilience Metrics by Type of Resilience
Table 10 Performance Measures Examples for Asset Management
Table 12 Overview of Case Studies
Table 13 Tools to Measure Social & Community Resilience to Hazards & Stressors
Introduction
Given the impacts of short-term events and long-term stressors, including natural hazard variability, state departments of transportation (DOTs) need tools and approaches to track resilience efforts and investments and measure progress toward improving the resilience of transportation systems. To fulfill this need, the objectives of NCHRP Project 23-26, “Measuring Impacts and Performance of State DOT Resilience Efforts,” are to
- Identify or develop key resilience performance measures (RPMs) for State transportation agencies for roadway transportation systems for various classes of assets (e.g., bridges, intelligent transportation systems (ITS), pavement, culverts);
- Develop an approach that uses performance measures to assess the effectiveness of resilience strategies; and
- Develop a guide to aid state transportation agency practitioners in applying RPMs.
This report documents the results of the first task in this research effort that conducts a literature review of the state of practice related to performance management in transportation and measuring the resilience of highway assets and systems. The objective of this review is to compile and present relevant practice, performance data, research findings, and other information pertaining to the identification and performance of key RPMs for State transportation agencies for roadway transportation systems for various classes of assets.
Overview and Topics
This document will cover findings from the literature on six topics, with two to seven sub-topics each, as listed in Table 1. These topics were developed to build off of recent research into understanding, measuring, and investing in transportation system resilience. The chosen topics ensure that the project team and users of this research have a thorough and common understanding of performance measurement in the transportation field, how to define and measure different components of resilience, and how to successfully implement RPMs into agency decision making. An initial set of topics was presented to the project panel at the January 30, 2023, kickoff and the outline for the literature review was finalized following that meeting after incorporating input from the panel.
Table 1. Literature Review Topics and Sub-Topics
| Topic | Subtopic |
|---|---|
| History of Performance Measures | What are performance measures? How are they evaluated? |
| How performance measures can be classified (typologies) as process, output, and outcome measures. | |
| How RPMs can be classified as availability, productivity, and quality measures. | |
| Transportation Performance Management (TPM) | Review previous efforts of TPM guidebooks, manuals, training, and methods for widespread use and successful adoption. Discuss how they define PMs and connect them to vision and goals, using examples from Long-Range Transportation Plans (LRTP). |
| What makes TPM programs successful, and what have practitioners learned from other TPM initiatives? |
| Topic | Subtopic |
|---|---|
| Measuring Resilience | This includes the definitions, calculation methods, typologies, indices, and recommendations for developing RPMs. |
| This will include a special focus on how agencies calculate monetized annual risk to highway assets. | |
| Allied sectors: water/wastewater. | |
| Allied sectors: energy. | |
| Allied sectors: cybersecurity and information technology. | |
| International Experience. | |
| Incorporate RPMs that are tied to funding and grant programs such as the Promoting Resilient Operations for Transformative, Efficient, and Cost-Saving Transportation (PROTECT) program. | |
| Resilience and DOT Project Development Life Cycle | RPMs and the Planning to operations continuum. |
| Review Transportation Asset Management Plans (TAMPs) that identify current and future extreme weather to roadway transportation assets as they face varying deterioration due to changing frequency of hazards. | |
| Incorporating Community Resilience | Incorporating community resilience into selection of RPMs and evaluation approaches for effectiveness of resilience initiatives. |
| Review of ways to measure social and community resilience to hazards and stressors. | |
| Implementation Considerations | Identify how leadership plays a role in implementing resilience and encouraging the use of RPMs. |
| Review resources that can help practitioners build support from leadership for resilience investments. |
The remainder of this document is organized into sections for each of the six topics of the literature review. Additionally, the end of each section includes a call-out box that summarizes takeaways from the literature review, identifies gaps in the state of practice, and ties the topic to the resilience transportation practice and the anticipated products of this research effort.
History of Performance Measures
Defining and Evaluating Performance Measures
Performance measures are used to monitor and report on a program or project’s progress and results, providing data and insight into the effectiveness and efficiency of the project (United States Environmental Protection Agency, 2023). They are based off metrics and measures, defined below (23 CFR 490.101):
- Metric – a quantifiable indicator of performance or condition. Example: annual number of fatalities.
- Measure – An expression based on a metric that is used to establish targets and to assess progress toward achieving the established targets. Example: A five-year rolling average of number of fatalities.
Performance measurement is defined as the use of statistical evidence to determine progress toward specific defined organizational objectives (US Department of Transportation, 2020). Therefore, a performance measure is an indicator that is used to monitor and report on a program or project’s progress toward meeting established targets. The TPM Toolbox also includes definitions for these terms and others, including “baseline” and “goal” (Federal Highway Administration, 2024).

Source: Original Graphic
Performance measures are chosen to measure the goals and objectives of a project, which are determined at the outset. Goals are broad statements about the desired state of the transportation system and reflect societal concerns and aligned to the overall agency mission. Objectives are more specific and actionable statements that support the agency’s goals. This process is outlined in Figure 1 showing the subsequent steps of setting targets for the performance measures, allocating resources towards them, and then measuring and reporting the results. This is an iterative process if the project continues, where goals and objectives are then reconsidered.
Measuring performance is critical to not only determine the outcomes and effectiveness of a program, but also set benchmarks from historical data, unveil strengths and weaknesses in the program, and show areas of improvement (United States Environmental Protection Agency, 2023). A common way to define and evaluate performance measures is to use the Specific, Measurable, Attainable, Realistic, and Time-bound (S.M.A.R.T) framework (United States Department of State, n.d.) & (University of California, 2016). This acronym stands for:
Specific: The performance measure is specific and clear about what it is assessing. It should be able to answer who or what the performance measure is assessing.
Measurable: There must be a source of information to measure to determine whether progress has been made. Data sources must be feasible to collect and can be quantitative or qualitative.
Achievable: The goal or targets for this performance measure should be attainable and motivational, not inherently discouraging.
Relevant: The measure’s focus should be aligned with the goal and objective(s) it is under.
Time-bound: Providing a time frame for the performance measure ensures there is a defined time to measure progress, and it provides a sense of urgency.
Performance Measure Typologies
Performance measures can be classified into several types, including process, output, and outcome measures (National Research Council, 2005). Process measures monitor project implementation by assessing the project’s activities and whether they are done according to a work plan or protocols (John Jay Research and Evaluation Center, n.d.). Process measures are often collected before, during, and after project
implementation (John Jay Research and Evaluation Center, n.d.). Output measures assess the end product, which is typically the number of products and services delivered during a specific period of a project (National Research Council, 2005). Outputs do not provide the results achieved or consequences of the services or products provided during a project. Instead, it provides information on what the project produced itself, or the scope or size of the project (United States Department of State, n.d.). Outcome measures assess the results of a project’s activities. These results are often the benefits sought by implementing a particular project. Part of determining outcomes is ensuring the results are due to the project, not external influences (National Research Council, 2005). Especially for large projects, outcome measures can be broken down into short, medium, and long-term outcomes. The long-term outcome, or end outcome, is the highest-level objective the project has been designed to achieve and that the program managers are willing to be held responsible (United States Department of State, n.d.). This process is graphically shown in Figure 2.

Source: Original Graphic
Classifying Performance Measures: Availability, Productivity, and Quality Measures
Performance measures can be classified into three categories: availability, productivity, and quality measures (Poulin & Kane, 2021). These categories were created in Poulin & Kane’s 2021 journal article focused on infrastructure resilience curves, where performance measures are the vertical axis of a resilience curve. Performance measures can assess system availability, system productivity, or service quality.
Availability measures quantify the capacity or aggregated functionality of a system and is typically expressed as a count with a higher number desired. An availability measure is used when interested in the infrastructure system itself, not the outcome or quality of the service provided. Examples include bridge loading capacity or number of cranes at seaport (Poulin & Kane, 2021).
Productivity measures focus on the quantity of the service provided by a system and is often expressed as a flow or rate, with higher values desired. These measures assess whether the service demand is met, as it is a function of supply, capacity, and demand. Productivity measures are most appropriate when service demand is expected to change within the scenario duration. Examples include flood volume relative to rainfall and water demand satisfied (Poulin & Kane, 2021).
Lastly, quality measures describe the character of service provided by an infrastructure system. These measures vary widely depending on what units they are expressed as since the measures are driven by the context of environment. Quality measures can provide a deeper look at performance which availability and productivity measures miss. Examples include average vehicle speed and water quality index (Poulin & Kane, 2021).
Summary: Performance measures (PMs) are critical to examining and understanding system effectiveness, importance and function, and are often dynamically created in order to align with the goals and objectives. There are various typologies of PMs which allow for researchers to evaluate process, outputs, and outcomes.
Gaps: PMs are utilized in many fields but are not interchangeable between disciplines. Their specific application must be customized to meet the goals and objectives of practitioners, policymakers, and the broader public. This has not been fully developed in the resilience space.
Relevance for Practice: Before being able to measure and evaluate resilience efforts, it is vital to define and understand the different types of performance measures including those that measure resilience. Understanding the different types of PMs will allow for better evaluation in a specific topic area.
Definition of a Transportation Resilience Performance Measure: A quantifiable indicator of service continuity that reflects one or more characteristics of transportation infrastructure’s ability to anticipate, prepare for, adapt to, withstand, respond to, and recovery rapidly from hazard impacts and other disruptions. It can be used to establish targets and assess progress toward achieving those targets.
Transportation Performance Management
The Federal Highway Administration (FHWA) defines TPM as a strategic approach that uses system information to make investment and policy decisions to achieve national performance goals (United States Department of Transportation and Federal Highway Adminstration, n.d.). Through this process, targets and goals are set to create a better-performing transportation system. The FWHA TPM Toolbox was created by FWHA to assist transportation agencies in implementing TPM practices through collaboration with MPO, State DOT, and transit agency members across the country. Through this process, targets and goals are set to create a better-performing transportation system. The following documents and tools were reviewed to evaluate best practices for the TPM process around the country:
- FWHA TPM Toolbox
- FWHA TPM Guidance
- NCHRP Report 708: A Guidebook for Sustainability Performance Management for Transportation Agencies
- Standing Committee on Performance Management (SCOPM) Task Force Findings on MAP-21 Performance Measure Target Setting
Strategic Direction
According to FWHA’s TPM Toolbox, the first step in the TPM process is establishing a long-term strategic direction for the agency. This means determining the goals, objectives, and performance measures.
Using frameworks such as the S.M.A.R.T can support the process of defining performance measures and serve as a tool to keep an agency’s objectives on course. Tracking of these performance measures is closely tied to the availability of data in the region. Performance measures should be measurable with the available tools/data, forecastable, clear to the public and lawmakers, and the agency should be able to influence the result (Federal Highway Administration, n.d.).
NCHRP Report 708: A Guidebook for Sustainability Performance Management for Transportation Agencies enumerates examples along with best practices involving the development of performance measures for sustainability (Zietsman et al. 2011). It outlines a six-step process for implementation:
- Step 1 – Understanding sustainability.
- Step 2 – Developing transportation sustainability goals. They recommend 11 goal areas.
- Step 3 – Developing objectives, which are specific actions to meet the goals. They categorize objectives into six possible focus areas of a transportation agency.
- Step 4 – Developing performance measures, which are based on output, outcome, or process measures.
- Step 5 – Implementing performance measures.
- Step 6 – Refining the framework and applying feedback.
Step 1 is particularly relevant to the initial stages of TPM because it enlists agencies to understand the breadth of the topic at hand, which can mature into a clear understanding of what needs to be accomplished. Best practices mention starting with a big-picture perspective, such as by defining a sustainable society and working from there to see how a transportation system fits in (Zietsman et al. 2011). Once the direction is set, then staff can begin to develop goals. Sustainability figures into several parts of a transportation pipeline, such as:
- Long-range planning: where expectations for sustainability performance can be discussed and goals can be established that drive investment patterns.
- Short-range programming: Where broad expectations and goals about sustainability are translated into explicit targets associated with implementation of specific projects.
- Project level – performance measures used to inform project-level planning decisions.
Figure 3 is an example framework for transportation agencies to conceptualize performance measures related to sustainability.
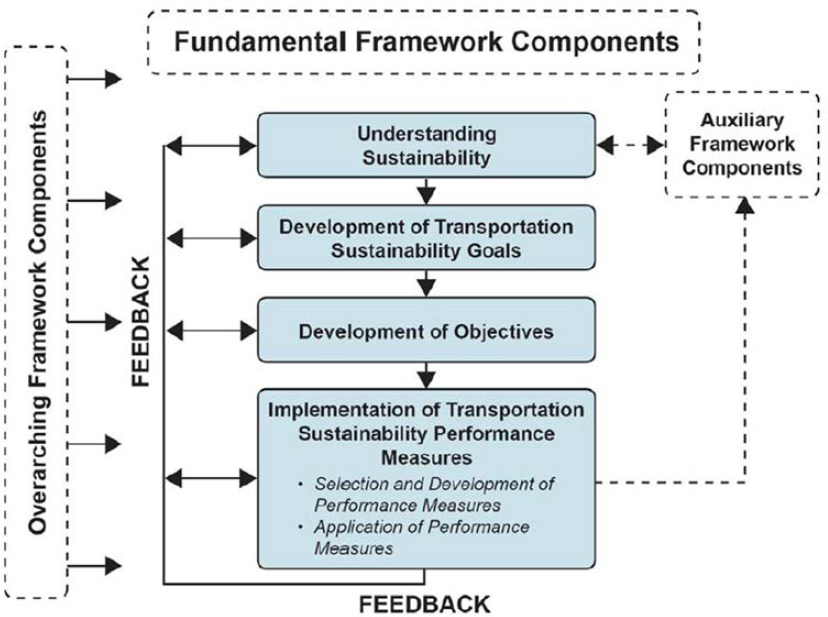
Source: (Zietsman et al. 2011).
To implement performance measures, the Guidebook recommends developing a description of the measures and associated actions and trend; introducing an evaluation to judge performance; identifying who is responsible and accountable; incorporating the performance measure into decision-support; and communicating about the performance measure to internal external stakeholders. They recommend the following steps for successful implementation, which are further elaborated within the following sections:
- Determine the appropriate scale of the performance measure.
- Determine appropriate application for each measure, goal, or focus area (target setting).
- Establish a reporting system and schedule with roles and responsibilities (tracking and reporting).
- Set benchmarks that are tracked to the factors that influence a performance measure.
Target Setting
The next step of the TPM Toolbox process is target setting. This step utilizes the previously decided goals, objectives, and performance measures to determine what specific quantifiable outcomes the agency wants to achieve. When target setting there are two subcomponents to consider, technical modeling and the business process (Federal Highway Administration, n.d.). The technical modeling component considers the historical, current, and project performance data to observe a baseline and evaluate performance trends in the data to establish the target. In the business process, agencies establish a collaborative process for internal
coordination to determine and change the performance targets over time (Federal Highway Administration, n.d.).
For federal long-range planning purposes, targets are established by the federal-aid highway funding recipients (MPOs or state DOTS) based on the regional data available for the measures in order to document future performance expectations. Targets should be logical, focused on data analysis and projections of future efforts (United States Department of Transportation and Federal Highway Adminstration, n.d.). These targets should be considered interim conditions that lead toward longer-term performance expectations. United States DOT still provides oversight of target setting and coordination even though it is the duty of the MPOs and state DOTs to set the targets.
Different states and municipalities will have different target values due to differences in funding levels, population growth, environmental conditions, and specific priorities (AASHTO, 2013). The AASHTO SCOPM Task Force on Performance Measure Development created a document to assist state DOTS and MPOs in setting targets related to the national performance measures. This document sets forth some recommendations for state DOTS and MPOs to choose their target values (AASHTO, 2013):
- Provide flexibility between different regions;
- Focus on long-term goals and better decision making based on customer and stakeholder requirements instead of a single target value;
- Align the target measures with system ownership and funding levels;
- Base target setting on longer-term trend data;
- Target setting should be attainable given the level of investment, DOTs and MPOs should only be accountable for what they manage and control;
- Analysis and reporting on the targets should be both qualitative and quantitative;
- Avoid unachievable targets with funding constraints factored into the process;
- Allow for appropriate timelines for target achievement, targets can be reevaluated and adjusted to reflect priority changes or new funding changes;
- Guard against unintended consequences such as neglecting long-term system needs;
- Provide a rationale for selecting specific target values, if the goals are not met, describe what has been done to improve performance; and
- Allow flexibility for DOTs and MPOs to use a risk-based target-setting approach.
Performance-Based Planning and LRTPs
After goals, objectives, performance measures, and specific targets are determined, the process of performance-based planning occurs to develop strategies and priorities in long-range transportation planning and other processes. Using the specific target determination for the chosen performance measures, strategy identification can occur to achieve desired outcomes through data trends, forecasting tools, economic analysis tools, and management systems (United States Department of Transportation and Federal Highway Adminstration, n.d.). Investment prioritization is then completed by evaluating tradeoffs across investment scenarios. These decisions should be grounded in performance data, strategic goals, and risk assessment (United States Department of Transportation and Federal Highway Adminstration, n.d.).
Using the strategies and priorities determined in the performance-based planning stage, performance-based programming guides the allocation of resources to achieve the agency’s goals, objectives, and performance measures (United States Department of Transportation and Federal Highway Adminstration,
n.d.). This process results in Transportation Improvement Program (TIP) documents and a State Transportation Improvement Program (STIP) to identify projects that will get funding, sources of the funding, and the time frame for implementation. Project selection criteria based on the performance measures can be utilized to screen projects. When programming projects across performance areas it is helpful to consider project scoring, prioritizing projects based on the value of the project per dollar spent, optimizing based on budget constraints, and conducting a trade-off analysis between investment scenarios to determine the impacts on all performance areas (United States Department of Transportation and Federal Highway Adminstration, n.d.).
Tracking and Reporting
An essential part of a TPM process is tracking and evaluating the actions taken and the outcomes that have been achieved from the TPM process. This allows officials to refine or modify the previously determined planning, programming, and target-setting determination. At the system level of monitoring and adjustment, resource allocation decisions are compared to the achievement of the agency’s goals and objectives. At the program/project level, specific programs and projects are assessed. Once the monitoring framework has been established, agencies can regularly assess the results and adjust. This creates a feedback loop for targets, measures, goals, and future programming decisions (United States Department of Transportation and Federal Highway Adminstration, n.d.)
In the federal long-range transportation process, states and MPOs must develop reports that document progress toward target achievement, including the effectiveness of federal-aid highway investments. All states must submit reports on progress toward target achievement for each performance measure (United States Department of Transportation and Federal Highway Adminstration, n.d.)
Performance Measures Supporting Agency Objectives
FHWA has established measures to assess performance/condition in carrying out performance-based federal-aid highway programs. There are three different performance measure categories: Safety (PM 1), Pavement and Bridge Condition Measures (PM 2), and Performance of National Highway System, Freight, and CMAQ Measures (PM 3). For each category, specific performance measures have been established that agencies must include in their TPM process, shown in Table 2.
Table 2 FHWA Performance Measures
| Category | Performance Measures |
|---|---|
| Safety | Number of fatalities |
| Rate of fatalities | |
| Number of serious injuries | |
| Rate of serious injuries | |
| Number of non-motorized fatalities and non-motorized serious injuries | |
| Infrastructure | Percentage of pavements of the Interstate system in good condition |
| Percentage of pavements of the Interstate system in Poor condition | |
| Percentage of pavements of the non-Interstate National Highway System | |
| (NHS) in good condition |
| Category | Performance Measures |
|---|---|
| Percentage of pavements of the non-Interstate NHS in Poor condition | |
| Percentage of NHS bridges classified as in Good condition | |
| Percentage of NHS bridges classified as in Poor condition | |
| Performance of NHS, Freight, and CMAQ Measures | Percent of the person-miles traveled on the Interstate that are reliable |
| Percent of the person-miles traveled on the non-Interstate NHS that are reliable | |
| Truck Travel Time Reliability Index | |
| Annual Hours of Peak Hour Excessive Delay Per Capita | |
| Percent of Non-SOV travel | |
| Total Emissions Reduction |
Source: (United States Department of Transportation and Federal Highway Administration, n.d.)
Factors for Success and Lessons Learned
Building on years of TPM, the FHWA TPM Toolbox offers practitioners best practices on how to implement and self-assess transportation performance management. TPM provides critical information to support decision making across systems and improves communication between decision makers, stakeholders, and system users, while guaranteeing targets and measures are co-created with partners and based on quality data and information (United States Department of Transportation and Federal Highway Adminstration, n.d.). The TPM Toolbox outlines examples of performance measures FHWA uses (Table 2) for various areas of system management, which can inform practitioners on how to integrate resilience outcomes and objectives into an assessable metric that better informs investments and success.
From the outset of the TPM process established by USDOT rulemakings consistent with the provisions of MAP-21 and the FAST Act, state DOTs, MPOs, and transit providers first had to establish new governance frameworks establishing roles and responsibilities for different subdivisions of their agency. In some cases, agencies created new organization structures to facilitate the TPM process and established new agency policy and guidance to help institutionalize implementation. This helped the organization to implement a new process and establish accountability for meeting schedule milestones and requirements.
Based on the past decade of TPM implementation, there are several factors that help make programs successful, including a clear data governance plan and buy-in from agency leadership. To meet the TPM requirements, development of a governance plan is essential to success, particularly in agencies where multiple agency divisions or offices will be involved. These governance plans typically enumerate who has ownership of the data, who is responsible for the analysis, who/what processes makes recommendations and adopt targets, and how findings are integrated into parallel agency planning and programming efforts. As discussed later in this document in the Implementation section, governance plans identify someone within an organization (a leader or someone with influence and authority) to oversee the TPM process across business lines and divisions. As described later, this is often where the TPM process faces implementation challenges. TPM requires a commitment to rigorous data collection, analysis, and presentation, which if it occurs in isolation from other agency activities, limits its ability to provide meaningful value into decision making.
Agencies are also elevating performance management within agency mission statements, strategic plans, and long-range plans by describing exactly where they connect to planning and programming processes. In some cases, these connections are practical and required, such as through the inclusion of a System Performance Report as part of a state LRTP or MPO metropolitan transportation plan, and references to
performance trends and targets within STIPs and MPO TIPs. In other cases, agencies are identifying performance management as part of an overall transportation management cycle of planning, programming, and performance management, as depicted in recent statewide long-range plans and associated performance management efforts.
It can be a challenge to link performance management to planning and programming because of the need to address the gap between data-supported decisions and data-driven decisions. Specific performance measures may be difficult to track and show progress against because a baseline cannot be developed using existing data. In these cases, data centralization and management alongside organizational culture/leadership to drive progress are challenges to establishing successful performance measures and targets. One way of combatting this is by creating iterative processes that can be flexible based off availability and development of data, staff, and agency priorities.
NCHRP Report 666: Target-Setting Methods and Data Management to Support Performance-Based Resource Allocation by Transportation Agencies, Volume I: Research Report, and Volume II: Guide for Target Setting and Data Management discusses the several success factors needed for effective data management and execution of planning efforts (Cambridge Systematics Inc. et al. 2010). The key factors vary, but all center on establishing a need and demonstrating a return on investment to the organization to gain buy-in from decision makers. Thus, a linkage between data and goals and targets needs to be formalized via a business plan or a system that connects an agency’s mission with staff effort. This function of “making the case” is accomplished through processes such as an existing conditions assessment of data systems, including data availability and needs.
Investing in staff trainings and leveraging access to other planning offices (regional or district) and technical resources available to the agency can also lead to successful TPM programs. Additionally, placing performance measures in a hierarchical order allows an agency to translate strategic goals/objectives into operational goals/objectives for each department. The US DOT models this approach among its different administrations (e.g., FHWA and FTA), providing a performance budget that can be related to actual and planned accomplishments for each department. This same setup would apply to a State DOT with multiple divisions, districts, or independent offices. The performance in each area becomes an indicator for resource allocation and budgeting. Finally, rewarding divisions which meet targets and goals incentivize and motivate staff. These all strongly enhance a performance-based management process.
Summary: Federal resources such as the TPM Toolbox offer guidance for state and local practitioners to understand best practices and offers a deep dive into their historical development and agency outcomes. TPM begins with establishing a long-term strategic direction, re-examining targets and goals, and building a performance-based planning frameworks to better inform strategies in LRTPs and develop more rigorous investment prioritization schemes.
Gaps: In absence of strong governance and leadership, TPM can be difficult to successfully implement given the variety of data owners, decision makers, and stakeholders that need to be involved. Additionally, the TPMs related to safety, infrastructure and Performance of National Highway System, Freight, and CMAQ Measures do not include incorporating risk from probable events into the forecasting of these measures. For example, travel time reliability is at risk on the I-70 corridor in Colorado due to weeks long closures from rockfall/rockslide events outside of Glenwood Canyon. This underlying risk to system resilience and travel time reliability is not accounted for in performance measures.
Relevance for Practice: Agencies may not be fully accounting for the underlying risks to their ability to meet their established performance measures – meaning they are not accounting for the probability of extreme weather events to impede their ability to reach their performance goals.
Measuring Resilience
Resilience in the transportation system of the United States is essential to recover from natural disasters and adverse events (Special Report 340, 2021). An important step in implementing resilience into transportation planning is measuring the resilience of the transportation system to track progress and evaluate appropriate transportation investments. The report Disaster Resilience: A National Imperative (National Research Council 2012) outlines several important aspects of an effective resilience measurement system:
- Indicators of the ability of critical infrastructure to recover rapidly from impacts;
- Social factors that enhance or limit a community’s ability to recover, including social capital, language, health, and socioeconomic status;
- Indicators of the ability of buildings and other structures to withstand natural disasters; and
- Factors that capture the special needs of individuals and groups, related to minority status, mobility, or health status.
The following tables (Table 3, 4, 5, and 6) summarizes the index, models, metrics, and tools that have been used around the United States to measure/evaluate resiliency. Though these resources have advanced the transportation field’s ability to measure resilience, none are a panacea that are seen as a consensus approach in the field. Many of these resources lack a robust approach to incorporating future event projections or providing specific impacts that hazards have on transportation assets and systems.
| Model Name | Brief Summary |
|---|---|
| San Francisco Planning and Urban Research Association (SPUR) Model | This model was developed for measuring resilience concerning earthquakes. It looks at predicted recovery time frames based on the current status of the asset compared to the desired target state of recovery. A comprehensive table is created rather than a single metric. |
| Norris et al. (2008) community resilience model | This model of community resilience looks at the economic and social capacities of communities utilizing publicly assessable population indicators. |
| RAMCAP model | This model quantitatively assesses infrastructure risks by requiring a “threat scenario” to be developed for the model to analyze. The model evaluates risk based on the “worst reasonable consequence” resulting from damage to the transportation infrastructure and is calculated by multiplying threat probability, vulnerability, and consequences. The threat probability is if the asset will be affected by the scenario, the vulnerability is the probability the asset will be damaged or destroyed, and the consequences are the cost to the community from the scenario. |
| Resilience and Disaster Recovery Metamodel | This model allows agencies to compare the costs of different hazard scenarios to the costs of potential hazard mitigation. This model uses hazard probabilities, the vulnerability of infrastructure assets, and the consequences of damages to infrastructure. This resiliency model can be used with travel demand models. |
Sources: (National Research Council, 2012), Special Report 340, 2021)
| Index Name | Brief Summary |
|---|---|
| Coastal Resilience Index |
This metric combines the following:
|
| Argonne National Laboratory Resilience Index | The metric is determined for critical infrastructure facilities and is created from interviews at critical infrastructure facilities that cover around 1,500 variables. This data is then combined into a single resilience index for each of the critical infrastructure assets. This metric was created as part of a national program. |
| Social Vulnerability Index (SoVI) | This metric is statistically driven, utilizes census data, and helps to illustrate the capacity for preparedness, response, and recovery in different communities. |
| Resilience Capacity Index (RCI) | This metric provides a single regional statistic that combines 12 economic, socio-demographic, and community connectivity indicators that influence the ability of a region to come back from a hazard event. |
| Community Disaster Resilience Index (CDRI) | This metric is determined using the four phases of disaster management (preparedness, response, recovery, and mitigation) and combines them with community capital assets (social, economic, physical, human, and natural capital). Scores were then averaged for each of the capital assets to compute the CDRI. |
| Center for Risk and Economic Analysis of Terrorism Events Economic Resilience Index (CREATE-ERI) | The goal of this index is to evaluate the risks, costs, and consequences of terrorism and to guide investments. This metric is evaluated by the avoided losses divided by maximum potential losses in terms of direct and indirect business interruption losses. |
| Index Name | Brief Summary |
|---|---|
| Vulnerability Index | Used to express the susceptibility of the critical components of a transportation network and commonly represents the operational performance of the network. |
| Accessibility Index | This metric helps to determine the relative importance of highway links after a disaster event. |
Sources: (Ahmed & Dey, 2020), (National Research Council, 2012)
Table 5 Resiliency Metrics/Measures
| Metrics/Measures | Brief Summary |
|---|---|
| Baseline Resilience Indicator for Communities | This metric is calculated by the arithmetic mean of five sub-indexes related to social, economic, institutional, infrastructural, and community resilience. |
| Vulnerability/Sensitivity | The likelihood of damage or disruption to an asset due to a hazard event. The vulnerability of an asset can be reduced by increasing the robustness of the asset or by relocating it. |
| Consequences | Measures of the direct and indirect impacts of the damage or disruption to the transportation system. This metric could measure the cost to repair the asset or the death or injury of travelers on the transportation asset. |
| Risk | This metric often considers the likelihood of a hazardous event, the vulnerability of the asset, and the social and economic consequences of the damage. |
| Criticality | This metric measures the importance of the transportation asset and often involves community input as it measures a broader economic and social impact than consequences do. This metric is often used with vulnerability to assess and prioritize resilience investments. |
| Availability | The measure indicates the capacity or functionality of a transportation system. An example of a measure of availability would be transportation system capacity. |
| Productivity | This metric is the quantity of service provided by the system. Productivity is often measured with regard to rate or flow and is typically a function of supply, capacity, and demand. |
| Quality | The quality of a system is the character or service provided by the system. Examples of the quality of a transportation system would be the average vehicle speed or the transportation travel time. |
| Travel Time | The time spent traveling from trip origin to destination. This time may fluctuate due to features of the transportation system and meteorological conditions during a disaster scenario. |
| Reliability |
The probability of the asset being functional/operational post-disaster. Reliability related to the transportation system can be split into three different groups (Ahmed, 2020):
|
| Restoration Time | Amount of time to restore the transportation system post-disaster. The goal of many agencies is to restore the system in order to operate relief distribution and post-disaster evacuation. Models have been created to optimize the restoration process. |
| Travel Demand | This metric looks at the travel demand before the disaster and after the disaster. |
| Cost or Budget | The cost is related to the system disruption due to the disaster. These costs could include travel time cost, fuel cost, and restoration costs. |
| Capacity | This metric is determined by how long a system can survive on its own after the occurrence of any disruptive event. |
| Shortest Path | This metric determines the most efficient route. This can be used to quantify the alternative routes in case of post-disaster routing. |
| Resilience Triangle | This metric is a combination of three different parameters to measure resilience. The parameters are the performance loss of the system, time to reach the lowest level of performance, and recovery time. |
| Absorptive Capacity | The ability of the transportation system to absorb shocks and stresses and maintain normal functioning. Some example inputs are the mileage of new facilities in flood zones and the number of highway lanes and centerline miles within a 100-year floodplain. |
| Restorative Capacity | The ability of the system to recover quickly after a shock or stress to normal functioning. Example input metrics are counts of construction equipment or workers in the region or the budget for snow removal, fire suppression, cyber system protection, or other hazards. |
| Equitable Access | The ability of the system to provide the opportunity for access across the entire community during a shock or stress and when the system is undisrupted. Sample input metrics for determining the adaptive capacity of a transportation system include the distance to alternative routes or the number of reliable routes. |
| Adaptive Capacity | The ability of the system to change in response to shocks and stresses to maintain normal functioning. Sample input metrics for determining the adaptive capacity of a transportation system include the distance to alternative routes or the number of reliable routes. |
Sources: (Ahmed & Dey, 2020), (Special Report 340, 2021), (National Research Council, 2012), (Poulin & Kane, 2021) and (Weilant, S., Strong, A., & Miller, B. M., 2019)
| Tool Name | Brief Summary |
|---|---|
| FWHA’s Vulnerability Assessment Scoring Tool (VAST) | This tool helps determine the likely physical damage or disruption is an infrastructure asset from an event. This tool has indicators for exposure, sensitivity, and adaptive capacity (or redundancy). |
| Hazus-MH | A tool created by the Federal Emergency Management Agency that estimates the impacts of natural hazards. The tool produces quantitative estimates of the impacts of hazard events. The tool is able to analyze the cost-effectiveness of common mitigation strategies but has limitations when it comes to smaller mitigation actions. |
| Community Assessment of Resilience Tool (CART) | This tool is a community intervention that includes a survey, a focus group script, and a process for assessing and building community resilience to disasters. The results help to develop a profile for the community to measure and enhance community resilience. |
| Community Resilience System (CRS) |
The goal of this system is to achieve more resilient communities. This system has six steps (National Research Council 2012):
|
| Toolkit for Health and Resilience in Vulnerable Environments (T*H*R*I*V*E) | This resource provides communities with a means to improve health outcomes and reduce disparities experienced by racial and ethnic minorities. |
Sources: (Special Report 340, 2021) and (National Research Council, 2012)
In addition to the metrics, indices, and models, design guides can help make resilience part of the planning process for transportation agencies. These guides may reduce the need to conduct resilience analysis on a project-by-project basis. The Port Authority of New York and New Jersey, and New York City have design guides that look at hazard probability, asset useful life, and criticality of a transportation system (Special Report 340, 2021).
Examples of RPMs
RPMs are performance measures used to measure the resilience of a system. In the context of this project, that means the ability of the highway system to anticipate, prepare for, and adapt to changing conditions and withstand, respond to, and recover rapidly from disruptions. In Integrating Resilience into the Transportation Planning Process: White Paper on Literature Review Findings (2018), a literature review was completed on planning documents from 52 DOTs and 101 MPOs to evaluate the current state of the practice for integrating resilience into the planning process. Out of the reviewed DOTs and MPOs, five DOTs and 19 MPOs had performance measures, targets, or evaluation criteria (Dix, B., Zgoda, B., Vargo, A., Heitsch, S., & Gestwick, T., 2018). The resiliency performance measures from the state and MPO plans are listed below, split into six different categories.
Flood Related
- Mileage of new facilities in flood zones
- Protect low-lying major roads from storm surge and flooding
- Development in high flood risk areas: Employment and housing in Federal Emergency Management Agency (FEMA) 100-Year floodplains
- Number of highway lane and centerline miles within the 100-year floodplain
Forest Fire Related
- Development in forest fire risk areas: Employment and housing in wildland-urban intermix areas
Sea Level Rise/Natural Hazard Variability Related
- Number of projects that raise the roadway grade or increase resilience against natural hazard variability or natural disasters through other means (tracked annually)
- Increase the percentage of facilities that accommodate two feet sea level rise; the performance target is 90% for the strategic intermodal system network in 2025
- Evaluate potential impacts of sea level rise for all TIP projects during the 25% design review and adjustments to projects are made as warranted
- Number of coastal communities with adaptation plans
Stormwater Related
- Maintain stormwater drainage programs
- Number of stormwater improvement projects implemented by local communities and MassDOT
- Provide improved stormwater management and treatment to 50% of TIP projects outside of sensitive areas and 100% of TIP projects within sensitive areas
Infrastructure Related
- Reduce the percentage of roadways in “poor” or “fair” condition
- Reduce the percentage of roadways in “critical backlog”
- Annual percentage of routine culvert inspections completed on time
Other
- Percent of compliance on erosion and sediment control ratings
- Acres of wetlands or wildlife habitat created, restored, or improved since 2000
- Ensure 95% of all roadways have a volume-capacity ratio less than one by 2020
- Reduce commute times by 2.5% by 2025
In A Guidebook for Sustainability Performance Measurement for Transportation Agencies (2011), one of the main goals outlined was security – ensuring that the transportation system is secure from, ready for, and resilient to threats from all hazards (Zietsman et al. 2011). Some of the performance measures outlined for this security goal can be translated into measuring resilience, outlined below:
- Level or redundancy for critical passenger and freight infrastructure
- The capacity of parallel/redundant routes across all modes and major freight corridors
- The number/value of projects as part of a program to protect transportation users, agency personnel, and critical infrastructure
- The number/value of projects designed to improve the capacity of the transportation system to recover swiftly from incidents
- The number/value of projects as part of a program designed to enhance the security of freight transportation assets
- Relative change in capital funding allocated to disaster/incident response and management
- Incident clearance time for selected incidents
Monetizing Annual Risk to Highway Assets
In a special report from the Transportation Research Board, Investing in Transportation Resilience: A Framework for Informed Choices (2021), two examples from DOTs were presented to summarize how the RAMCAP model was used to determine risks and the resulting cost to transportation assets from natural disasters.
The Colorado DOT utilizes the RAMCAP model to identify the monetary risk for rockfalls, floods, and debris flows after a fire. In order to calculate the threat probability, they use historical data to determine the estimated frequency and magnitude of the hazard events. In determining vulnerability, the Colorado DOT used the physical characteristics of the asset and research, data, and expert advice to determine the probability of the “worse reasonable case” occurring (Special Report 340, 2021). The consequences to the owners of the asset were the costs of transportation asset replacement and cleanup after the event while the consequences for the users were related to how many closure days. The cost per mile and hour was then calculated using a traffic model to determine the detours drivers need to take. In order to measure resilience, the annual calculated risk is then compared against the criticality scores using a matrix. The Colorado DOT measures criticality by combining six different variables: average annual daily traffic, functional classification, system redundancy, freight value, tourism dollars, and the SoVI. All of these metrics are ranked from one to five and summed with equal weighting (Special Report 340, 2021).
The Utah DOT also uses the RAMCAP model but follows a separate process from Colorado DOT. Utah uses the probability of a hazard great enough to cause total failure of the asset, so “vulnerability” is not included to calculate the risk (Special Report 340, 2021). They utilize the change in sensitivity, which they define as “a measure of how much damage will occur” to determine the benefits of investments (Special
Report 340, 2021). Utah uses highway-related factors like redundancy, average annual daily traffic, and truck traffic to evaluate criticality. The measure of resilience is determined by one divided by the product of risk and criticality. To evaluate the consequences, the Utah DOT uses owner costs (like repair costs) and user costs (Special Report 340, 2021).
Developing RPMs
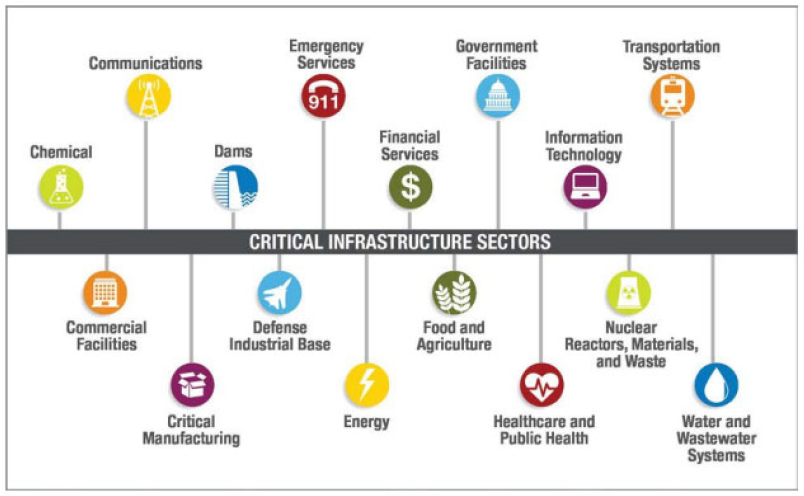
Critical infrastructure can be defined as sectors “whose assets, systems, and networks, whether physical or virtual, are considered so vital to the United States that their incapacitation or destruction would have a debilitating effect on security, national economic security, national public health or safety, or any combination thereof” (Cybersecurity & Insfrastructure Security Agency (CISA), 2023). Presidential Policy Directive 21 (PPD-21) identifies 16 critical infrastructure sectors as presented in Figure 4 (Department of Homeland Security (DHS), 2016). Resilience has been a consideration factor at various levels of critical infrastructure sectors, and to protect the future of transportation assets, it is key to identify lessons learned from the work done in other critical infrastructure sectors. The approaches vary in maturity by sector, from the early stages of identifying factors considered as resilience in some sectors, to the development and establishment of risk and resilience standards by the water/wastewater sector. Resilience metrics are essential to support the decision-making process.
Critical Infrastructure Sectors
Water/Wastewater
The water/wastewater industry has developed risk and resilience methodologies that have been widely adopted and applied in their industry. The American Water Works Association (AWWA) developed its Risk and Resilience Management of Water and Wastewater System Standard (ANSI/AWWA J100-21) (American Water Works Association (AWWA), 2021) based on the Risk Analysis and Management for Critical Asset Protection (RAMCAP Plus) framework (American Society of Mechanical Engineers (ASME) Innovative Technology Institute, LLC, 2010). As part of the J100 standard, the water sector measures risk as a monetary value based on the probability of the hazard/threat event, the vulnerability of the asset and the potential consequences to experience negative impacts. The annual monetary risk to an asset from a threat/hazard is calculated using the equation below:
Risk ($) = Threat/hazards probability (%) x Vulnerability (%) x Consequences ($)
In addition, J-100 also provides a process to estimate the resilience of utilities based on the Utility Resilience Index (URI). The URI is a relative measure that represents the ability of the water/wastewater utility and the community it serves to absorb and recover from the impact of a natural disaster. The URI is based on a score between 0 to 100% and is based on a series of operational and financial indicators as shown in Figure 5 below. The operational indicators reflect the utility’s tactical capacity to react quickly and/or cope with various incidents that have the potential to disrupt service, while the financial indicators reflect the utility’s fiscal capacity to react quickly and/or cope with various incidents that have the potential to disrupt revenue and costs. The sub-indicators have different weights with corresponding scores that are added up to generate the final URI for the utility. This format allows for the quick identification of enhancements to the system’s resilience by determining the next level of operational and financial resilience achievable based on the sub-indicators.

Energy
In 2015, RAND Corporation conducted a literature review to identify the different approaches to measure resilience of energy distribution systems (Willis & Loa, 2015). The report divided the metrics in five different categories: inputs, capacities, capabilities, performance, and outcomes. Table 7 presents an example of the resilience metrics used in the energy sector.
Table 7 Example of Energy Resilience Metrics for Electricity Systems at the Facility/System Level

Source: (Willis & Loa, 2015)
The report resulted in three recommendations to improve the development and collection of resilience metrics to support energy policy, which include:
- Improve Collection and Management of Data on Inputs and Capacities at the Facility and System Levels;
- Develop Better Measures of Capabilities at the System and Regional Levels; and
- Improve Understanding of How Capabilities and Performance Translate to Outcomes at the Regional and National Levels.
Similarly, the Department of Energy (DOE) highlights that resilience can be quantified through temporally explicit performance-based indicators (e.g., comparing baseline and investment scenarios). Table 8 presents some examples from the DOE of resilience metrics used in the energy sector based on the expected direct and indirect consequences from losing service (Sandia National Laboratories, 2017).
Table 8 Examples of Grid Resilience Metrics for Consequence Categories

Source: (Sandia National Laboratories, 2017)
In addition to the metrics presented above, other metrics have been used in the energy sector including engineering-designed, operational, and community resilience metrics as presented in Table 9 (Shandiz, Foliente, Rismanchi, Wachtel, & Jeffers, 2020).
Table 9 Examples of Resilience Metrics by Type of Resilience
| Resilience Type | Metrics |
|---|---|
| Engineering-designed | The rate of disturbance (number of lines tripped per hour and number of lines tripped) The duration of the performance disruption (hours) The rate of system recovery (number of lines restored) |
| Operational | The rate of disturbance (kW power loss per hour and power capacity loss) The duration of the performance disruption (hours) The rate of system recovery (kW power restored) |
| Community | Amount of time-critical community functions (e.g. energy services) were adequately provided to people, divided by total amount of disruption time |
Source: (Shandiz, Foliente, Rismanchi, Wachtel, & Jeffers, 2020)
Cybersecurity and Information Technology (IT)
Risks that impact the cybersecurity and IT sectors continue to grow. Many companies are investing in new technology and procedures to reduce risk and improve the resilience of their systems. In the IT sector, resilience targets are typically measured by two metrics: Recovery Time Objective (RTO), “the time it takes to recover from a failure”, and Recovery Point Objective (RPO), “the maximum window of time in which data might be lost after an incident” (Amazon Web Services (AWS), 2021).
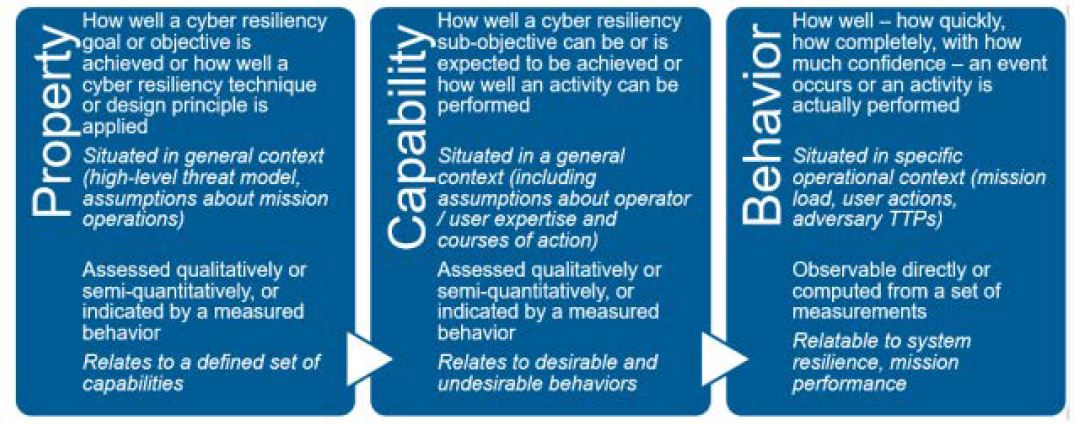
Cyber resilience is an area that has gained heightened attention due to the increase of events experienced in recent years. A report published in 2018 by MITRE (Bodeau, Graubart, McQuaid, & Woodill, 2018), presents an overview of cyber resilience metrics, measures of effectiveness and associated scoring. The report describes the three aspects of resilience to be assessed, including property, capability and behavior as presented in Figure 6.
In addition to the assessable or measurable aspects of cyber resilience, the report highlights the way security metrics, resilience metrics, and risk metrics can be repurposed into cyber resiliency metrics as shown below in Figure 7.

International Experience
Internationally, there has been significant work done in the area of resilience, transportation, and performance measurement. This section reviews several examples, including global initiatives from the United Nations, two European Union projects, an example from Norway, and a performance measurement approach from the United Kingdom.
The United Nations, to track global development on the Sustainable Development Goals (SDGs), has developed trackers to measure progress on 232 unique indicators (Roser & Mispy, 2018) to be achieved by the year 2030. The United Nations Economic Commission for Europe has developed a framework for measuring and monitoring progress towards SDGs, which documents the challenges in coordination and collaboration for data collection, dissemination and communication of status of progress and development of standard data exchange formats.
The Inter-American Development Bank led the development of a resilience metrics framework for the multilateral development banks (MDBs) and members of the International Development Finance Club to align financing flows with the resilience goals of the Paris Agreement (Inter-American Development Bank, 2019). The framework discusses the use of various types of metrics by the MDBs and financial institutions – including input, output, outcome, and hybrid metrics at the project/asset and system levels. One example transportation project-level outcome metric used by the European Bank for Reconstruction and Development (EBRD)“estimated 2.3 days per year of avoided weather-related disruption to the relevant section of the road network and increased road lifespan of 5 years compared to the pre-project baseline” expressed as a physical outcome, which can also be monetized/valorized savings (€1.7 million annually).
The FORESEE project, of the European Union, sought to develop, demonstrate, and verify a set of dependable and implementable tools to provide immediate and long-term resilience measures against extreme weather events. To do that, the report examined the integration of concepts of resilience and level of service in infrastructure governance. This report concluded that resilience and service level should be included in governance throughout the lifecycle of an asset, bolstering the current framework in which public infrastructure is governed. Resilience is not seen as a single outcome or a post-disaster recovery measure, but rather as a dynamic process that uses a risk and lifecycle-based method for addressing the vulnerabilities of critical infrastructure systems, making systems better able to adapt to unexpected challenges (Adey, Martani, & Kielhauser, 2019). Likewise, the FORESEE project provided guidelines on measuring levels of service and resilience infrastructure and setting target levels. These were developed into the CEN publication CWA 17819:2021: “Guidelines for the assessment of resilience of transport infrastructure to potentially disruptive events,” which forms the initial foundation for a European Standard on resilience assessment for transport infrastructure (de Jonge, van Marle, Connolly, de Paor, & Bles, 2022).
Measuring resilience requires measuring the difference between the service over time, when no events occur compared to when a hazard event occurs. It is more difficult than measuring service because it requires an estimation of what will happen between those two events. This depends on factors like preparedness, reactions, and responsiveness. Due to this obscurity, FORESEE believes it is more valuable to use resilience indictors, i.e. indicators of how service will be impacted, in order to capture performance. Measuring resilience often requires the proper selection of relevant indicators and the development of categories of indicators at successive levels (modeling the phases of the resilience curve). Figure 8 provides snapshots of generic resilience indicators related to infrastructure (Adey, Martani, & Kielhauser, 2019). Figure 9 and Figure 10 show generic indicators of what will happen during and after a hazard event.
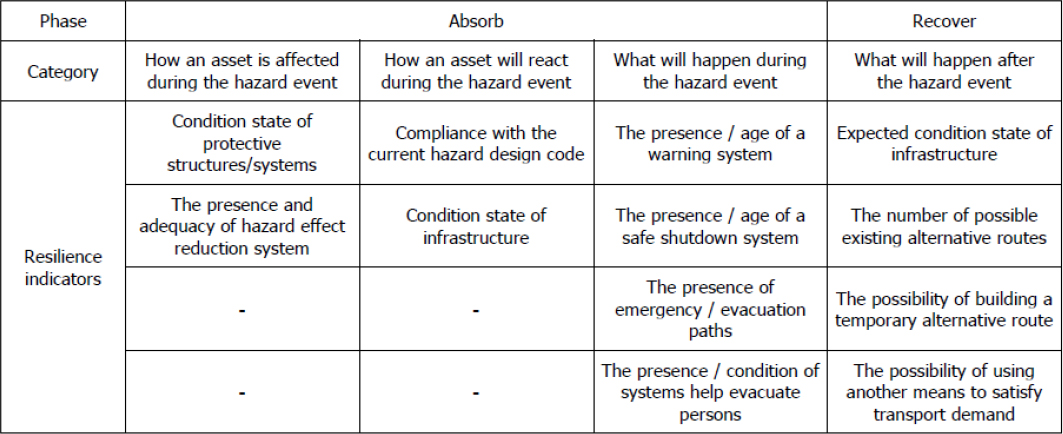

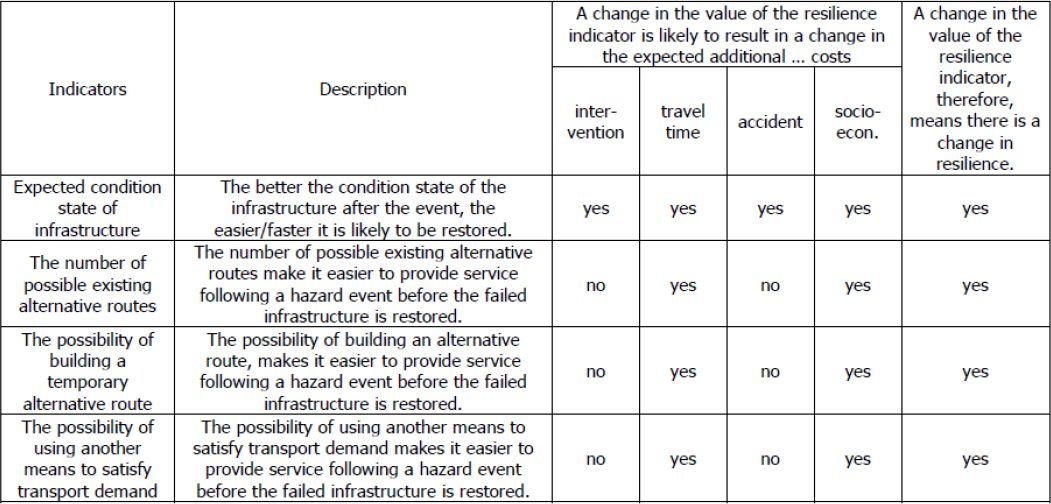
Source: (Adey, Martani, & Kielhauser, 2019).
The ICARUS project, another European Union initiative, sets out to improve the uptake of resilience adaptation in roadway decision making. ICARUS examines service level metrics versus resilience indicators. Service level metrics are understood as availability, environmental effects, political impacts, and design criteria. On an asset level, service level metrics are documented and implemented through design, however, the connection to natural hazard variability is lacking. Much of current resilience adaptation considers the application of minimum service levels. This is seen through the application of cost-benefit analysis, response curves etc. for the setting of service level metrics. These are often delineated as resilience metrics. CEN CWA 17819 is a notable example of applying service levels to resilience adaptation, which may be the industry standard in the coming years. (de Jonge, van Marle, Connolly, de Paor, & Bles, 2022).
Despite service level targets being uncertain, Transport Infrastructure Ireland annually reports a summary of key performance indicators (PINs) of the national road network in Ireland in their “National Roads Network Indicators” reports. Metrics used to determine service include traffic flow rates and level of service, AADT, journey time reliability, and incident data including duration and average response time. Metrics on pavement condition, bridge condition, and safety data, including numbers of fatalities and injuries, are all recorded. In the Netherlands, there is a service level agreement that includes PINs. PINs are expressed at the network level in terms of availability of the road and safety for the road user. Performance of the road network is monitored per region and summarized for the network. Through avenues like criticality assessments, the Dutch categorize the road network into four categories (A-D) based on traffic intensity, redundancy and economic significance, to allow for tailored measures based on need (de Jonge, van Marle, Connolly, de Paor, & Bles, 2022).
Overall, ICARUS concluded that while service level metrics exist, they are utilized more for examining the past or present performance of infrastructure and are not used to evaluate and project the resilience of infrastructure against future climatic disruption. Due to ease in data acquisition, wider knowledge or awareness of service levels at the asset level was seen. However, there needs to be a deeper understanding
of how existing indicators can be used to address natural hazard variability (de Jonge, van Marle, Connolly, de Paor, & Bles, 2022).
Another international example is the Norwegian Public Roads Administration (NPRA), the public construction authority responsible for the planning, construction and management of highways and county roads. The main challenges for the Norwegian road network come from the expected increase in precipitation and subsequent consequences. There are four important pillars of all aspects of the NPRA’s work, including the National Transport Plan (NTP), the Norwegian Road Database (NRDB), the NPRA’s own design and practice manuals, and networks of information sharing among national and international peers. Based off decades of work, the group has developed a ‘framework’ for adaptation (Petkovic, G., Kristensen, L., Dolva, B, 2019).
The Norwegian framework guides road authorities through the process of increasing the of their networks and assets through four stages:
- Identifying scope, variables, risks and data (Stage 1);
- Assessing and prioritizing risks (Stage 2);
- Developing and selecting adaptation responses and strategies (Stage 3);
- Integrating findings into decision-making processes (Stage 4).
For NPRA, Stage 1 includes vulnerability analysis on a general level and on the road network level. This happens annually via vulnerability mapping using the VegRos method for risk assessment, a methodology used for the regular and obligatory risk assessment that is performed annually on all national roads. Stage 2 involves scoring elements of risk and prioritizing measures, also via the VegRos methodology. Stage 3 entails amendments to design guidelines and vulnerability mapping in planning and operation contracts. Notably, NPRA decided that resilience should be included in the NTP and not solely in a dedicated adaptation strategy. On the asset/road level, improvements are necessary to include economic analyses in decisions concerning the choice of adaptation measures. The final, Stage 4, formalizes the assessments by making a business case for adaptation (Petkovic, G., Kristensen, L., Dolva, B, 2019).
Finally, in the United Kingdom, Roads: An industry guide to enhancing resilience discusses how the Department of Transport’s metrics or performance measures can create strategic goals, instill accountability, and incentivize action (Reeves, Winter, Leal, & Hewitt, 2019). Two examples include:
- The percentage of motorway incidents cleared within one hour (the target is 85% between 06:00 and 22:00).
- Average delay per vehicle and number of flooding hotspots and priority culverts mitigated (priority culverts are those that are undersized).
The performance measurements were developed through a collaborative exercise involving specialists in different areas. The Department of Transport reviews Highways England’s performance annually. The results of the assessment are published, so in addition to the pressure exerted by government for not meeting performance targets, it also influences organizational reputation (Reeves, Winter, Leal, & Hewitt, 2019). Rapid recovery of routine events such as noninjury traffic accidents may be spurred by target times for clearance. Reputation and the impact on delay metrics also encourage improvements to speed recovery.
The report also provides examples of preparedness strategies such as establishing pre-determined diversion routes for the strategic road network (which are agreed upon with the local authorities that own the diversion routes); setting up mutually beneficial agreements like sharing salt supplies with other road
authorities; and preparing Disruption Risk Management Plans for various hazards or asset types. Within planning, establishing policies and targets are an essential step in laying the foundation for developing expectations of resilience, which in turn supports performance management. Transport Scotland stated that “by 2050, there will be less or no more disruption on the transport networks caused by flooding compared to 2010” (Reeves, Winter, Leal, & Hewitt, 2019). Goals like Transport Scotland’s help embed resilience at a high level and demonstrate the importance of resiliency across an agency.
Funding & Grants Programs
With the passage of the Bipartisan Infrastructure Law in November 2021, resilience became a more prominent component of funding and grant programs. However, no major grant program defines performance measures related to measuring progress toward resilience goals. For instance, the National Infrastructure Investments program (now called BUILD) Grant Program; formerly called RAISE and TIGER) includes a national policy requirement related to critical infrastructure security and resilience (U.S. Department of Transportation, 2023). Under this guidance, projects are also evaluated as to whether they will improve the resilience of at-risk infrastructure to withstand extreme weather events. However, as yet, the RAISE program’s performance measure guidance does not yet include any suggested or example performance measures related to resilience (U.S. Department of Transportation, 2022).
Additionally, the FHWA has recently issued guidance on the PROTECT formula program (Federal Highway Administration, 2022). Under this guidance, the optional Resilience Improvement Plans prepared by state DOTS or MPOs may include performance measures that inform investment decisions. This may prove a resource in the future for tracking how DOTs are measuring resilience. However, the FHWA has not yet suggested performance measures related to resilience though more information is expected sometime this year as part of the PROTECT discretionary grant program guidance. Additionally, as part of its FY 2022-2026 strategic plan, the FHWA set an objective to promote planning practices for infrastructure resilience and enhance data collection and analysis for the risks to infrastructure posed by extreme weather (Federal Highway Administration, 2023).
Benefit-cost analysis (BCA) is an element of grant funding that provides a fruitful source of potential metrics to consider when thinking of RPMs. Since BCA is required to be completed from many grant programs, there are more robust methodologies available from which to draw, including recent work on incorporating costs and benefits of adaptation measures related to preparing for extreme weather events (Dewberry Engineers Inc. et al. 2020). This includes methodologies to quantify how investments may measure damage reduction and avoided transportation service losses, environmental benefits from reduced emissions and improved air quality, and social benefits. For measuring resilience, BCAs can draw on data collected as part of state and local hazard mitigation plans, FEMA BCA guidance, data from academic sources, and other commonly used sources such as Flood Insurance Rate Maps.
Summary: Given the intersectional nature of transportation, and its recognition as critical infrastructure, this section exhibits a summary of numerous resilience tools, metrics, models and indices used globally. Specifically, it presents examples and lessons learned from the energy, water/wastewater, and IT/cybersecurity sectors that support the continued development and evolution of RPMs within the transportation sector. Energy resilience research recommends improving collection and management of data at various levels; develop measures at system and regional levels; and improve understanding of how performance translates to outcomes at macro levels. resilience and service level should be included in governance throughout the lifecycle of an asset, bolstering the current framework in which public infrastructure is governed. This section also examines State DOT use cases and the monetization of risk.
Gaps: Many efforts have been made by different sectors to develop RPMs; however, the transportation sector is still in need of identifying and implementing more adequate and standardized RPMs to help agencies track their resilience efforts and goal achievements toward resilience. In particular, there is a lack of performance measurement guidance related to funding and grant programs. While certain metrics exist, they tend to be used for examining the past or present performance of infrastructure and are not used to evaluate and project the resilience of infrastructure against future climatic disruption.
Relevance for Practice: Resilience is not seen as a single outcome or a post-disaster recovery measure, but rather as a dynamic process that uses a risk and lifecycle-based method for addressing the vulnerabilities of critical infrastructure systems, making systems better able to adapt to unexpected challenges. The development and implementation of RPMs will help transportation agencies to measure how effective their resilience initiatives and efforts are with respect of their goals, enabling agencies to make data-driven decisions, monitor and improve their system resilience and performance.
Resilience and DOT Project Development Life Cycle
RPMs and the Planning to Operations Continuum
As defined by FHWA, resilience is “the ability to anticipate, prepare for, and adapt to changing conditions and withstand, respond to, and recover rapidly from disruptions” (Federal Highway Administration, 2014). This definition provides the basis to ensure operations continuum during and after a disruptive event.
Many studies have associated resilience with four attributes or properties: robustness, redundancy, resourcefulness, and rapidity (the four Rs) as defined below (Tierney & Bruneau, 2007):
- “Robustness—the ability of systems, system elements, and other units of analysis to withstand disaster forces without significant degradation or loss of performance;
- Redundancy—the extent to which systems, system elements, or other units are substitutable, that is, capable of satisfying functional requirements, if significant degradation or loss of functionality occurs;
- Resourcefulness—the ability to diagnose and prioritize problems and to initiate solutions by identifying and mobilizing material, monetary, informational, technological, and human resources;
- Rapidity—the capacity to restore functionality in a timely way, containing losses and avoiding disruptions.”
In addition to the attributes mentioned above, it has been identified that resilience has four domains or dimensions: technical, organizational, social, and economic as presented below (Tierney & Bruneau, 2007):
- “The technical domain refers primarily to the physical properties of systems, including the ability to resist damage and loss of function and to fail gracefully and includes the physical components that add redundancy.
- Organizational resilience relates to the organizations and institutions that manage the physical components of the systems. This domain encompasses measures of organizational capacity, planning, training, leadership, experience, and information management that improve disaster-related organizational performance and problem solving.
- The social dimension encompasses population and community characteristics that render social groups either more vulnerable or more adaptable to hazards and disasters. Social vulnerability indicators include poverty, low levels of education, linguistic isolation, and a lack of access to resources for protective action, such as evacuation.
- Economic resilience has been analyzed both in terms of the inherent properties of local economies—such as the ability of firms to make adjustments and adaptations during no disaster times—and in terms of their capacity for post-disaster improvisation, innovation, and resource substitution. In general, social and economic resilience relate to the ability to identify and access a range of options for coping with a disaster— the more limited the options of individuals and social groups, the lower their resiliency.”
The research shows that a resilient system requires more than the hardening of infrastructure. It is important to plan, prepare for and adapt to changing conditions in order to ensure continuous operations and a quick recovery from a disruptive event. This includes the incorporation of resilience into a project delivery cycle, from planning, to engineering, to operations and maintenance activities.
The resilience attributes and dimensions presented in the research can inform the development of RPMs. These measures can help agencies with the decision-making process to ensure the reliability and business continuity of their systems. In addition to this, the development of RPMs can strengthen the coordination and collaboration between the stakeholders involved in the planning and recovery efforts. Figure 11 shows the benefits achieved by planning and operations personnel through the development of RPMs.
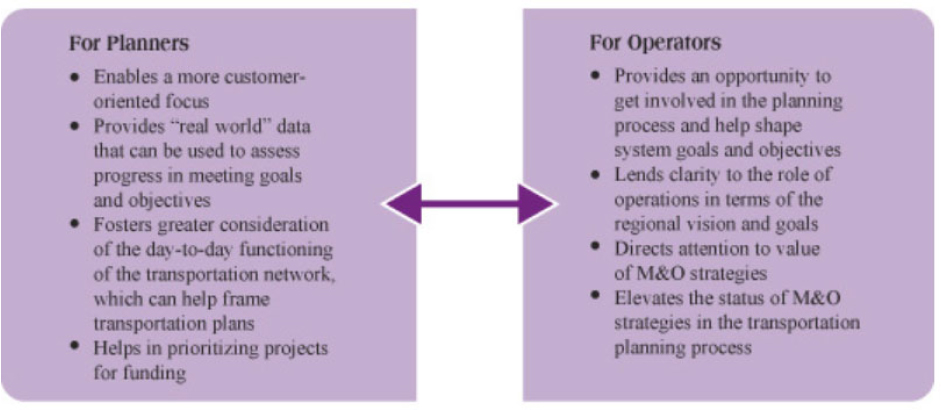
Source: (Tierney & Bruneau, 2007)
As described above, RPM have different typologies and functional areas of application. It is important to define RPMs that meet the goals of the different divisions represented, as well as identify the respective governance and requirements associated with them (owners, data needs, tracking and reporting methodologies, within others).

Source: (Cambridge Systematics, Inc. PB Consult and Texas Transportation Institute, 2006)
It is also important to identify the alignment between existing mandatory transportation performance measures in the different program areas (e.g., safety, asset condition, travel time reliability, freight movement, and traffic congestion and emissions) and the proposed RPMs outcomes presented in Figure 12 above. Table 10 presents some examples of performance measures used in asset management that could be aligned with RPMs (Cambridge Systematics, Inc. PB Consult and Texas Transportation Institute, 2006).
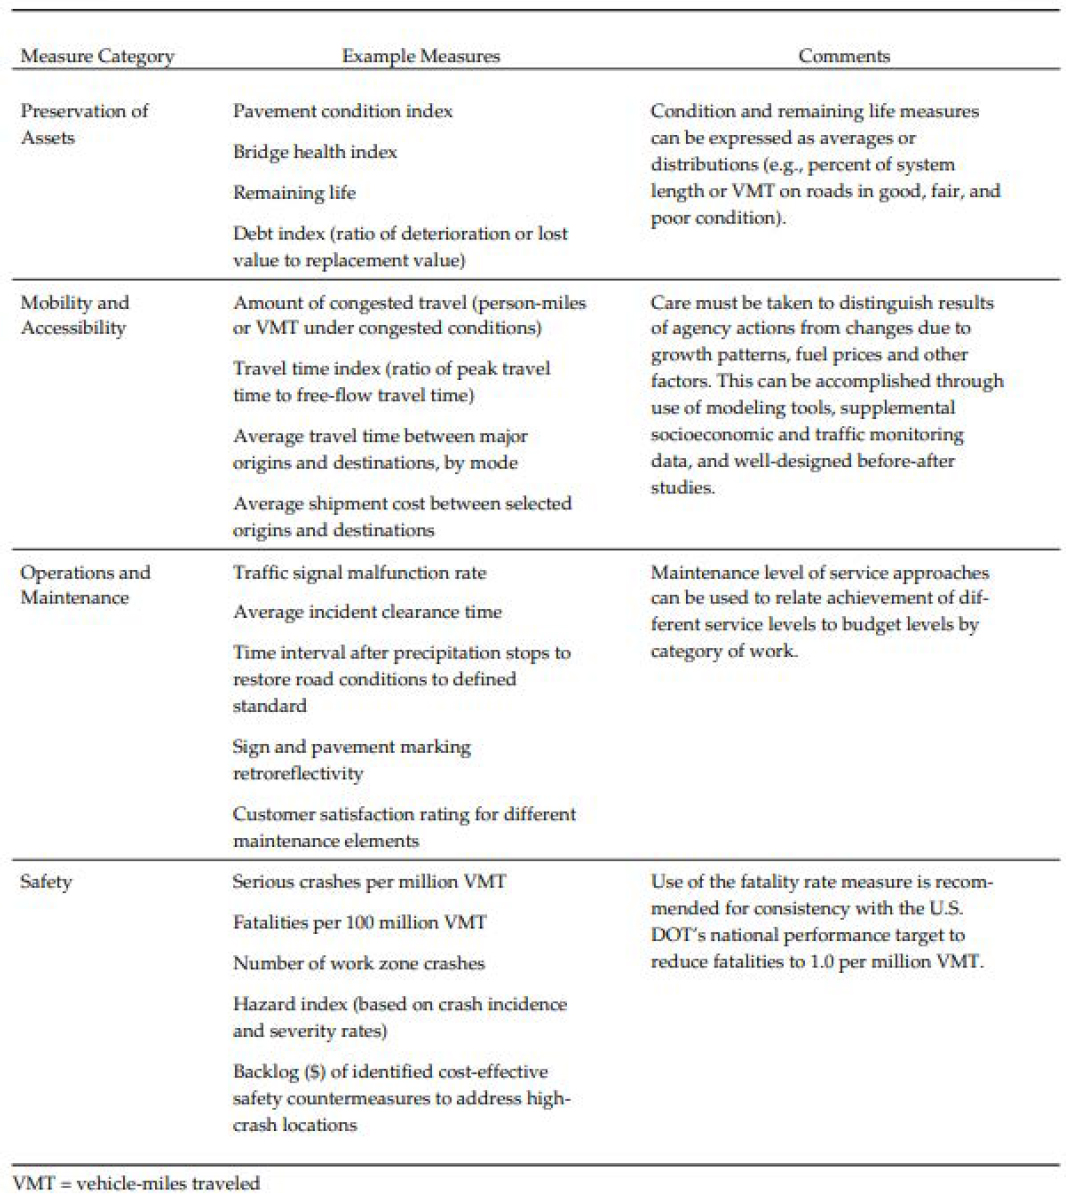
A recent study published in 2022, conducted by the Minnesota DOT (MnDOT), presented the results of a survey and case studies of state DOTS regarding the implementation of RPMs (Minnesota Department of Transportation (MnDOT), 2022). Table 11 enumerates the performance measures currently in place as well as those under development gathered from multiple state DOTS that participated in the study.
| RPM Currently in Place | |
|---|---|
| State DOT | RPM |
| Arizona DOT | Flooding: Number of U.S. Geological Survey (USGS) flood assessment assignments completed Extreme Precipitation events: Number of natural hazard engineering assessments completed Increasing Temperature: Number of pavement segments and pilot projects |
| RPM Under Development | |
| State DOT | RPM |
| Michigan DOT | Logging of flooding events in the Detroit metropolitan area |
| Utah DOT | Estimate risk in monetary value ($) for pavement, bridges and culverts Risk Priority Net benefits of Resilience Improvements |
| Rhode Island DOT | Development of ArcGIS-based STORMTOOLS to measure sea level rise. Greenhouse gas (GHG) performance measures |
Source: (Minnesota Department of Transportation (MnDOT), 2022)
Use of RPMs in TAMPs
There are many federal and state requirements that encourage transportation agencies to incorporate resilience into their activities and efforts. The “Moving Ahead for Progress in the 21st Century Act (MAP-21) requires a State DOT to develop and implement a risk-based asset management plan in accordance with 23 U.S.C. 119, to achieve and sustain a state of good repair (SGR) over the life cycle of the assets and to improve or preserve the condition of the NHS. Pursuant to 23 U.S.C. 119(e)(4)(A), the State DOT must include all NHS highway pavements and bridges in its TAMP regardless of the ownership of the relevant NHS facility. Note that 23 U.S.C. 103(a) defines NHS as including the Interstate Highway System. In 2017, “The FHWA adopted the asset management rule, 23 CFR Part 515, to implement the asset management requirements.” (Federal Highway Administration, n.d.). 23 CFR 515 states that all state DOTS should develop risk-based asset management plans and must address risks associated with current and future environmental conditions. 23 CFR Section 667, which requires periodic evaluation of facilities repeatedly requiring repair and reconstruction due to emergency events, requires TAMPs to incorporate the following guidance:
- Establish a planning process for the full life cycle of assets that considers current and future conditions, i.e., natural hazard variability, extreme weather events, seismic events, etc. (23 C.F.R. 515.7(b)).
- Establish a risk-based asset management plan that includes risk assessments that address current and future conditions, address reoccurring damage and the associated costs, estimate the likelihood of risks, prioritize risks, and develop a mitigation plan for the highest priority risks (23 C.F.R. 515.7(b)).
State DOTs are incorporating resilience into their TAMPs at different levels of complexity and some are incorporating assets beyond the FHWA requirements (e.g., culverts, ITS, etc.). Even though state DOTS are making efforts to incorporate resilience into their TAMPs, there is no standardized approach to incorporate and measure resilience. A study published in 2019, The Connection between State of Good Repair and Resilience: Measures for Pavements and Bridges, explored the state of practice regarding the “connection between resilience measures and state of good repair, and the application of resilience related performance measures in asset management” (McNeil, et al., 2018). Case studies from this report indicated that “resilience is difficult to measure and interpret” but highlighted that “TAMPs integrate the concepts of resilience as needed enterprise risk management and vulnerability assessment tools support the integration of resilience into the plans.” The five case studies compute resilience based on different factors including functionality over time. These models can be applied at both the project and network level; however, network level analysis might be computationally intensive and require network models (McNeil, et al., 2018). Table 12 presents an overview of the case studies from this effort.
Table 12 Overview of Case Studies
| Case Study | Overview |
|---|---|
| DelDOT- Prime Hood Road flooding | Estimated resilience based on functionality over time based on based on pavement condition and performance (distress data), and capacity of the road section but didn’t incorporate impacts to users. |
| NCDOT – I-95 Flooding | Estimated resilience based on the incorporation of the effects of closure and detours from floods incorporating a network analysis. In this case study resilience can be measured as the number of addition vehicles and distance traveled as well as based on recovery ratios. |
| NCDOT – Roberson County Flooding | Case study looked at resilience in three ways: snapshot of condition on a segment, as functionality changes over time and at the network level. The first case was based on robustness (functionality when the event occurs) and rapidity (time it takes to reopen the road). The second case, looked at resilience over time based on functionality and the third case considered network impacts and the additional travel time and distance due to closure. |
| DelDOT – Closure of I-495 bridge | The case study analyzed the role of redundances in the systems, the response time of agencies to closures and the traveler’s adaptability. |
| DelDOT – Snowstorm | This case study was based on discussions to understand the effects of operations during major events and understanding the actions taken to enhance preparedness and response and how that can connect to resilience (resourcefulness and rapidity). |
Source: (McNeil, et al., 2018)
These case studies provide examples of the way resilience can be incorporated into existing processes to achieve the implementation of a risk-based asset management approach to work towards the SGR objectives of infrastructure assets. In addition, there has been recent emphasis to incorporate resilience as part of the life cycle analysis of infrastructure assets. The incorporation of resilience into life cycle analysis will help to determine the appropriate actions and timing associated with these interventions to ensure the longevity of the asset. The need for this type of analysis has been identified and highlighted and presented by FHWA as shown in Figure 13 (Federal Highway Administration, n.d.).
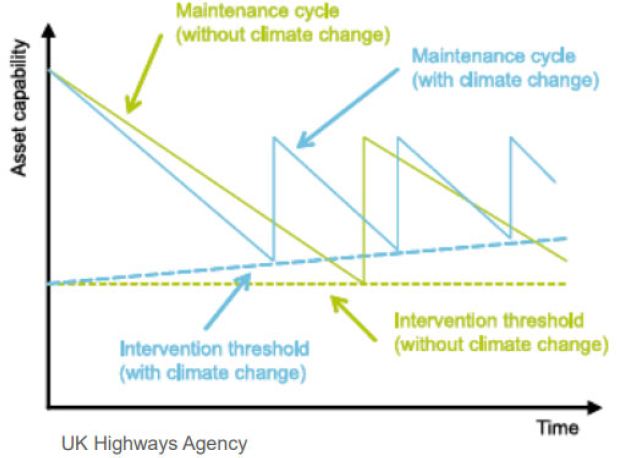
Source: (Federal Highway Administration, n.d.)
FHWA has sponsored multiple projects to help transportation agencies to incorporate resilience into asset management such as the Risk-Based Transportation Asst Management Reports: Building Resilience into Transportation Assets (Federal Highway Administration, 2013), Guidance Incorporating Risk Management into Transportation Asset Management Plans (Federal Highway Administration, 2017), Guidance on Using a Life Cycle Planning Process to Support Asset Management (Federal Highway Administration, 2017) and the Asset Management, Extreme Weather, and Proxy Indicators Pilot Program conducted between 2017 and 2019 (Federal Highway Administration, n.d.).
In addition to FHWA, other agencies such as the NCHRP and AASHTO also sponsor efforts in this area including the following projects: Integrating Extreme Weather Risk into Transportation Asset Management (Meyer, Rowan, Savonis, & Choate, 2012); Integrating Extreme Weather and Adaptation into Transportation Asset Management Plans (Meyer and Flood 2015); Managing Risk Across the Enterprise: A Guidebook for State Departments of Transportation (Proctor et al. 2016). All these efforts form the basis for incorporating resilience into asset management and for developing RPMs that ease agencies into leveraging resilience into decision making and to measure effectiveness of resilience efforts.
Use of RPMs in Transportation Systems Management and Operations (TSMO)
TSMO is a set of strategies that focus on operational improvements that can uphold and restore the performance of the existing transportation system before additional capacity is necessary. TSMO includes traffic incident management (TIM) and road weather management, both juxtapositioned to resilience work. (Federal Highway Administration, n.d.). For example, “roadway clearance time” (RCT) and “incident clearance time” (ICT) (two of the four mandatorily collected data points for TIM) can be nestled into the “Four R’s” under rapidity.
Traffic Incident Management
TIM is the management process of unplanned roadway events (traffic incidents). The end goal of TIM is to detect, respond, and clear traffic incidents so that traffic flow may be restored as safely and quickly as possible. TIM programs rely on four nationally-recognized TIM performance measures. Two of the four performance measures are tangential to resiliency: “RCT, the time between the first recordable awareness of the incident to time all lanes open for traffic flow, and “ICT, the time between the first recordable awareness of the incident to the time at which the last responder has left the scene. This data is collected by nearly all transportation agencies, ensuring that all DOTs can manage TIM performance accurately. Similarly, the FHWA completed a brief study on TIM performance measures and found that the most common measures for traffic incident management are number (or frequency) of incidents, detection time, response time, and clearance time. Despite the commonalities, the study also found that agencies are prone to measuring what is important to them with little coordination with peer agencies, even in the same region. For TIM and for the resilience practice, questions often arise like “When does the incident begin and end?” or “What is a suitable threshold for clearance time?” Some agencies are now establishing targets for TIM that specify response to or clearance of all incidents within a definite time frame. Several regions have recently stated goals of clearing all incidents within 90 minutes (Federal Highway Administration, n.d.).
The National Cooperative Highway Research Program’s 07-20 Guidance for Implementing TIM Performance Measures¸ provides a working framework to support an agency or TIM program. This report delves into definitions and thresholds of the performance measures pertinent to resilience, RCT and ICT. 07-20 lists examples of thresholds for RCT. Florida stated a roadway clearance target of “less than 90 minutes,” whereas for minors incidents, Minnesota and Nashville, detailed “less than 30-35 minutes.” In Seattle, TIM staff aimed to “maintain or reduce a 155-minute average for major incidents with durations exceeding 90 minutes.” In New Orleans, TIM staff aim to clear the roadway within 30 minutes for 75 percent of all incidents. Likewise, the target RCT in San Francisco was 90 minutes for 50 percent of all incidents. Anecdotally, clearance performance targets were developed using convenient thresholds rather than erudite methods based on historical performance data (Pecheux et al. 2014).
In respect to ICT, TIM staff across Ohio considered an incident to be cleared when “either the last transportation agency responder or the last law enforcement agency responder had left the scene.” However, in Rhode Island, the incident is cleared when “most” responders have left the scene; excluding a single officer who remains on-scene to complete reporting. On the west coast, places such as Los Angeles and Salt Lake City identify ICT as “the time for queue dissipation.” Multiple cities reported overall ICT target of less than 90 minutes, with some denoting severity as a factor. In Salt Lake City, “less than 90 minutes for an incident involving a fatality, less than 60 minutes for an incident involving an injury, and less than 30 minutes for an incident involving property damage only.” In Houston, the goal was to remove 98 percent of halted vehicles from the roadway within 90 minutes, and 70 percent of halted vehicles from the roadway within 20 minutes. In Florida, they partake in a “letter grade scheme” with less than 60 minutes receiving an “A,” and more than 120 minutes receiving an “F” (Pecheux et al. 2014).
As the calculation of ICT and RCT are based on the same start time – the first recordable awareness of an incident – mirrored challenges exist with calculating ICT and RCT, including the determination of the “first recordable awareness of the incident” as well as the nature and extent of the data available to calculate ICT. In Houston an assortment of data to support the calculation of ICT was limited to the SafeClear Program (Houston’s freeway service patrol) and was defined as the time between when the SafeClear tow operator is notified of an incident and the time the halted vehicle is removed from the roadway. A similar challenge relates to the accuracy of last responder departure times from the scene. While data are often captured through standard communications or surveillance, delays in reporting or observing departure of the last responder can yield inflated ICTs (Pecheux et al. 2014).
Other TIM performance measures that can be repurposed for resiliency include:
- Number of incidents.
- Frequency of incidents.
- Incident delay.
- Times related to the closure/opening of individual lanes.
- Severity of incidents.
- Number of fatalities.
- Service patrol statistics (e.g. roadway miles covered, number of assistance calls, etc.).
- After-action statistics (e.g. number of reviews, percent of participating agencies, etc.).
- Travel delay.
- Queue length.
Importantly, value is added to these processes by adding context. Hence, providing information about incident severity, duration, impact, injury or fatality figures, roadway type, and vehicle type all provide meaningful insights into developing thresholds and ensuring a range of different factors is incorporated. This concept is consequential for resiliency given the wide variety of hazards, threats, and impacted asset types (Pecheux 2014).
Road Weather Management
Weather-related events can be deadly to system users and detrimental to roadway assets. Most weather-related crashes occur during rainfall, on wet pavement. Weather-responsive management has been a key topic for FHWA and NCHRP given the catastrophic toll it can have on a system. Performance management allows agencies to improve operational performance and implement tailored strategies for improved weather management (Federal Highway Administration, n.d.).
The Leveraging Road Weather Data for Performance Management Dashboards and Reports discusses one aspect for creating road weather performance measures is developing a data normalization method based on the severity of the event. This supports an agency’s understanding of whether performance has changed or if the change is due to increased severity. Many agencies internally use a weather severity index (WSI) or storm severity index (SSI), often utilizing data from outside sources such as the National Oceanic and Atmospheric Administration (NOAA). As well, for funding justification, states create their own performance management dashboards and publicly establish targets for success. Iowa DOT’s dashboard includes the average time roadways are returned to normal surface conditions for each of three maintenance service levels that are designated based on the roadway type. It provides current and historic averages of weather measures, like WSI and salt use, as well as annual historic measures of weather (e.g., WSI, snowfall quantity, snow events) and costs (e.g., labor, equipment, material). Minnesota DOT uses a performance dashboard to offer information on the percentage frequency for meeting the bare lane target of 70 percent,
a number of hours based on traffic volumes for the roadways during winter. Calculated performance measures can be published for internal use or shared with the public to illustrate a year-over-year comparison of costs and performance in road weather operations, and to highlight improvements and warrant increased investment (Federal Highway Administration, n.d.).
Similarly, a project for Clear Roads titled, Snow Removal Performance Metrics, worked through a review of the use of performance measures (or “metrics”) by transportation agencies for winter highway maintenance activities (Xu, et al., 2017). Figure 14 and Figure 15 show the report’s compilation of metrics.
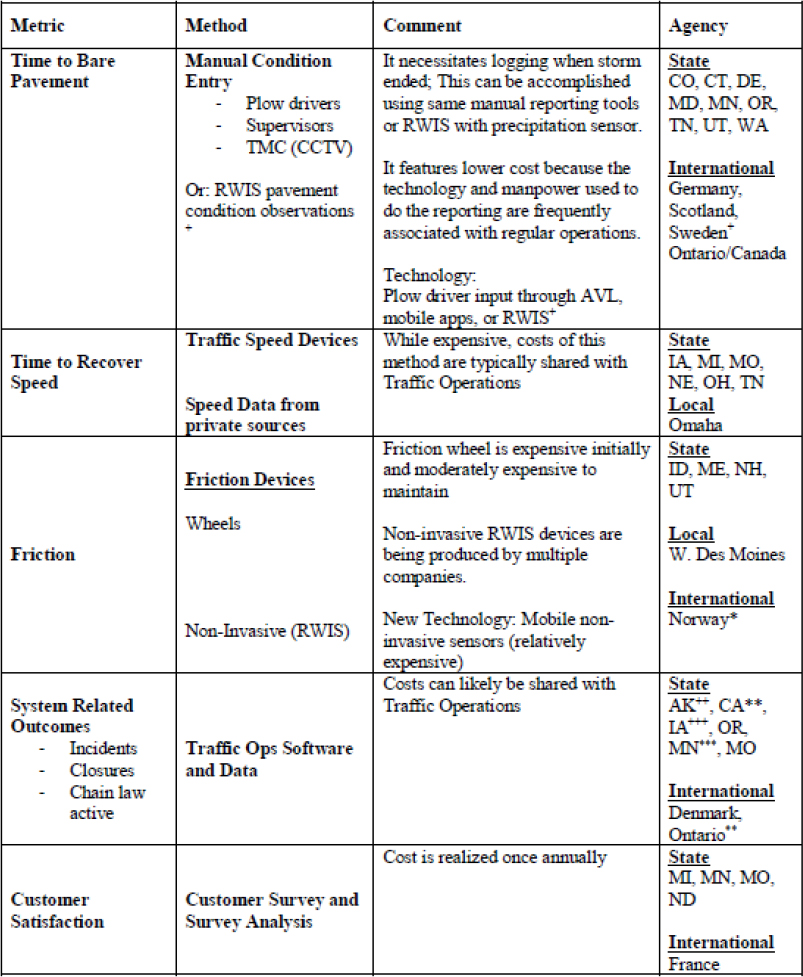
Source: (Xu, et al., 2017).
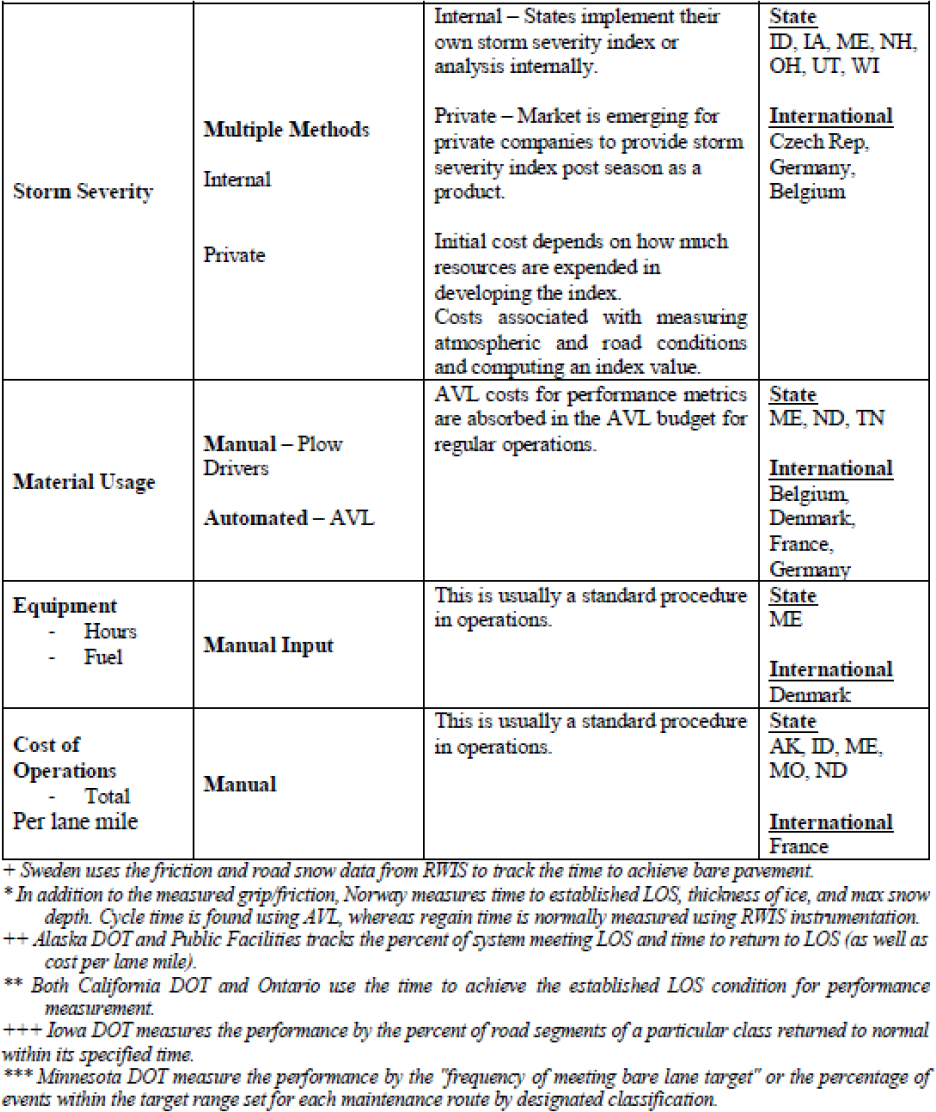
These performance metrics were collected through a series of interviews. The goal was to also understand the quantifiable and empirical attributes underneath the metrics. Some key takeaways were presented, such as 51 percent of respondents (of the agencies listed in the figures above) reported focusing on providing bare pavement as soon as possible. Fourteen agencies (27 percent of respondents) are working on updating their metrics. Among these 14 agencies, five agencies specified adding speed-based metrics and pursuing more friction-based metrics. Severity index-based performance metrics are popular, with 37 percent of
respondents currently using a severity index. Of these, seven DOTs (14 percent) reported to utilize an SSI as part of their performance metrics (Xu, et al., 2017).
Use of RPMs in FEMA Continuity of Operations Plan (COOP)
COOP, as defined in the National Continuity Policy Implementation Plan and the National Security Presidential Directive-51/Homeland Security Presidential Directive-20 (NSPD-51/HSPD-20), is work done within individual executive departments and agencies to ensure that Primary Mission Essential Functions continue to be performed during an array of emergencies, including localized weather events, accidents and technological or attack-related emergencies (Federal Emergency Management Agency, n.d.). COOP provides a list of nine objectives comprised of underlying performance measures and sub-tasks. These performance measures do not detail thresholds or targets, but at a high level, resiliency performance measure development can learn from the objectives and concepts from this emergency management practice.
A sampling of two of the objectives and subsequent components are as follows:
Objective 2: “Minimizing Loss” is comprised of four performance measures. One of the performance measures under this objective is “Periodically review policy guidance for reducing loss of life and minimizing damage to critical assets.” This includes one sub-task “Conduct periodic threat briefings to COOP Team members focusing on activities that could affect essential functions and COOP capability,” (Federal Emergency Management Agency, n.d.).
Objective 5: “Alternate Facilities” is comprised of two performance measures, with three sub-tasks. One of the performance measures is “Ensure at least one fully resourced alternate facility is available to continue performance of all essential functions,” which is supported through the sub-tasks, “Establish and maintain a fully resourced and functional alternate COOP facility to support its COOP mission and essential functions,” and “Conduct periodic reviews of COOP resource availability and of safeguards for resources at the alternate facility” (Federal Emergency Management Agency, n.d.).
Emergency management performance measures such as these relate to resiliency objectives observed at a DOT. In general, objectives of the multi-year planning for COOP such as “loss of performance” or “reducing disruptions to operations” directly correlates with many transportation agencies’ resiliency work. COOP expounds the importance that performance measures need to demonstrate the essential functions of an agency regardless of the type of emergency. It instills an “all-hazards” planning approach, directly supporting resiliency management and asset management.
Summary: This section shows the relationship between project development and resilience by emphasizing the benefits for asset management and operations. It neatly breaks down resilience into the four R’s and domains, which provides context to better inform current transportation planning, while supporting future discussions on improvements. TSMO and resilience have similar metrics such as RCT and ICT. Using commonplace and well understood TSMO concepts can help interpret more obtuse concepts of resilience, as well as position the future of RPM development for the project team and for DOT staff. FEMA also provides a glimpse into emergency management practices and how an all-hazards approach aligns with goals and objectives related to resilience given the range of climatic disruptions.
Gaps: Currently, there is no standardized approach to incorporating resilience and developing RPMs within TAMPs.
Relevance for Practice: By providing background, examples of language, and case studies, this section reflects on the nuance and various environments resilience measures have potential impact on and potential opportunities to grow as a practice. It also emphasizes state and federal directives toward asset management and its positive correlation with RPM development. As well, TIM and Road Weather Management have lad significant groundwork for developing performance measures, thresholds, and targets which can be beneficial for the resilience practice in two ways. Since the data for TIM and Road Weather Management is widely available, it enables practitioners to understand the development of RPMs in relation to incidents. Secondly, it lets the resilience practice build upon the work that has been already successfully implemented at the DOT level.
Incorporating Community Resilience
Community Resilience in RPM Selection & Evaluation
According to the U.S. Environmental Protection Agency (EPA), community resilience in transportation is vital to access to work, learn, and participate in society. Providing a variety of quality, affordable transportation options that allow people to access the most opportunities in life benefits society as a whole (United States Environmental Protection Agency, 2011). The distribution of the negative impacts of natural hazard variability across socially and economically vulnerable populations is unequal, often impacting those with less money and resources to deal with the consequences of these events (Special Report 340, 2021). Due to the outsized impact on affected populations, community resilience is an essential component to incorporate into both the selection of RPMs, as well as the evaluation of RPMs.
Measuring Social & Community Resilience to Hazards & Stressors
Several tools have been created to measure social and community resilience to hazards and stressors.
Table 13 Tools to Measure Social & Community Resilience to Hazards & Stressors
| Tool | Owner | Description | Social & Community Resilience Connection |
|---|---|---|---|
| National Risk Index for Natural Hazards | U.S. FEMA | An interactive mapping tool that shows which communities are at highest risk to natural hazards. | The assessment includes data on social vulnerability and community resilience at county and Census tract levels. |
| Community Resilience Measures | National Institute of Standards and Technology | Currently developing a resilience program than includes tools and metrics to measure resilience. | Part of developing the resilience metrics is engaging community resilience stakeholders and create guides that are at the community scale. |
| Census Resilience Estimates | U.S. Census Bureau | Interactive tool and databases with individual and household risk factors from the American Community Survey. | Tool is focused on community resilience and includes an Equity Supplement that includes more data to show comprehensive data on social vulnerability. |
| Coastal Resilience Index | Louisiana Sea Grant, Mississippi-Alabama Sea Grant Consortium, and the NOAA Gulf Coast Services Center | Adapts the principles outlined by FEMA (2001) to the specific needs of coastal hazards and operationalizes them into an ordinal metric. | Uses a community-based approach to developing an index of resilience to storm events through self-assessment. |
| Resilience Measurement Index | Argonne National Lab | Evolution from previous Resilience Index, in which data are gathered at critical infrastructure facilities by trained assessors. The major components of the index are preparedness, mitigation measures, response capabilities, and recovery mechanisms. | Federal, top-down approach that does not involve community members but assesses physical and human components of critical infrastructure. |
| CDC/ATSDR SoVI | U.S. Center for Disease Control (CDC) | An index with an interactive map that uses 16 U.S. Census variables to help local officials identify communities that may need support before, during, or after disasters. | Tool is solely focused on social vulnerability in four themes: Socioeconomic Status, Household Characteristics, Racial and Ethnic Minority Status, and Housing Type/Transportation. |
| Tool | Owner | Description | Social & Community Resilience Connection |
|---|---|---|---|
| Baseline Resilience Indicator for Communities (BRIC) | University of South Carolina - Hazards & Vulnerability Research Institute (HVRI) | Index used as an initial baseline for monitoring existing attributes of resilience to natural hazards. Can be used to compare locations, determine the specific drivers of resilience for counties, and to monitor improvements in resilience over time. Available for 2010 and 2015. | BRIC categories include human well-being/cultural social, institutional/governance, and community capacity. |
| SPUR Model | San Francisco Planning and Urban Research Association (SPUR) | A set of metrics developed in 2008 to measure the resilience of the Bay Area with respect to earthquakes. | Community recovery is one of the target states of recovery for San Francisco’s Building and Infrastructure. |
Sources: (National Research Council, 2012), (Petit, et al., 2013)
Summary: This section draws attention to the federal momentum to concurrently expand the practice of community resiliency, fostering performance measures, innovative tools, and evaluative frameworks, in order for both to be more fully integrated in standard transportation planning and policy. Listed above are examples of several tools currently used to measure social and community resilience.
Gaps: There is a lack of ample examples of RPMs with community resilience included. Though several tools exist to guide resilience investments and projects at-risk geographical areas, there is limited experience in selecting and implementing RPMs based on their relevance to, and impact on impacted populations.
Relevance for Practice: A basic understanding of how communities, transportation, and resilience are intrinsically linked helps construct a community resilience approach RPMs. The examples of tools that measure social and community resilience to hazards and stressors provide are also helpful to review current RPMs and methodologies used to create them.
Implementation
It is critical to consider implementation when conceptualizing resilience performance management. Performance measurement in other transportation practice areas, such as sustainability, point to implementation being a topic that should be considered early in program design as well as continuously evaluated as measures are developed and put into practice (Zietsman et al. 2011). NCHRP Report 708: A Guidebook for Sustainability Performance Measurement for Transportation Agencies contains several best practices that are relevant to implementation of resilience performance management, including:
- Start with the big-picture perspective, such as by defining a resilient transportation system and working from there;
- Strong agency leadership is required to drive results;
- Interagency working groups and coordination are recommended to expand the reach of the agency’s program;
- Agencies should provide technical assistance when tracking certain measures;
- Performance measurement initiatives require sufficient resources, such as at least one dedicated staff member to focus on sustainability;
- The agency should make a commitment to long-term efforts;
- The performance measures should be linked to funding where possible; and
- When goal setting, set aspirations high and adopt specific targets (Zietsman et al. 2011).
The Guidebook also covered several challenges to implementation that practitioners should keep in mind. They noted that a difficult area for performance measurement implementation is moving from agreed-upon goals to measurable actions and suggest identifying ways to track and advance progress on measurable actions during performance measurement program design. Additionally, transportation agencies can find it difficult to achieve goals that depend on the cooperation of outside agencies and suggests collaboration to achieve results. Likewise, the Guidebook notes the difficulties that come from making tradeoffs for interrelated issues, which also applies to the objectives of resilience initiatives (Zietsman et al. 2011).
Building a Case for Resilience Investments
NCHRP Web-Only Document 385: Business Case and Communication Strategies for State DOT Resilience Efforts goes into greater detail about making a business case for resilience investments that is focused on rigorous economic analysis of alternatives tied to targeted communication strategies that lead to action (Indrakanti et al. 2023). Making a business case for resilience investments at transportation agencies requires three foundational actions:
- Understand the critical role that communications play in influencing investment decisions;
- Conduct vulnerability and risk assessments on transportation systems and assets; and
- Learn from successful applications of business cases in other transportation area, the Guidebook provides examples from TSMO, Complete Streets, and Data Governance.
These actions provide transportation practitioners with knowledge required to start creating a business case, including processes to identify system vulnerabilities, understand how to talk about investing to address those vulnerabilities, and drawing on lessons from other practice areas to make business cases. This emphasizes the critical role that communications play in this process and suggests that practitioners review the AASHTO Communication Guide for State DOTs (AASHTO, 2018). For communicating about natural hazard variability in particular, the California Department of Transportation (CalTrans) released a Climate Change Communications Guide that provides sample messages for communicating internally within a DOT (Caltrans, 2020).
From there, practitioners can follow a Conceptual Framework laid out in NCHRP Web-Only Document 385 to examine alternatives, conduct an economic analysis of the costs and benefits of those alternatives to select proposed solutions, and consider the challenges, opportunities, and implementation steps that are required by that solution. Making a successful business case depends on an economic analysis that analyzes the cost and benefits of different adaptation options and estimates their return on investment. NCHRP
Research Report 938 provides additional resources for measuring the costs and benefits of adaptation efforts related to extreme weather events (Dewberry Engineers Inc. et al 2020).
Leadership Support for Implementing Resilience Initiatives
Leadership buy-in is key to the success of resilience initiatives. Many resilience practitioners voice the difficulty in pushing for results and prioritizing investment in resilience without strong leadership support that can act as a champion and drive results both within and outside of the agency. Because of the importance of leadership, this section will cover potential strategies for practitioners to identify and obtain buy-in from a resilience champion among agency leadership.
NCHRP Web-Only Document 385 presents transportation practitioners with resources for developing robust business cases for resilience investments that are tied to persuasive communication strategies (Indrakanti et al. 2023). This report presents a use-case of how to use the research products to obtain buy-in from leadership for a hypothetical agency’s resilience initiative. Suggested actions include:
- Perform general audience segmentation by developing a list of stakeholders with which to communicate.
- – Practitioners can use the worksheets from the DOE’s Better Buildings Neighborhood Program to better understand the target audience (Department of Energy, 2013). This includes understanding who is the primary audience and who can influence the primary audience, identify the behavior change, understand the motivations and barriers to change, and develop messages, strategies and tactics to persuade the primary audience.
- Develop a communication plan with general communication guidelines and goals for major external and internal audience groups; and
- Develop key talking points for DOT leadership aimed at all audiences.
Each of these actions can be applied to an agency’s leadership to understand their motivations as an audience, consider how to discuss the benefits of resilience, and develop a communication plan with strategies and messages to persuade action from leadership. Additionally, the leaders of many transportation agencies prioritize community resilience, so it will be helpful to include affected communities and messaging about how resilience initiatives benefits affected populations in the audience segmentation, communication plan, and key talking points that are developed to persuade leadership.
Additionally, NCHRP Web-Only Document 385 contains case studies of real business cases for resilience investments. Some possible persuasive arguments to consider with agency leadership include:
- Bold action taken now can preserve economic vitality and livability despite threats of natural hazard variability. Failure to act could leave multiple neighborhoods vulnerable to hazards, such frequent flooding from major coastal storms;
- Can combine flood protection infrastructure with a network of open spaces for recreation;
- Need a resilience champion with authority that can stir a sense of urgency and effect political mobilization;
- Messaging to stakeholders could focus on project feasibility, funding, and providing resources rather than the urgency of impacts; and
- The benefits of investment in the transportation sector were emphasized as a double benefit. That means they will not only help the community withstand adaptation to future scenarios but also mitigate those scenarios through reduced greenhouse gas emissions.
Summary: The three key takeaways from this section are 1) strong leadership is necessary to take resilience plans from shelf to implementation, 2) agencies need to be able to explain the economic benefits of resilience investments, and 3) building communication plans are helpful when gaining buy in and turning concepts into actionable strategies.
Gaps: Though resources exist to help practitioners obtain leadership buy-in for resilience investments, there is no silver bullet for obtaining leadership support for resilience investment. Additionally, there is little information available for how to obtain leadership buy-in for incorporating resilience into performance management programs and then using those measures to track the effectiveness of resilience initiatives.
Relevance for Practice: Implementation of RPMs into transportation performance management programs is a key topic for this research effort and steps that need to be taken to obtain leadership buy-in for successful adoption and implementation of RPMs will be explored in detail in the strategic implementation model, stakeholder engagement workshops, and the implementation guide.
References
AASHTO. (2013). SCOPM Task Force Findings on MAP-21 Performance Measure Target-Setting. In Standing Committee on Performance Management (pp. 1-22).
AASHTO. (2018). Communications Guide for State Departments of Transportation. Retrieved from https://store.transportation.org/Item/PublicationDetail?ID=3730
Adey, B., Martani, C., & Kielhauser, C. (2019). Foresee Project: Guideline to measure Levels of Service and resilience in infrastructures. Retrieved from https://foreseeproject.eu/wpcontent/uploads/2019/10/D1.1-Guideline-to-measure-Level-of-Service-and-Resilience-inInfrastructures.pdf
Ahmed, S., & Dey, K. (2020). Resilience modeling concepts in transportation systems: a comprehensive review based on mode, and modeling techniques. Journal of Infrastructure Preservation and Resilience.
Amazon Web Services (AWS). (2021). Measure and Improve Your Application Resilience with AWS Resilience Hub. Retrieved from https://aws.amazon.com/blogs/aws/monitor-and-improve-your-application-resiliency-with-resilience-hub/#:~:text=Resilience%20targets%20are%20typically%20measured,be%20lost%20after%20an%20incident
American Society of Mechanical Engineers (ASME) Innovative Technology Institute, LLC. (2010). Risk Analysis and Management for Critical AssetProtection (RAMCAP Plus). doi:10.1002/9780470087923.hhs003
American Water Works Association (AWWA). (2021). AWWA J100-21 Risk and Resilience Management of Water and Wastewater Systems. Retrieved from https://engage.awwa.org/PersonifyEbusiness/Bookstore/Product-Details/productId/88116441
Bodeau, D. J., Graubart, R. D., McQuaid, R. M., & Woodill, J. (2018). Cyber Resiliency Metrics, Measures Cyber Resiliency Metrics, Measures. Retrieved from https://www.mitre.org/sites/default/files/2021-11/prs-18-2579-cyber-resiliency-metrics-measures-of-effectiveness-and-scoring.pdf
Caltrans. (2020, 3). California Department of Transportation Climate Change Communication Guide. Retrieved from https://dot.ca.gov/-/media/dot-media/programs/transportation-planning/documents/caltransclimatecommunicationguidepdf-a11y.pdf
Cambridge Systematics, Inc., Boston Strategies International, Inc., Gordon Proctor and Associates, and Markow, M. (2010). NCHRP Report 666: Target-Setting Methods and Data Management to Support Performance-Based Resource Allocation by Transportation Agencies, Volume I: Research Report, and Volume II: Guide for Target Setting. Transportation Research Board of the National Academies, Washington DC. doi:https://doi.org/10.17226/14429
Cambridge Systematics, Inc., PB Consult, and Texas Transportation Institute. (2006). NCHRP Report 551: Performance Measures and Targets for Transportation Asset Management. Transportation Research Board of the National Academies, Washington, DC.
Cybersecurity & Insfrastructure Security Agency (CISA). (2023). Critical Infrastructure Sectors. Retrieved 2023, from https://www.cisa.gov/topics/critical-infrastructure-security-andresilience/critical-infrastructure-sectors
de Jonge, A., van Marle, M., Connolly, L., de Paor, C., & Bles, T. (2022). ICARUS: Baseline report on minimum service levels, decision frameworks and resilience evaluation. Retrieved from https://icarus.project.cedr.eu/wp-content/uploads/2021/10/Baseline-report-on-minimum-service-levels-decision-frameworks-and-resilience-evaluation.pdf
Department of Energy. (2013). Step 4: Identify Target Audiences and Behavior Changes. Retrieved from https://www.energy.gov/eere/better-buildings-neighborhood-program/step-4-identify-target-audiences-and-behavior-changes
Department of Homeland Security (DHS). (2016). Critical Infrastructure Threat Critical Infrastructure Threat. A Reference Guide for the Critical Infrastructure Community. Retrieved from https://www.cisa.gov/sites/default/files/publications/ci-threat-information-sharing-framework-508.pdf
Dewberry Engineers Inc., Venner Consulting, Inc., Impact Infrasturcture, Inc., and McVoy Associates LLC. (2020). NCHRP Research Report 938: Incorporating the Costs and Benefits of Adaptation Measures in Preparation for Extreme Weather Events and Climate Change—Guidebook. Transportation Research Board, Washington, DC. https://doi.org/10.17226/25744
Dix, B., Zgoda, B., Vargo, A., Heitsch, S., & Gestwick, T. (2018). Integrating Resilience into the Transportation Planning Process: White Paper on Literature Review Findings. Retrieved from https://www.fhwa.dot.gov/environment/sustainability/resilience/ongoing_and_current_research/planning/integrating_resilience.pdf.
Federal Emergency Management Agency. (n.d.). Continuity of Operations (COOP) Multi-Year Strategy and Program Management Plan Template. Washington D.C.
Federal Highway Administration. (2013). Risk-Based Transportation Asset Management: Building Resilience into Transportation Assets. USDOT/FHWA. Retrieved from https://www.fhwa.dot.gov/asset/pubs/hif13018.pdf
Federal Highway Administration. (2014). FHWA Order 5520. Retrieved 2023, from https://www.fhwa.dot.gov/legsregs/directives/orders/5520.cfm
Federal Highway Administration. (2017). Incorporating Risk Management Into Transportation Asset Management Plans. USDOT/FHWA. Retrieved from https://www.fhwa.dot.gov/asset/pubs/incorporating_rm.pdf
Federal Highway Administration. (2017). Using A Life Cycle Planning Process To Support Asset Management. Retrieved from https://www.fhwa.dot.gov/asset/pubs/life_cycle_planning.pdf
Federal Highway Administration. (2022, July 29). Promoting Resilient Operations for Transformative, Efficient, and Cost-Saving Transportation (PROTECT) Formula Program Implementation Guidance. Retrieved from https://www.fhwa.dot.gov/environment/sustainability/resilience/policy_and_guidance/protect_formula.pdf
Federal Highway Administration. (2023, March). FHWA Strategic Plan FY 2022-2026. Retrieved from https://highways.dot.gov/sites/fhwa.dot.gov/files/2023-03/FHWA_Strategic_Plan_03102023_508.pdf
Federal Highway Administration. (2024, March). TPM Toolbox. Retrieved from Glossary: https://www.tpmtools.org/guidebook/appendix-c-glossary/
Federal Highway Administration. (n.d.). Asset Management and Environmental Risk. Retrieved 2023, from Asset Management: https://www.fhwa.dot.gov/asset/pilot/
Federal Highway Administration. (n.d.). FHWA Approaches for Addressing Extreme Weather Resilience in Asset Management. FHWA. Retrieved from https://onlinepubs.trb.org/onlinepubs/Conferences/2018/AssetManagement/Gaj_KafalenosFHWAApproach.pdf
Federal Highway Administration. (n.d.). Leveraging Road Weather Data for Performance Management Dashboards. Electronic. Retrieved from Road Weather Management Program: https://collaboration.fhwa.dot.gov/dot/fhwa/RWMX/SiteAssets/WRMS/home.aspx
Federal Highway Administration. (n.d.). TPM Toolbox. Retrieved from https://www.tpmtools.org/
Federal Highway Administration. (n.d.). Transportation Asset Management Plan Development Processes Certification and Recertification Guidance. Retrieved from https://www.fhwa.dot.gov/asset/guidance/certification.pdf
Federal Highway Administration. (n.d.). Performance Measures to Improve TIM. Retrieved from Traffic Incident Managemetn: https://ops.fhwa.dot.gov/tim/preparedness/tim/performance_measures.htm
Indrakanti, S., et al. (2023). NCHRP Web-Only Document 385: Business Case and Communication Strategies for State DOT Resilience Efforts. Transportation Research Board, Washington, DC. https://doi.org/10.17226/27426
Inter-American Development Bank. (2019, December). A Framework and Principles for Climate Resilience Metrics in Financing Operations. Retrieved from IADB Publications: https://publications.iadb.org/en/framework-and-principles-climate-resilience-metrics-financing-operations
John Jay Research and Evaluation Center. (n.d.). Evidence Generation - Process and Outcome Measures. Retrieved from https://johnjayrec.nyc/evgenmeasures/#:~:text=Process%20Measures%20are%20used%20to,what%20services%20they%20are%20receiving.
McNeil, S., Lee, E., Li, Y., Chiquoine, R., Heaslip, K., & Herming, G. (2018). COLLABORATIVE PROPOSAL: The Connection between State of Good Repair and Resilience: Measures for Pavements and Bridges. Retrieved from https://cait.rutgers.edu/wp-content/uploads/2018/05/cait-utc-nc45-final.pdf
Meyer, M., and Flood, M. (2015). Integrating Extreme Weather into Transportation Asset Management Plans. Final Report of NCHRP Project 25-25. Retrieved from https://onlinepubs.trb.org/onlinepubs/nchrp/docs/NCHRP25-25(94)_FR.pdf
Meyer, M., Rowan, E., Savonis, M., & Choate, A. (2012). Integrating Extreme Weather Risk into Transportation Asset into Transportation Asset. AASHTO. Retrieved from http://climatechange.transportation.org/pdf/extrweathertamwhitepaper_final.pdf
Minnesota Department of Transportation (MnDOT). (2022). Developing Transportation System Climate. UDOT of Office Reserach & Innovation. Retrieved from https://www.dot.state.mn.us/research/TRS/2022/TRS2202.pdf
National Research Council. (2005). Measuring Performance and Benchmarking Project Management at the Department of Energy. Washington, DC: The National Academies Press. https://doi.org/10.17226/11344
National Research Council. (2012). Disaster Resilience: A National. Washington, DC: The National Academies Press. https://doi.org/10.17226/13457
Pecheux, K., Holzbach, J, and Brydia, R. (2014). Guidance for Implentation of Traffic Incident Management Performance Measurement. Final Report for NCHRP Project 07-20. Retrieved from https://apps.trb.org/cmsfeed/TRBNetProjectDisplay.asp?ProjectID=3160
Petit, F., Bassett, G., Black, R., Buehring, W., Collins, M., Dickinson, D., . . . Peerenboom, J. (2013). Resilience Measurement Index: An Indicator of Critical Infrastructure Resilience. Argonne Scientific Publications. Retrieved from https://publications.anl.gov/anlpubs/2013/07/76797.pdf
Petkovic, G., Kristensen, L., Dolva, B. (2019). Norwegian Roads and Climate Change- An Adaptation Framework.
Poulin, C., & Kane, M. B. (2021). Infrastructure resilience curves: Performance measures and summary metrics. Reliability Engineering & System Safety, Volume 216. doi:https://doi.org/10.1016/j.ress.2021.107926
Proctor, G., Varma, S., & Roorda, J. (2016). Managing Risk across the Enterprise: A Guide for State Departments of Transportation. NCHRP. Retrieved from https://onlinepubs.trb.org/onlinepubs/nchrp/docs/NCHRP08-93_FullGuide.pdf
Reeves, S., Winter, M., Leal, D., & Hewitt, A. (2019). Roads: An industry guide to enhancing resilience. TRL and Resilience Shift, UK.
rfvcsacd. (n.d.). cdc. Retrieved from cds.
Roser, R., & Mispy, O.-O. (2018). Measuring progress towards the Sustainable Development Goals. Retrieved from Our World in Data: https://sdg-tracker.org/
Sandia National Laboratories. (2017). Resilience Metrics for the Electric Power System: A Performance-Based Approach. doi:https://doi.org/10.2172/1367499
Shandiz, S. C., Foliente, G., Rismanchi, B., Wachtel, A., & Jeffers, R. F. (2020). Resilience framework and metrics for energy master planning of communities. Retrieved from https://www.sciencedirect.com/science/article/abs/pii/S0360544220309634?via%3Dihub
Special Report 340: Investing in Transportation Resilience: A Framework for Informed Choices. (2021). Transportation Research Board, Washington, DC. https://doi.org/10.17226/26292
The White House. (2022). Justice40: A Whole-of-Government Initiative. Retrieved from https://www.whitehouse.gov/environmentaljustice/justice40/
Tierney, K., & Bruneau, M. (2007). Conceptualizing and Measuring Resilience. A Key to Disaster Loss Reduction. TR News 250. Retrieved from https://onlinepubs.trb.org/onlinepubs/trnews/trnews250_p14-17.pdf
U.S. Department of Transportation. (2022, June). Performance Measurement Guidance for the RAISE 2021 Discretionary Grant Program. Retrieved from https://www.transportation.gov/sites/dot.gov/files/2022-06/RAISE%202021%20Interim%20Performance%20Measures%20Guidance.pdf
U.S. Department of Transportation. (2023, February). Notice of Funding Opportunity for the Department of Transportation’s National Infrastructure Investments (i.e., the Rebuilding American Infrastructure with Sustainability and Equity (RAISE) Grant Program), Amendment No. 2. Retrieved from https://www.transportation.gov/sites/dot.gov/files/202302/RAISE%202023%20NOFO%20Amendment2.pdf
United States Department of State. (n.d.). A good start with S.M.A.R.T. (indicators). Retrieved from https://eca.state.gov/files/bureau/a_good_start_with_smart.pdf
United States Department of State. (n.d.). Performance Measurement Definitions. Retrieved from Bureau of Educational and Cultural Affairs, Evaluation Division: https://eca.state.gov/files/bureau/performance_measurement_definitions.pdf
United States Department of Transportation and Federal Highway Administration. (n.d.). Transportation Performance Management. Retrieved from https://www.fhwa.dot.gov/tpm/about/regulations.cfm
United States Department of Transportation and Federal Highway Adminstration. (n.d.). Transportation Performance Management. Retrieved from https://www.fhwa.dot.gov/tpm/about/how.cfm
United States Environmental Protection Agency. (2011). Guide to Sustainable Transportation Performance Measures. Retrieved from https://www.epa.gov/sites/default/files/2014-01/documents/sustainable_transpo_performance.pdf
United States Environmental Protection Agency. (2023). Program Evaluation and Performance Measurement at the EPA. Retrieved from https://www.epa.gov/evaluate/program-evaluation-and-performance-measurement-epa#performacemaeasurement
University of California. (2016). SMART Goals: A How to Guide. Retrieved from https://www.ucop.edu/local-human-resources/_files/performance-appraisal/How%20to%20write%20SMART%20Goals%20v2.pdf
US Department of Transportation, F. H. (2020, March 2). Performance Measurement Fundamentals. Retrieved from Operations Performance Measurement Program: https://ops.fhwa.dot.gov/perf_measurement/fundamentals/index.htm
Weilant, S., Strong, A., & Miller, B. M. (2019). Incorporating Resilience into Transportation Planning and Assessment. Retrieved from https://www.rand.org/pubs/research_reports/RR3038.html.
Willis, H., & Loa, K. (2015). Measuring the Resilience of Energy Distribution Systems. RAND Corporation. Retrieved from https://www.energy.gov/sites/prod/files/2015/07/f24/QER%20Analysis%20-%20Measuring%20the%20Resilience%20of%20Energy%20Distribution%20Systems.pdf
Xu, G., Shi, X., Sturges, L., Chapman, M., Albrecht, C., & Bergner, D. (2017). Snow Removal Performance Metrics. Washington State University. Retrieved from http://clearroads.org/wp-content/uploads/dlm_uploads/FR_CR.14-05_Final.pdf
Zietsman, J., Ramani, T., Potter, J., Reeder, V., and DeFlorio, J. (2011). NCHRP Research Report 708: A Guidebook for Sustainability Performance Management for Transportation Agencies. Transportation Research Board of the National Academies, Washington, DC. https://doi.org/10.17226/14598


