Carving Our Destiny: Scientific Research Faces a New Millennium (2001)
Chapter: Taking a Snapshot of the Early Universe
5
Taking a Snapshot of the Early Universe
John E. Carlstrom
Department of Astronomy and Astrophysics, University of Chicago
INTRODUCTION
Starting as children, we are driven to explore our environment and constantly expand our horizons. The field of cosmology coordinates this exploration, allowing each generation to start its exploration at the frontier of the previous generation. Cosmology strikes a fundamental chord in all of us; we are struck with the enormity of the universe and are humbled by our place within it. At the same time we are empowered with our ability to obtain answers to fundamental questions of the universe. Peering back to the early universe and taking a snapshot does more than let us measure cosmological parameters—it enriches us and satisfies a fundamental desire in all of us.
Copernicus at the beginning of the Renaissance set in motion a fundamental change in our understanding of our place in the universe by showing that the Earth circles the Sun. Today, cosmologists are also setting in motion a fundamental change by showing that the matter we know about, the stuff that makes up the Sun, Earth, and even ourselves, only accounts for a small fraction, perhaps as little as 10 percent, of the mass of the universe.
Cosmology today is at a crossroads where theory and experiment are coming together. Astrophysicists are narrowing in on the Hubble constant, the rate of expansion of the universe. Theorists have developed a
standard cosmological model for the origin of structure in the universe. They have also shown that the key to understanding the universe is contained in the cosmic microwave background radiation, the relic radiation of the Big Bang, motivating experimentalists to build ever-more sensitive experiments. Through studies of the microwave background, theorists and experimentalists are on the cusp of testing rigorously the standard model and determining precise values of cosmological parameters, which will soon tell us the age of the universe, whether it will expand forever or close in upon itself, and how much mass is in a form still unknown to physicists.
The cosmic microwave background photons (particles of light) travel to us from across the universe, from a time when the universe was in its infancy, less than a ten-thousandth of its present age. Small differences, of an order of a few hundred-thousandths, in the intensity of the microwave background carry information about the structure of the infant universe. The properties of the cosmic microwave background also make it an incredible backlight with which to explore the universe; it is strong, even a radio can pick it up, and it is extraordinarily isotropic. If our eyes were sensitive to microwave radiation, we would see a uniform glow in all directions. However, just as the stained glass of a cathedral window creates a beautiful display of color and shape from a common backlight, large-scale structures in the universe alter the intensity and spectrum of the microwave background. The results can be stunning, and, moreover, much can be learned about the universe from detailed studies of the display. These microwave eyes, however, would have to be very sensitive to see it, as the display has very little contrast, with only a tenth of a percent or less deviation from the uniform glow of the background.
My collaborators and I built a sensitive system to image the display created by the passage of the cosmic microwave background radiation through the gas contained within clusters of galaxies. The effect is known as the Sunyaev–Zel’dovich effect after the two Russian astrophysicists who predicted it in 1972. Using the powerful technique of radio interferometry, our system has allowed us to make, for the first time, detailed images of the effect. With these images we are able to measure distances to clusters and therefore obtain a completely independent measure of the Hubble constant, using a technique based solely on the physics of the cluster gas. Our Sunyaev–Zel’dovich effect data also allow us to estimate the ratio of ordinary matter to the total mass of a galaxy cluster. Combined with results from primordial nucleosynthesis calculations and elemental abundance measurements, our results allow an estimate of the mass density of the universe. The mass density that we find is close to the critical value that marks the transition between a universe which expands
forever and one which eventually will collapse upon itself due to the gravitational attraction of the matter.
So far we have limited our Sunyaev–Zel’dovich effect observations toward known clusters of galaxies. However, we wish to exploit a feature of the effect that is immensely powerful: The strength of the observed effect is independent of the distance to the cluster. The effect is therefore a unique probe of the distant universe and, in principle, can be used to place firm observational constraints on the evolution of structure in the universe. Currently, however, it takes several days to obtain a clear image of the effect toward a rich cluster of galaxies. By improving our instrument, we plan to decrease this time by more than a factor of 10 and begin a thorough exploration of the distant universe.
Based on the success of our Sunyaev–Zel’dovich effect imaging system, my collaborators and I have begun a much more ambitious experiment. We plan to take a detailed snapshot of the early universe. I am working with collaborators at the University of Chicago and at Caltech to build a pair of dedicated interferometers to image the small intensity differences, of an order of a few hundred-thousandths, in the cosmic microwave background radiation itself. Because this small anisotropy in the background radiation provides the key to understanding the origin and evolution of structure in the universe, these new instruments will open a new window on the universe. Although the instruments are designed to provide answers to some of the most pressing questions in modern cosmology, we recognize that discoveries in astrophysics are driven by new techniques and instrumentation. We fully expect that the new window on the universe opened by these instruments will provide fascinating and unexpected views.
THE EARLY UNIVERSE
Winding the Clock Backward
The early universe was much simpler than it is today. Yet from these relatively simple beginnings arose the vast multitude of complex phenomena that are present today.
Using ever-more powerful telescopes, astronomers have explored deep into the universe, looking far back in time. They have shown that the universe is expanding, with galaxies flying apart from each other with a speed proportional to their separation. The Hubble constant is the ratio of the recessional speed of a galaxy to its distance from our galaxy. Experiments have shown that the Hubble constant is a global constant; all
galaxies share the same linear relationship between their recessional velocity and distance. The exact value of the Hubble constant is difficult to determine. Precise recessional velocities are measured easily using spectroscopically determined Doppler shifts, but astronomical distances are problematic, especially for distant objects. Nevertheless, the Hubble constant is now known to lie roughly in the range 50– 85 km s−1 Mpc−1. Knowing the expansion rate, astronomers can predict the time when the expansion started. This time is simply the inverse of the Hubble constant. For 65 km s−1 Mpc−1, one over the Hubble constant equals 15 billion years. Accounting for the gradual slowing of the expansion due to the gravitational attraction of the matter gives an approximate age for the universe of 10–15 billion years.
What would we see if we were able to view the universe at earlier and earlier times? As we go back in time we notice that the universe is denser and hotter. We pass through the epoch when galaxies were formed, beyond the formation of the first stars, to a time when electrons and protons were combining to form hydrogen. The universe is about 300,000 years old, a tiny fraction of its present age. The cosmic microwave background radiation was emitted during this epoch. At earlier times the universe was made up of a simple fluid of photons (massless particles of light), subatomic particles, and the mysterious dark matter, matter which astronomers know about only by its gravitational pull on ordinary matter.
Properties of the Fluid
The dynamics of the fluid, or plasma, of the early universe were driven primarily by two forces: the gravitational attraction of the massive particles (baryons) and internal pressure caused by the continual scattering of photons by free electrons. The scattering keeps the photons coupled tightly to the plasma. Density perturbations will initiate a gravity-driven collapse. As the density increases during the collapse, the rate of photon-electron interactions—and therefore the pressure resisting the collapse—increases. This situation leads naturally to oscillations, actually acoustic (sound) oscillations.
Acoustic oscillations will be excited for regions spanning a broad range of sizes. The larger the size, however, the longer they take to develop. Thus there is a natural limit to the largest region that will begin to collapse, roughly the age of the universe times the speed of light. The cooling of the universe as it expands caused the electrons and protons to form hydrodgen when the universe was only 300,000 years old. This period, referred to as the epoch of “recombination,” even though it is in fact the first “combination” of electrons and protons, significantly affected the evolution of structure in the universe. With the electrons confined within
atoms, the photons no longer interact strongly with matter and begin streaming freely through the now transparent universe. The decoupling of the photons and matter causes the fluid to lose its internal support against gravity. Structures are now able to collapse further, leading eventually to the rich structure of the present universe.
THE COSMIC MICROWAVE BACKGROUND
The photons, which have been streaming freely through the universe since the epoch of recombination, also known as the period of last scattering, are detected today as the cosmic microwave background. Imprinted on the background as small fluctuations in its intensity, of an order a few hundred-thousandths, are the signatures of the acoustic oscillations present at the period of recombination. An image of the anisotropy in the microwave background provides a snapshot of the early universe and contains a wealth of information.
Astronomers infer the properties of astrophysical phenomenon by studying the property of the light received by their telescopes, its intensity, spectrum, and distribution on the sky. Astronomers also use scattered light to learn about the scattering medium. When the light has been scattered repeatedly, its direction, and eventually its energy, no longer carry information of the original source. Therefore, studying the cosmic microwave background provides information on the universe at the time of last scattering. It also provides information about the objects the microwave background photons encountered as they traversed the universe.
The spectrum of the cosmic microwave background can tell us a great deal about the early universe. The continual interaction of photons and electrons and other particles led to a condition of thermal equilibrium in the early universe. In equilibrium the distribution of the energies of the particles (i.e., velocities) and of the photons (i.e., wavelengths) are well known and described fully by a Planck spectrum with only knowledge of the temperature (see Figure 1). We are thus able to predict the spectrum of the background at the epoch of recombination; its spectrum is predicted to be a Planck spectrum for a temperature of 3,000 K.
Because of the expansion of the universe, the spectrum of the background radiation is different today than at the epoch of recombination. As space expands, so do the wavelengths of the photons traversing the universe. If the original spectrum is described by a Planck spectrum, then the resulting spectrum would still be described fully by a Planck spectrum, but at a lower temperature. The Cosmic Background Explorer (COBE), a NASA satellite designed to study the cosmic background radiation, measured its spectrum and found that it is indeed described extremely well by a Planck spectrum for roughly 3 K. This spectacular re-

FIGURE 1 Planck spectrum. The spectrum of radiation in thermal equilibrium is determined only by its temperature. It is independent of the composition of the object. A spectrum for a given temperature encloses all spectra with lower temperatures. This fact allows a temperature determination with a measurement at only one wavelength. The cosmic microwave background radiation is well described by a Planck spectrum for a temperature of roughly 3 degrees above absolute zero indicated by the red curve.
sult illustrates the ability to use the cosmic microwave background radiation to directly measure the properties of the early universe.
Ripples Across the Sky
The horizon—the distance spanned traveling at the speed of light for the age of the universe—at the epoch of recombination, when the cosmic microwave background photons last scattered, subtends an angle of roughly 1 degree today. Thus temperature fluctuations in the microwave background on angular scales smaller than a degree carry information about the earliest evolution of structure in the universe. On angular scales larger than a degree, the temperature fluctuations carry information on
the density inhomogeneities for regions that were disconnected—so far apart that even light traveling for the age of the universe could not carry information from one region to another. Such large-angular-scale temperature fluctuations in the cosmic microwave background can reveal the primordial density inhomogeneities in the universe.
Thus the measurement of temperature anisotropies at 7 degrees and greater angular scales by the COBE satellite caused great excitement as it provided a look, for the first time, at the primordial density inhomogeneities of the early universe. Since the COBE results were announced in 1992, many experimental groups have announced detection of temperature anisotropies, both on large angular scales and on degree and smaller angular scales. A compilation of these results is shown in Figure 2, where the vertical axis is the average level of the temperature fluctuations, and the horizontal axis is the angular scale over which the temperature fluctuations were measured. The horizontal axis is labeled in terms of angular multipole moments, which is just a convenient method for ordering the angular separations (an angular separation of θ is given roughly by 100°/l. Such a plot is referred to as an angular power spectrum. Note that the measurements show an apparent increase in the level of the background fluctuations at angular scales smaller than 1 degree, (l ≥ 100) which corresponds to the size of the horizon at the surface of last scattering.
On the theoretical side, the expected temperature fluctuations in the cosmic microwave background have been computed for a wide range of cosmological models. These models, of course, are incapable of predicting whether a particular direction on the sky is hot or cold, but instead they predict the expected magnitude of the temperature differences, on average, as a function of the angle of separation between two positions on the sky. The quantitative results are best shown with the aid of the angular power spectrum (see Figure 2). The predicted power spectrum shows a series of peaks and troughs, which are now understood as signatures of the acoustic oscillations in the photon pressure-supported fluid of the early universe. The first peak in the plot at roughly a half a degree (l~200) corresponds to temperature fluctuations caused by the largest regions to reach maximal compression at the time of decoupling. The temperature in these overdense regions is elevated slightly. The formation of these regions must also create underdense regions, for which the temperature is depressed slightly. The net results are ripples in the microwave sky. The power spectrum provides a way to present the magnitude of the ripples as a function of the subtended angle between neighboring hot (dense) and cold (rarefied) regions.
The next peak in the power spectrum is due to smaller regions that had just enough time to reach maximal rarefication (i.e., advanced by a half-cycle). These regions are slightly cooler, but still lead to a peak in the
background power spectrum because it is a measure of the fluctuations in the temperature. The process continues with each successive peak corresponding to oscillations advanced by a half-cycle to those of the previous peak. The “surface” of last scattering actually has a finite thickness, and therefore higher-order peaks in the power spectrum (which correspond to much smaller regions) appear much weaker because they represent an average of both hot and cold regions lying along the line of sight.
With this simplified theoretical picture in mind, one can see that sev-
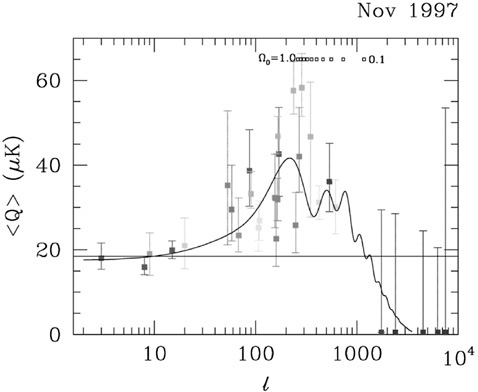
FIGURE 2 The experimental state of cosmic microwave background anisotropy measurements as of November 1997. The experimental results are shown as colored squares and error bars. The black curve showing a peak near l = 200 is the theoretical prediction for the standard inflationary model. A horizontal line drawn at the level of the COBE results at l less than 20 clearly underestimates the level of detection at degree angular scales (l~200); there is strong evidence that excess signal is detected at these angular scales. The small square boxes near the top of the figure indicate the location of the first peak predicted by cosmological models for differing values of the mass density of the universe. Thus far no experiment has had the necessary sensitivity and resolution in l to distinguish between models and to extract the cosmological parameters. Figure courtesy of M. White.
eral cosmological parameters can be extracted directly from the cosmic microwave background power spectrum. For example, the amplitude of each peak is related to the strength of the corresponding oscillation, which is determined by the density of ordinary matter. The physical scale associated with the first peak of the power spectrum is the horizon size at the time of decoupling. The observed angular size of this feature depends on the curvature of the universe, which depends on the sum of the total mass density of the universe and Einstein ’s cosmological constant. If the universe is flat, as predicted by the popular inflationary model for the early universe, then the first peak will be located at roughly a half a degree (l~200). For an open universe, one that will expand forever, space is curved and the first peak shifts to smaller angular scales.
It is remarkable that by making sensitive measurements of the tiny temperature fluctuations in the cosmic microwave background, we will learn the ultimate fate of the universe, whether it will expand forever, collapse upon itself, or whether the universe is precisely balanced between these fates.
The Sunyaev–Zel’dovich Effect: Mass and Age of the Universe
As the cosmic microwave background photons travel from the surface of last scattering to the observer, they may suffer interactions with intervening ionized matter. Just as the stained glass in a cathedral window creates a beautiful display of color and shape from a common backlight, these interactions alter the intensity and spectrum of the microwave background. Of particular interest is the effect that occurs when the background photons travel through a cluster of galaxies.
Galaxy clusters are enormous objects, containing as much as a thousand trillion times the mass of our Sun with the vast majority of the mass lying outside of the galaxies themselves in the form of intergalactic hot plasma and other as yet unknown forms of matter. This hot (of the order of 100 million Kelvin) x-ray-emitting plasma is spread uniformly throughout the cluster. A cosmic background photon traveling at the speed of light takes several million years to cross a cluster. Even so, it has only about a 1 percent chance of suffering an interaction within the plasma.
The scattering of the microwave photons by electrons in this hot plasma results in a small, localized distortion of the microwave background spectrum at the level of a thousandth or less. This spectral distortion of the microwave background is known as the Sunyaev–Zel ’dovich effect. Although the effect is rather weak, it is much stronger than the anisotropy imprinted on the microwave background from the surface of last scattering. This and the fact that it is a localized effect make it possible to separate the two phenomena.
Because they are among the largest objects in the universe, galaxy clusters provide powerful probes of the size, structure, and origin of the universe. Their cosmological significance is augmented by the fact that an independent determination of their distances, and therefore of the Hubble constant, can be made if accurate measurements of both the Sunyaev–Zel’dovich effect and the underlying x-ray emission can be made. In addition, x-ray and Sunyaev–Zel’dovich data can be used to measure the mass density of the universe by determining the ratio of ordinary to total mass in galaxy clusters and by determining the properties and number density of distant clusters.
The expected spectral distortion of the cosmic microwave background when observed toward a galaxy cluster is shown in Figure 3, relative to the undistorted spectrum. At radio frequencies, the Sunyaev–Zel’dovich effect produces a small decrement in the observed intensity. Amazingly, the Sunyaev–Zel’dovich effect predicts that an image of a rich cluster of
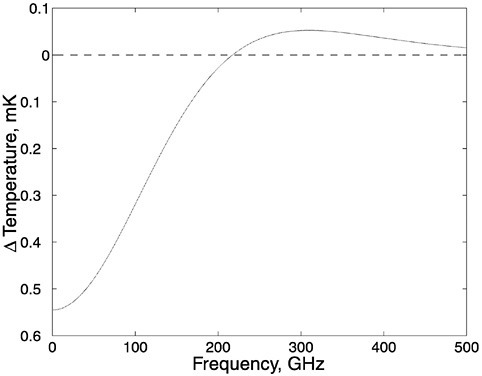
FIGURE 3 The Sunyaev–Zel’dovich effect spectral distortion of the cosmic microwave background spectrum due to the hot ionized gas associated with a massive cluster of galaxies (red line).
galaxies (an object with more than a trillion times the luminosity of the Sun) made at radio wavelengths should show a hole in the sky relative to the smooth glow of the microwave background.
The key to understanding the determination of the Hubble constant, and therefore the age of the universe, from a combination of the Sunyaev–Zel’dovich effect and x-ray data lies in their different dependencies on the density of electrons in the hot gas. Basically, the magnitude of the Sunyaev–Zel’dovich effect is proportional to the total number of electrons along the line of sight independent of how dense the gas may be. The magnitude of x-ray emission, however, is strongly dependent on the density of the gas. If the same amount of gas was compressed to a higher density, then its x-ray emission would become much stronger, whereas the Sunyaev–Zel’dovich effect would be unaffected. Combining both x-ray and the Sunyaev–Zel’dovich effect measurements of the gas thus allows a determination of its density structure, which in turn allows a determination of the size scale of the gas region. A comparison of this size with the observed angular extent of the cluster gas gives a measure of the distance to the cluster. The Hubble constant is given directly by combining the distance with the observed recessional velocity of the cluster.
A measurement of the Sunyaev–Zel’dovich effect also provides a direct measure of the mass of gas (ordinary matter) if the gas temperature, determined by x-ray spectroscopy, is known. Assuming the gas is roughly in equilibrium, not collapsing or expanding, then given its temperature, it is straightforward to predict the total mass, including the dark matter, that is required to bind the gas to the cluster through gravitational forces. Because clusters formed from large volumes, it is reasonable to expect that the ratio of their mass of ordinary matter to their total mass reflects the overall ratio for the universe. Cosmologists have narrowed the acceptable range for the mass fraction of ordinary matter in the universe. A mass fraction measured using the Sunyaev–Zel’dovich effect thus leads to an estimate of the total mass density of the universe.
A remarkable property of the Sunyaev–Zel’dovich effect is that the observed decrement is independent of the distance to the cluster. This is understood by recognizing that the ratio of the Sunyaev–Zeldovich effect temperature change to the temperature of the undistorted microwave background is a property of the cluster. Even though the temperature of the background was higher when the microwave photons interacted with the cluster gas (recall that the temperature of the microwave background was 3,000 K when it left the surface of last scattering and it is only 3 K now), both the temperature decrement due to the Sunyaev–Zel’dovich effect and the temperature of the microwave background decrease with the expansion of the universe in a way that maintains their ratio. Thus the magnitude of the Sunyaev –Zel’dovich effect is independent of the dis-
tance to the cluster. This property is in sharp contrast to the observed emission from an object, such as x-ray emission from the gas or optical emission from the galaxies, for which the observed flux rapidly fades with distance.
Large-scale surveys of the Sunyaev–Zel’dovich effect, therefore, offer the potential to probe the distant universe and to take an inventory of all massive clusters. The data from such a survey would greatly aid in our understanding of the formation of large-scale structure in the universe, allowing severe tests of models of structure formation and evolution because predictions for the number, masses, and morphology of distant clusters differ widely between competing models. For example, the current factor of 5 in the uncertainty of the mass density of the universe leads to an order of magnitude difference in the predicted number of distant clusters.
Since Sunyaev and Zel’dovich made the first theoretical prediction of a cluster-induced distortion in the cosmic microwave background in 1972, numerous groups have struggled to detect this effect. Until quite recently, the effect has been detected only for a small number of clusters. That situation changed dramatically with the introduction of interferometers specifically tailored for accurate imaging of the Sunyaev–Zel’dovich effect in galaxy clusters. As I show below, my group has made substantial contributions in this area.
EXPERIMENTAL CHALLENGES
The cosmic microwave background radiation is “detected” easily, although it is difficult to distinguish from other sources of noise. The snow on a television set, or the hiss of a radio, when tuned away from a station, has a significant contribution from the microwave background. In 1964 Arno Penzias and Robert Wilson were investigating the source of radio interference and discovered that the excess noise was coming from the heavens and appeared isotropically distributed. They had detected the cosmic microwave background radiation, the relic radiation of the Big Bang, for which they were awarded the Nobel Prize.
What is difficult to detect, however, are temperature differences in the microwave background—differences in the intensity of the radiation —between one part of the sky and another. The largest temperature anisotropy of the background is due to the motion of our solar system with respect to the inertial frame of reference of the background. Our solar system is moving with a speed of 370 km s−1 with respect to the background. This fact is inferred from a positive change in the temperature of the microwave background at a level of one-tenth of a percent when looking along the direction of our motion and a negative change of the same
magnitude when looking in the opposite direction. The COBE satellite has shown that, after accounting for this contribution, the departures from a perfectly smooth background on angular separations as close as 7 degrees are only of an order of several millionths.
There are a number of challenges facing experimentalists now and in the near future. First and foremost is a measurement of the anisotropy spectrum of the cosmic microwave background at angular scales from a few arcminutes to a degree (100 < l < 2000), with sufficient sensitivity to distinguish between cosmological models and to extract the cosmological parameters. Images of the microwave background are needed with sufficiently high quality to test not only model predictions of its distribution, but also to allow features to be inspected and compared with observations using a variety of techniques and wavelengths. At arcminute angular scales (l~3000), images of large regions of the sky to inventory all galaxy clusters are needed to allow severe tests of models of structure formation and evolution.
The large scientific rewards for meeting these challenges have motivated many excellent research teams. There are no fewer than 12 new experiments planned, and both NASA and the European Space Agency have selected cosmic microwave background satellite missions to scan the entire sky. Building on the success of our Sunyaev–Zel’dovich effect imaging program, my team plans to tackle these challenges using novel interferometric arrays. As I discuss below, the inherent stability of interferometry will allow us to make high-quality images of a large fraction of the sky from superb ground-based sites.
Interferometry: A Different Way of Seeing
Radio interferometry was developed to improve the angular resolution of radiometric observations by taking advantage of the wave-like nature of light. The technique also provides a number of benefits for making highly sensitive images at any resolution. In particular, it shows great promise for imaging the microwave background. However, new instruments must first be built because traditional interferometers, designed for high resolution, are insensitive to the angular scales needed to image the cosmic microwave background. Before discussing these new instruments, it is instructive to consider how traditional interferometers work.
The angular resolution of a telescope is limited by diffraction because of the wave-like properties of light. Imagine using a buoy placed in a lake to detect waves in the water. The buoy bobs up and down clearly detecting water waves, but what information does it provide regarding the direction of the waves? To help determine the direction, we might
place several buoys next to each other in a line. In this case, if all the buoys rise and fall synchronously, we would know that the wave was propagating from a direction perpendicular to the line of buoys. How well can we determine the direction to the source of the waves, or equivalently, how well can we determine the orientation of the wave front? It must depend on two quantities: the length L of the buoy array and the wavelength λ of the wave being detected. Roughly, we can expect to determine the direction with an uncertainty of the order of λ/L. If we want to determine the direction of a wave with a particular λ to high accuracy, we must increase L accordingly.
Consider a radio telescope. They can be very large, with diameters up to 100 m; however, they also operate at long wavelengths. Most radio telescopes were designed for wavelengths ranging from 1 m to 1 cm, although there are now extremely precise “radio” telescopes designed for wavelengths as short as 1 mm and a few for wavelengths as short as 0.3 mm. Consider the size of a radio telescope operating at 1 m that would be capable of the same resolution (i.e., same λ/L) as an eye looking at blue light. The pupil is only 4 mm in diameter, whereas blue light has a wavelength of ~400 nm, yielding λ/L = 0.0001, which corresponds to better than 1 arcminute, or the angle subtended by a quarter placed 100 m away. To achieve the same resolution at a wavelength of 1 m requires a radio telescope with a diameter of 8 km! Clearly, this is not practical.
The buoy example offers another possibility. If there are gaps in the line of buoys, we can still determine the direction of the wave. The analogous solution for radio telescopes is to use arrays of radio telescopes. This technique, called radio interferometry, is used routinely in radio astronomy. Arrays such as the Very Large Array (VLA) operated by the U.S. National Radio Astronomy Observatory are designed exclusively for interferometry. The 25-m-diameter telescopes of the VLA can be separated by more than 50 km, giving an angular resolution of 4 arcseconds at an operating wavelength of 1 meter. At its shortest operating wavelength of 7 mm, the VLA provides an angular resolution of three-hundredths of an arcsecond, about three times better than the Hubble Space Telescope! As impressive as this may seem, this resolution is crude compared with that achieved using very long baseline interferometry (VLBI). I have been part of a team of astronomers that has used a network of radio telescopes, located across several continents, to achieve an angular resolution of five ten-thousandths of an arcsecond.
If arrays work so well, why build large telescopes at all? The reason is simple: to collect as much light as possible. The amount of power received per square meter (referred to as flux) from a source that subtends an angle of only five ten-thousandths of an arcsecond is tiny, unless the source is extremely bright. In fact, only the brightest and most com-
pact objects can be seen using VLBI. A crude estimate of the minimum brightness object detectable at this resolution is about 10 million K, much brighter than the Sun. VLBI, however, is ideally suited for observations of the energy released from matter as it is accreted by massive black holes found in the center of active galaxies. We have observed objects as bright as a trillion degrees Kelvin.
Operating at shorter wavelengths improves the brightness sensitivity of an interferometer. Why this is the case is illustrated by the Planck curves in Figure 1; for a given temperature an object simply emits more energy at shorter wavelengths. The current state-of-the-art of traditional radio interferometry is operation at submillimeter (submm) wavelengths. My collaborators and I built the first submm-wave interferometer by linking the 15-m James Clark Maxwell Telescope (JCMT) and the 10.4-m Caltech Submillimeter Observatory (CSO) located at 14,000 ft near the summit of Mauna Kea, Hawaii. Our goal was to determine the nature of the excess submm-wave emission associated with young stars. Specifically, we wanted to know if the emission was from dusty circumstellar disks, similar to the early solar system. These young systems are hidden from view at optical wavelengths by the interstellar clouds in which they form.
An interferometer is needed to measure these protoplanetary disks. At the distance of the nearest stellar nurseries, the Taurus and Ophiucus clouds, the solar system would subtend an angle of an arcsecond or less, much smaller than the 10-arcsecond resolution of the JCMT telescope, the largest submm-wave telescope in the world. However, using the half-arcsecond resolution enabled by the 165-m separation of the CSO and JCMT telescopes, we have measured dimensions and masses of circumstellar disks for several stars. We find their properties quite similar to those inferred for the early solar system.
Benefits of Interferometry
Interferometry offers a number of attractive features even when high angular resolution is not desired. Namely, it offers high stability and sensitivity and the ability to produce two-dimensional images directly. These benefits arise naturally due to interferometers taking full advantage of the wavelike nature of light, using both amplitude and phase information. As shown in Figure 4, each pair of telescopes in an interferometer is sensitive to a particular “ripple” on the sky. The cosmic microwave background power spectrum (Figure 2) is a decomposition of the microwave sky into waves, with the wavelengths specified by l. This decomposition of a picture into waves is graphically illustrated in Figure 5, Figure 6 and Figure 7. Although an interferometer measures directly the power spectrum, it also measures
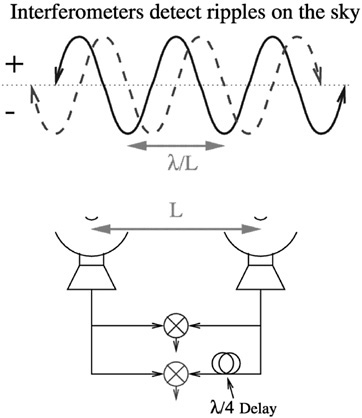
FIGURE 4 The response of a two-element interferometer is a sinusoid pattern on the sky. Signals received by the telescopes are transmitted to a central location where they are multiplied together. The product depends on the difference in path lengths from the source to the telescopes and on to the multiplier. The output of the multiplier therefore depends on the position of the source in the sky. The solid blue curve illustrates the dependence of the detected signal on the position of the source in the sky. Note that it is a sinusoid with an angular spacing set by the wavelength of the light divided by the separation of the telescopes. Thus ripples on the sky are measured directly. One may worry about not detecting a source where the pattern is zero. For this reason, a second multiplication is performed with an additional quarter-wavelength of path inserted into one of the signal paths. The detected signal from this multiplication is sensitive to the same ripple on the sky but is offset by a quarter-cycle as shown by the dashed red line. The ripple pattern causes the interferometer to difference simultaneously one part of the sky against another, allowing extremely sensitive observations. The pattern is also ideal for measuring ripples in the cosmic microwave background, or what cosmologists call the angular power spectrum of the microwave background. The many pairs of telescopes in an array, such as the Degree Angular Scale Interferometer, each measure a particular ripple pattern. Outputs from the two multipliers fully determine both the amplitude and phase of the ripple. Once the amplitudes and phases are measured, the ripple patterns, like a hologram, can be used to generate a picture of the sky (also see Figure 5, Figure 6 and Figure 7).
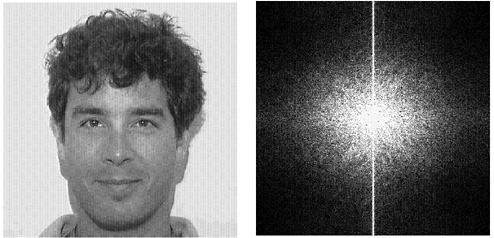
FIGURE 5 Left panel: A picture of colleague, José, shown in the representation that we are all used to seeing. Right panel: An alternative representation of the picture of José where the intensity corresponds to the magnitude of different “ripples” in the picture of José. Position in this representation corresponds to a particular wavelength and direction for a ripple, or wave. This representation is referred to as the Fourier transform of the picture, named after the mathematician who showed that no information is lost by a decomposition into waves. Each wave has an associated phase (not shown) that indicates where its peaks and troughs should be lined up when the waves are added together to reconstruct the original picture. An interferometer measures directly the amplitude and phase of these ripples.
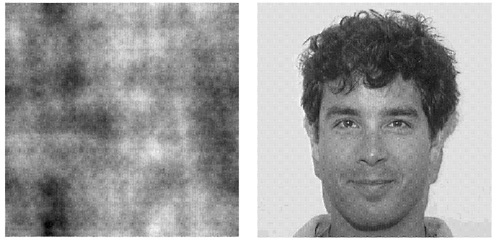
FIGURE 6 Left panel: A reconstruction of the picture of José from the amplitude of the waves in the right panel of Figure 5, but using random phases to align the waves. Right panel: A reconstruction using the correct phase information. Note that both panels have the same power spectrum. The figures clearly show that the power spectrum does not contain all of the information. The phase of a wave, which is measured directly by an interferometer, is just as important as its amplitude.
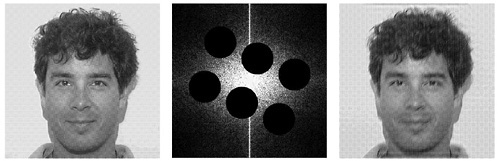
FIGURE 7 Like a hologram, each ripple, or wave, contains information about the entire picture. The left panel is the original picture. The center panel is the decomposition into waves which has then had large sections removed. The right panel is the reconstruction of the picture from the waves represented in the center panel. Note that the basic features remain in spite of the loss of information, illustrating the robustness of interferometry. Imagine the results of such drastic editing of the original photo!
the phase. As illustrated in Figure 6, the power spectrum alone is not sufficient to reconstruct a picture.
The positive and negative series of troughs and peaks of the response of an interferometer lead to exceptional stability and low systematics. A well-designed interferometer can take data for essentially an unlimited time without being limited by systematics; we have observed a single cluster for 14 days to image the Sunyaev–Zel’dovich effect.
INTERFEROMETERS AND COSMIC MICROWAVE BACKGROUND
Imaging the Sunyaev–Zel’dovich Effect
Galaxy clusters are very large containing over a 100,000 times the volume of our galaxy. Even so, a cosmic background photon passing through a cluster has only about a 1 percent chance of suffering an interaction with an electron. The resulting Sunyaev–Zel’dovich effect that we wish to observe is therefore quite weak and extends smoothly over arcminute angular scales. Using standard radio telescopes, it has proved difficult to detect, let alone map, the Sunyaev–Zel’dovich effect.
My collaborators and I decided that the best way to detect and map the Sunyaev–Zel’dovich effect would be to use radio interferometry. It is straightforward to write down the specifications for such an interferometer. Its operating wavelength should be chosen to maximize the Sunyaev –Zel’dovich effect signal (see Figure 3), minimize noise from our atmosphere which increases at short wavelengths, and to minimize emission from galaxies which increases at long wavelengths. A wavelength of about 1 cm is ideal. Once the wavelength is decided, the minimum separation of the telescopes is chosen so that the angle subtended by the cluster (i.e., 1 arcminute) fits well within λ/L (see Figure 4). The telescope diameters must, of course, be less than L. For 1 arcminute and λ equal to 1 cm, a good choice for L is about 6–10 m. So we want an array of roughly 8-m telescopes outfitted with high-quality 1-cm receivers. It should not come as a surprise, because interferometers have traditionally been built for high (arcsecond) resolution, that such an array did not exist.
Arrays with 6-m- and 10-m-diameter telescopes do exist, however. They are used for making arcsecond resolution observations at millimeter wavelengths. By outfitting these millimeter wave arrays with centimeter wave receivers, we created a nearly ideal instrument for detecting and making detailed pictures of the Sunyaev–Zel’dovich effect. We built state-of-the-art low-noise receivers that we mount for roughly a month at a time during the summer on the six 10.4-m telescopes of the Owens Valley
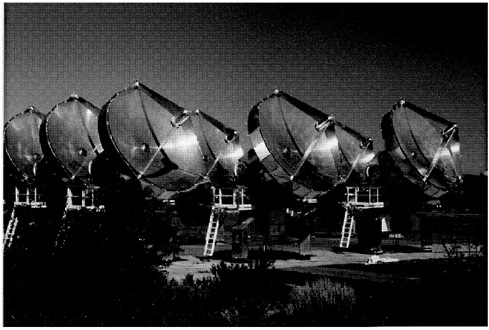
FIGURE 8 The BIMA millimeter-wave array with the 6.1-m diameter telescopes positioned in a compact configuration for observations of the Sunyaev-Zel'dovich effect.
Radio Observatory (OVRO) millimeter array operated by Caltech and on the nine 6.1-m telescopes of the Berkeley Illinois Maryland Association (BIMA) millimeter array. We move the telescopes as close as possible when observing the Sunyaev–Zel’dovich effect to obtain the best match between the resolution of the interferometer (λ/L; see Figure 4) and the roughly 1-arcminute angle subtended by a distant galaxy cluster. A photograph of the BIMA array taken while we were observing the Sunyaev–Zel’dovich effect is shown in Figure 8. The telescopes are close enough to collide! Luckily, safeguards in the control software and collision sensors installed on the telescopes have prevented such a disaster, although we have had several scares.
Our interferometric Sunyaev–Zel’dovich effect system works beautifully. We have gone beyond the point of just trying to detect the Sunyaev–Zel’dovich effect to producing high-quality images. In Figure 9 we show our image of the Sunyaev–Zel’dovich effect overlaid on the x-ray emission for the cluster CL 0016+16. In Figure 10 we demonstrate the independence of the Sunyaev–Zel’dovich effect on the distance to the cluster. Shown are three clusters with distances spanning nearly a factor of 5. The observed Sunyaev –Zel’dovich effects are about the same, whereas the
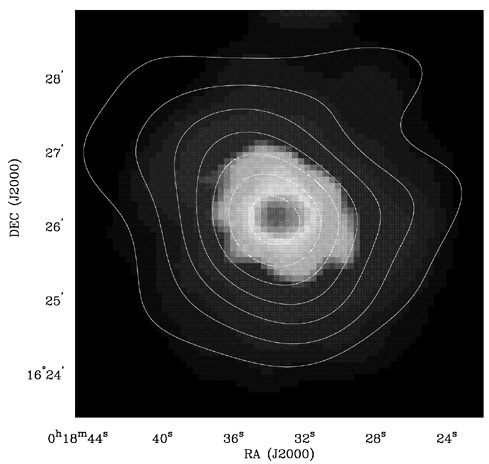
FIGURE 9 An image of the Sunyaev–Zel’dovich effect (contours) and x-ray emission (false color) due to the hot gas associated with the galaxy cluster CL 0016+16. The radio observations of the Sunyaev–Zel’dovich effect were obtained using the BIMA and OVRO interferometric arrays. The x-ray observations were obtained with the ROSAT satellite. The Sunyaev–Zel’dovich effect is contoured in steps of negative intensity. Because of the Sunyaev–Zel’dovich effect, the cluster, which has a luminosity roughly a trillion times the Sun, appears as a hole in the microwave sky.
observed x-ray flux of the most distant cluster is roughly a 100 times weaker than the flux of the closest cluster.
With quality data for more than 20 clusters, we are now in the enviable position of using the Sunyaev–Zel’dovich effect to estimate the Hubble constant and the mass density of the universe. Our preliminary analyses give a value of about 65 km s−1 for the Hubble constant.
For objects as massive as galaxy clusters, it is reasonable to expect
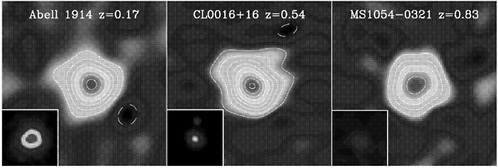
FIGURE 10 Images of the Sunyaev–Zel’dovich effect toward clusters at different distances. The images are shown in false color with contours overlaid—the same contour levels are used for each image. Red indicates lower temperatures. The redshift z of the cluster is proportional to its distance. The corresponding x-ray emission observed toward each cluster is shown in the inset of each panel with the same false-color x-ray intensity scale used for each cluster. In contrast to the Sunyaev–Zel’dovich effect, the x-ray flux from these clusters exhibits a strong decrease with redshift (distance).
that the ratio of ordinary matter to the mysterious dark matter would be a fair representation of the value for the entire universe. Using our Sunyaev–Zel’dovich effect data for several clusters gives a ratio of 12 percent, where we have assumed the Hubble constant is 65. Amazingly, nearly 90 percent of the mass in the universe is in a form that physicists still do not understand!
Cosmologists do, however, know the mass density of ordinary matter in the universe. Taking our value of 12 percent for the mass fraction of ordinary to total matter and the value for the mass density of ordinary matter, we have solved for the total mass density of the universe. Our preliminary results suggest that the total mass density of the universe is roughly a third of the critical value for which the universe neither expands forever nor collapses in upon itself.
Cosmologists use the terms “open” for a universe that expands forever, “closed” for a universe that ultimately collapses, or “flat” for one that is balanced between the two. These terms are from the vocabulary that describes the mathematical curvature of the universe. The mass density of the universe, in principle, could be any value. It is interesting, then, that our measurement is so close to the critical value for which the universe would be flat. It is all the more remarkable, because the standard inflationary model for the origin of the universe, which many theorists believe must be correct, predicts that the universe is precisely flat.
The curvature of the universe is also dependent on Einstein’s cosmological constant; for a flat universe, the mass density and the cosmological constant added together equal the critical value. Therefore, the value we derive from our Sunyaev-Zel’dovich effect data may not determine the ultimate fate of the universe. As discussed above, however, the location of the peaks and valleys in the power spectrum of the cosmic microwave background anisotropy (Figure 2) can be used to measure curvature of the universe, and therefore determine a combination of the mass density and Einstein’s cosmological constant. With our Sunyaev–Zel’dovich-effect-derived mass density and the power-spectrum-derived value (which we hope to determine in the next few years), we may be on the verge of showing that the cosmological constant is far from being Einstein’s greatest blunder, as he referred to it, but is instead perhaps one of his most important contributions to modern cosmology.
We plan to continue improving our Sunyaev–Zel’dovich effect system and refining our analyses. My expanded group includes researchers involved in the next generation of x-ray satellites. We have only begun to scratch the surface of the deep pool of Sunyaev –Zel’dovich effect science. We are particularly excited about the possibility of using our instrument to survey large portions of the sky. With the current sensitivity of our system, such a survey will take 30 days or more to survey a square degree
with a noise level of 40 µK. To obtain our goal of a 10-µK, noise level would take 16 months of solid observing. Considering that we only have one or two months of time available per year, this goal is clearly not feasible without improving our system dramatically. Such an improvement is possible, however. If we were able to correlate the full 10-GHz band-width of our existing receivers, we would increase the imaging speed of our system by over a factor of 12 and would be able to obtain our goal in roughly one month! Such a survey would provide a clear view of the evolution of structure in the distant universe.
Taking a Snapshot of the Early Universe
Building on the success of our Sunyaev–Zel’dovich interferometry program, my collaborators and I at the University of Chicago are building a novel interferometer for imaging cosmic microwave background anisotropy on intermediate angular scales. The instrument, the Degree Angular Scale Interferometer (DASI), consists of 13 telescopes. The most novel aspect of the instrument are the telescopes. In fact, they are not at all like conventional telescopes, and we usually refer to them as horns. An exploded view of one of the DASI “telescopes” is shown in Figure 11; the diameter of the aperture is only 20 cm. At the operating wavelength of 1 cm, the horn is sensitive to a circular patch of sky with a diameter of 3 degrees. The 13 horns are actually mounted on a single platform, which is only 1.6 m in diameter. The 78 telescope pairs provide sensitivity to ripples on the sky on angular scales from 0.20 to 1.3 degrees (the corresponding l range is 140 to 900). The DASI team is collaborating with a
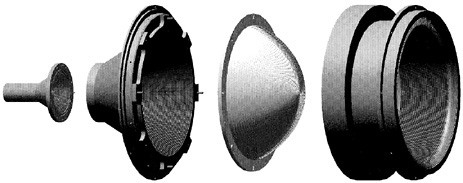
FIGURE 11 An exploded view of one “telescope” of the DASI. The telescope is unique in that there are no mirrors, and a large lens is used to improve its efficiency. The diameter of the aperture is only 20 cm, which allows simultaneous imaging of a 3-degree-wide patch of sky.
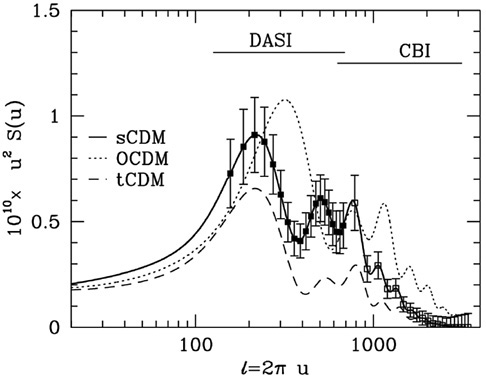
FIGURE 12 The expected sensitivity of DASI, as shown by the computed error bars, after 6 months observing from the South Pole, covering 1,000 square degrees. The solid curve is the microwave power spectrum predicted for the standard model and a flat universe, the dotted curve for an open model, and the dashed curve is the prediction for a model with a slope in the initial power spectrum of density fluctuations. DASI will be able to image one-quarter (π steradians) of the entire sky. Also shown is the expected sensitivity of the CBI for a comparable time at its planned site high in the Chilean Atacama desert.
Caltech-based team, which is building a similar interferometer, the cosmic background imager (CBI). This imager uses 1-m telescopes to cover the angular range 4-20 arcminutes (range 630-3500). We designed the instruments to provide detailed pictures of the cosmic microwave background and to characterize completely its angular power spectrum. Figure 12 shows the predicted uncertainties obtained with the instruments after 6 months of observing. Both instruments will be located at high dry sites to minimize atmospheric noise; the DASI will start observing from the South Pole in November 1999, and the CBI will begin observing from the high Chilean Atacama desert near the beginning of 1999.
Both instruments employ the same type of low-noise receivers as used
in our Sunyaev–Zel’dovich effect experiment. The large number of telescope pairs (78) and the superb atmospheric conditions allow the instruments to make high-quality images of a small portion of the sky in a single day. After several months, a detailed snapshot of the early universe and a measurement of the microwave background power spectrum will be produced (see Figure 12). This snapshot will be used to test entire classes of cosmological models. And, by simply locating the position of the first peak in the microwave background power spectrum, we will determine the sum of the mass density of the universe and Einstein’s cosmological constant to better than 10 percent in only 6 months. As the instruments increase the size and quality of the snapshot, we will steadily increase the precision of all the cosmological parameters.
FUTURE PROPECTS
The promise of using the cosmic microwave background radiation to explore the early universe and to unlock the secrets of the origin of structure in the universe was immediately appreciated when Arno Penzias and Robert Wilson discovered the cosmic microwave background over 30 years ago. Since that time, theorists have shown exactly how the information can be encrypted in the background radiation as small differences in the brightness of the background from one part of the sky to another. And experiments have shown that these fluctuations in the otherwise smooth background, of an order of a few hundred-thousandths, are indeed tiny. Only now, however, are we developing sufficiently sensitive and carefully optimized instruments with which to unveil the wealth of information contained in these small fluctuations. I firmly believe that dedicated, specially designed interferometers will play a major role in this exciting field, and I plan to continue to play an active role in their development and use.
What have we learned so far? From our Sunyaev–Zel’dovich effect data we have a completely independent measurement of the expansion rate of the universe, the Hubble constant, which also gives an age of the universe of the order of 10–15 billion years. We have also used the data to measure the ratio of ordinary mass in the universe, the stuff we are made of, to the total mass of the universe. We find that of the order of 90 percent of the universe is made out of some other form of matter. Not only does the universe not revolve around us, but it is made up of completely different material.
What is the ultimate fate of the universe? Our Sunyaev–Zel’dovich effect data tell us that the mass density is about 30 percent of the critical value for which the universe balances between expanding forever or collapsing upon itself. Why is the mass density so close to the critical value, when, in principle, it could have been any value at all? Why not a billionth or 10 million? Perhaps it indicates that the inflationary model for the origin of the universe is correct, as this model predicts that the curvature of the universe is flat, which is only the case for a universe finely balanced between expanding forever or eventually collapsing.