Carving Our Destiny: Scientific Research Faces a New Millennium (2001)
Chapter: Currents of Change: The Ocean's Role in Climate
13
Currents of Change: The Ocean’s Role in Climate
Stefan Rahmstorf
Climate Research Department, Potsdam Institute for Climate Impact Research, Potsdam, Germany
In 1751, the captain of an English slave-trading ship made a historic discovery. While sailing at latitude 25°N in the subtropical North Atlantic Ocean, Captain Henry Ellis lowered a “bucket sea-gauge,” devised and provided for him by a British clergyman, the Reverend Stephen Hales, down through the warm surface waters into the deep. By means of a long rope and a system of valves, water from various depths could be brought up to the deck, where its temperature was read from a built-in thermometer. To his surprise Captain Ellis found that the deep water was icy cold.
He reported his findings to Reverend Hales in a letter: “The cold increased regularly, in proportion to the depths, till it descended to 3900 feet: from whence the mercury in the thermometer came up at 53 degrees (Fahrenheit); and tho’ I afterwards sunk it to the depth of 5346 feet, that is a mile and 66 feet, it came up no lower.”
These were the first ever recorded temperature measurements of the deep ocean. And they revealed what is now known to be a fundamental and striking physical feature of all the oceans: Deep water is always cold (Warren and Wunsch, 1981). The warm waters of the tropics and subtropics are confined to a thin layer at the surface; the heat of the Sun does not slowly warm up the depths as might be expected.
Ellis’ letter to Hales suggests that he had no inkling of the far-reaching significance of his discovery. He wrote: “This experiment, which seem’d at first but mere food for curiosity, became in the interim very
useful to us. By its means we supplied our cold bath, and cooled our wines or water at pleasure; which is vastly agreeable to us in this burning climate” (Ellis, 1751).
In fact, Ellis had struck upon the first indication of the “thermohaline circulation,” the system of deep ocean currents that circulates cold waters of polar origin around the planet, often referred to as the “Great Ocean Conveyor Belt.”
But it was not until several decades later, in 1798, that another Englishman, Count Rumford, published a correct explanation for Ellis ’ “useful” discovery: “It appears to be extremely difficult, if not quite impossible, to account for this degree of cold at the bottom of the sea in the torrid zone, on any other supposition than that of cold currents from the poles’, and the utility of these currents in tempering the excessive heats of these climates is too evident to require any illustration” (Thompson, 1798).
Now, 200 years later, using the most advanced supercomputers our century can provide, we are beginning to understand the intricate dynamics ruling the complex system of deep ocean circulation and, what Rumford found so evident, the role it plays in climate. It is a subject that may be of fundamental importance to our future.
AN OCEAN IN THE COMPUTER
My work is climate modeling; I simulate the currents of the world ’s oceans in a computer and investigate their transport of heat across the globe. The model I most frequently work with was developed at the Geophysical Fluid Dynamics Laboratory at Princeton and is used by many oceanographers around the world; I have adjusted it to best suit my experiments. The surface of the planet is divided into grid cells. My present model has 194 cells in longitude, 96 in latitude, and 24 vertical levels: altogether almost half a million grid points. At each point where there is ocean, the temperature and salinity of the water and the velocity of the currents are computed using basic hydrodynamic and thermodynamic equations for each time step that has been programmed. If the model is run for, say, 100 simulated years, roughly 100,000 time steps would be required. If this is multiplied by the number of grid points, it becomes clear why even the fastest supercomputers available will take quite some time to perform the huge calculations. In fact, to reach a steady state (or equilibrium) in the ocean circulation takes several thousand simulated years; so many calculations are necessary that it takes a supercomputer several weeks to perform them.
So what happens when such a simulation is run? First one has to specify a way to calculate the exchange of heat, freshwater (through evaporation, precipitation, and river runoff), and momentum (from the
wind) at the ocean surface. This is called “forcing”—these forces drive the ocean circulation. The model then computes what kind of currents develop in the virtual ocean. The results of such a simulation, with a forcing based on the present-day climate, are illustrated in Figure 1. The computer model has reproduced all the major ocean currents known from shipboard measurements. The Gulf Stream and its extension toward Britain and Scandinavia (illustrated in the top panel) and the southward flow of North Atlantic Deep Water (NADW) out of the Atlantic (in the bottom
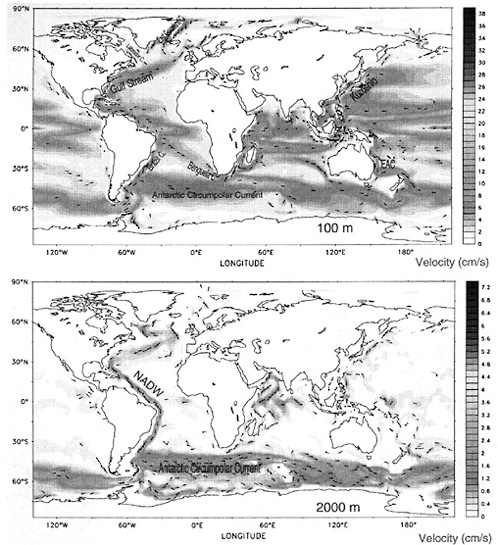
FIGURE 1 Current velocities in centimeters per second (color scale) in the ocean model. Top panel is at 100 m depth; bottom panel is 2,000 m depth.
panel) are of particular importance. These currents work together as a kind of conveyor belt bringing warmth to Europe.
THE CONVEYOR BELT: A CONTROVERSIAL CONCEPT
The concept of an ocean “conveyor belt” was first formed by Broecker (1987, 1991) of Columbia University to illustrate the idea that all the oceans in the world were connected through one coherent circulation system, which transported heat and salt1 between them. Figure 2 shows a version of Broecker’s famous sketch of 1987, depicting the system as a conveyor belt transporting warm water along the surface and cold water back through the depths.
Broecker believed that the global conveyor belt was driven by the atmosphere’s transport of water vapor from the Atlantic basin to the Pacific—water evaporating from the Atlantic and raining down in the Pacific catchment area (see “Driving the Conveyor” below). His theory was that the strength of the conveyor belt flow was proportional to this vapor
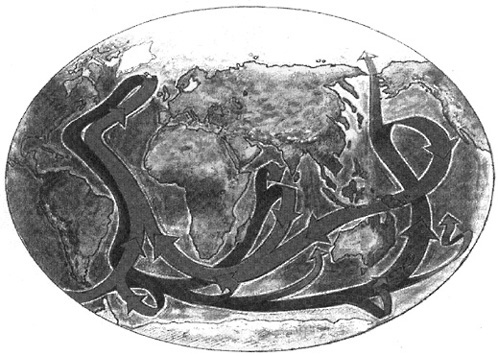
FIGURE 2 The global conveyor belt after Broecker. SOURCE: Adapted from Broecker (1995).
transport. If the vapor transport were reduced (by less evaporation, for example), the entire system would slow down, just as a real conveyor belt does when its power is reduced.
It was a brilliant and provocative idea and “the global ocean conveyor belt” became a standard term for describing world ocean circulation in popular and scientific publications.
Some oceanographers, however, questioned the metaphor and the theory behind it, and in subsequent years a number of research papers have been published that give a more accurate picture of the way the ocean circulation functions. In the work I have been doing since 1991, I found that the circulation loops in the Atlantic and Pacific are only weakly connected and that the oceans do not respond as one system. Within the Atlantic Ocean, however, the circulation loop functions very much like a conveyor belt—warm water is transported north by a system of currents including the Gulf Stream to near Greenland, where it drops down to become the cold NADW flowing south (Figure 3).
And if extra freshwater is added in the computer model to the region near Greenland (as could happen with extra rainfall or the melting of ice in the real world), the whole system slows down as one, from the North Atlantic Drift down to the Benguela Current of the South Atlantic.
THE ROLE OF THE ATLANTIC CONVEYOR IN CLIMATE
The cold water discovered in the subtropical Atlantic by Ellis in 1751 was, as Rumford theorized, brought there by a current that had originated in the polar region. Temperature measurements in the real ocean and computer models show that there is a southward outflow of cold deep water from the Arctic throughout the Atlantic. This cold water is replaced by warm surface waters, which gradually give off their heat to the atmosphere as they flow northward toward Europe. This acts as a massive “central heating system” for all the land downwind.
The heat released by this system is enormous: It measures around 1015 W, equivalent to the output of a million large power stations. If we compare places in Europe with locations at similar latitudes on the North American continent, its effect becomes obvious. Bodö in Norway has average temperatures of −2°C in January and 14°C in July; Nome, on the Pacific Coast of Alaska at the same latitude, has a much colder −15°C in January and only 10°C in July (Weaver, 1995). And satellite images show how the warm current keeps much of the Greenland-Norwegian Sea free of ice even in winter, despite the rest of the Arctic Ocean, even much further south, being frozen.
If the Atlantic conveyor belt circulation is switched off in a computer model, a different climate forms in the virtual world. There is little change
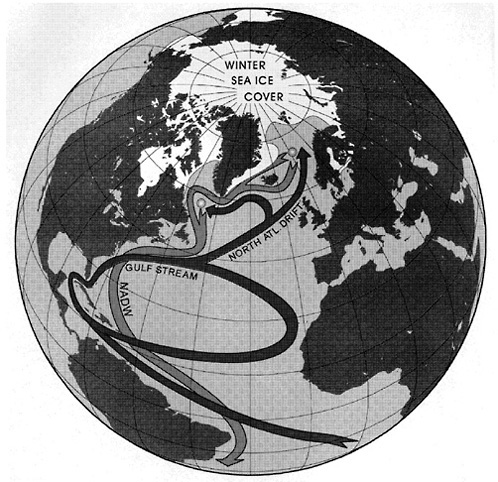
FIGURE 3 The Atlantic conveyor belt. Orange circles show the regions of convection in the Greenland–Norwegian and Labrador Seas. The outflow of NADW is shown in blue.
in ocean temperatures near the equator, but the North Atlantic region becomes much colder than it is in reality, and the South Atlantic and other parts of the Southern Hemisphere become warmer. This experiment reveals that the Atlantic circulation moves heat from the South Atlantic below the equator across the tropics to the North Atlantic—the heat is not coming directly out of the tropical region.
So Rumford did not get it quite right: The ocean currents do not seem to do much to cool the “excessive heats” of the tropics, although they certainly play an important role in preventing excessive cold in Britain, Scandinavia, and the rest of Northern Europe.
Some of my colleagues have compared climates with and without the Atlantic conveyor belt in computer simulations using coupled ocean-at-mosphere models (Manabe and Stouffer, 1988). These models show that, without the ocean heating, air temperatures would cool by up to 10°C averaged over a year. The chill is greatest near Scandinavia, but extends to a lesser extent across Europe and much of the Northern Hemisphere.
DRIVING THE CONVEYOR
What drives this remarkable circulation? Why does it occur only in the Atlantic, and why is it that the Pacific and Indian Oceans do not have similar heating systems?
In general, ocean currents are driven either by winds or by density differences. Density in the ocean depends on temperature and salinity, and the Atlantic conveyor is a thermohaline circulation (from the Greek words for “heat” and “salt”). When surface waters become dense enough, through cooling or becoming saltier (or a combination of these two factors), a mixing process takes place in which they sink and form deep water.
Count Rumford understood the basics of this mechanism and reported them in his 1798 publication. The deep mixing takes place because of convection; seawater from near the surface sinks down 2 km or more and then spreads at this depth. This is called “deep-water formation. ”
Because this convection takes place only at specific sites, the image of a plug hole in a bathtub is suggestive. At certain locations on the broad expanse of ocean, the surface waters descend into the deep. They do not exactly gurgle down the plug hole, rather they subside so slowly that it is hard to measure directly. In the present climate, deep water forms in the Greenland-Norwegian Sea and in the Labrador Sea (marked by orange circles in Figure 3). There are no deep convection sites in the North Pacific. The only other place where the global ocean’s deep water is formed is near the Antarctic continent in the Southern Hemisphere.
At these convection sites, the water has become dense enough to push away the underlying deep water and sink because it has cooled—cold water is denser than warm. In the Indian Ocean, the water is too warm to sink; the ocean’s basin does not extend very far north of the equator.
But cold is not the only factor. The waters of the North Pacific are cold, but even as they approach the freezing point they still lack the density that would enable them to sink down and thus drive a conveyor flow. This is because the North Pacific is less salty than the North Atlantic (around 32 compared with 35 parts per thousand in the northern North Atlantic), and salt is the second crucial factor in the density of ocean water.
In fact, the high salinity of the North Atlantic is the key to understanding how the thermohaline circulation works. For decades, two theories were widely accepted as explanations of what drives the flow of NADW. Both were frequently cited. At first glance they seem complimentary, but my work led me to examine them more closely.
Broecker reasoned that the global conveyor (see Figure 2) was driven by evaporation. He explained the salinity difference between the Atlantic and the Pacific as a result of excess freshwater evaporating from the Atlantic basin and being blown across into the Pacific catchment by easterly winds—what is known as vapor transport. In other words, water was evaporating from the Atlantic leaving its salt behind and raining back down as freshwater which diluted the Pacific.
So in Broecker’s theory, the relatively high salinity of the North Atlantic water, coupled with the cold temperatures, created the convection “pumps ” that drove the global conveyor. The salinity budget of the oceans was balanced by the conveyor transporting fresher Pacific water back to the North Atlantic.
If, the theory continues, the conveyor were to grind to a halt for some reason, then the salinity of the North Atlantic would start to rise, as evaporation would continue to leave salty water behind, although the inflow of fresher water would have stopped.
Systematic computer simulations by myself and other oceanographers found flaws in this theory. We discovered that the present thermohaline circulation could be maintained without any airborne transport of water vapor from the Atlantic to the Pacific, and even with a weak reverse vapor transport. And, surprisingly, within such a scenario the North Atlantic continued to be saltier than the North Pacific.
Finding the explanation for this paradox was simple: The conveyor does not need evaporation in order to operate; it transports salty water into the North Atlantic by itself, thus maintaining the high salinity there. It is a classic chicken and egg situation—the Atlantic conveyor functions because salinity is high in the North Atlantic, and salinity is high in the North Atlantic because the conveyor is functioning. It is a positive feedback that makes the conveyor a self-sustaining system.
This peculiar property had already been examined much earlier, in 1961, by the famous American oceanographer Henry Stommel in a simple but powerful conceptual model. One consequence of the positive feedback was that if it was somehow interrupted, the conveyor belt would grind to a permanent halt. In the absence of ongoing circulation, the North Atlantic’s salinity would drop so much that no more deep water could form.
After I had been working on the thermohaline circulation for some time, I realized that there was a contradiction between these two theo-
ries—Broecker’s evaporation-driven conveyor and Stommel’s self-maintaining conveyor—which meant that both could not be true. Each was widely cited in oceanographic literature, both were accepted as valid, and yet on closer examination I found that they were mutually exclusive.
In Broecker’s theory, the direction of the freshwater transport by the Atlantic conveyor was northward; in Stommel’s theory it was southward. This is why, if the circulation halted, the salinity of the North Atlantic would increase according to Broecker, but decrease according to Stommel. Obviously this result was directly dependent on whether the upper, northward flowing branch of the Atlantic conveyor (see Figure 3) had a higher or lower salinity than the outflow of NADW.
Existing hydrographic measurements from the real ocean were unable to resolve this issue because of the complicated salinity layering of the Atlantic waters. Above the layer of NADW, northward flowing layers exist with both higher and lower salinities. From the data, it is not possible to identify which of the near-surface currents belong to the thermohaline conveyor and which are simply driven by winds. So I set the computer model to the task.
Through a series of model experiments, I found that in the model world the conveyor belt transport of freshwater is indeed southward and that salinity decreases throughout most of the Atlantic when the conveyor is shut down. There was net evaporation from the Atlantic in my model, as in the real world, but this had little effect on the functioning of the conveyor. Also, the freshwater loss to the atmosphere was not balanced by the conveyor, but rather by wind-driven, near-surface currents.
In this sense, Stommel’s theory was the more accurate of the two. But his work, done in 1961, had been based on a very simple “box” model of a theoretical thermohaline circulation. It was limited to one hemisphere and driven by the density difference between the water of the tropics and that of the high latitudes. Model experiments and observational data demonstrate that the real Atlantic does not work like this, although some of my colleagues have tried to argue for a theory of two more or less disconnected cells, one in each hemisphere.
My model results showed the existence of one cross-hemispheric conveyor belt in the Atlantic, transporting heat from the Southern to the Northern Hemisphere, which is driven by the density differences between North and South Atlantic water. If the northern part of the Atlantic thermohaline circulation is slowed down by adding virtual freshwater to the model ocean, the whole system slows down, including the Benguela Current off South Africa in the Southern Hemisphere.
To overturn established beliefs is not always easy. In 1995, I wrote a paper pointing out the inherent contradiction in the two major thermoha-
line circulation theories and arguing for a southward direction of freshwater transport. I submitted it to a highly respected scientific journal. My work was given the thumbs down: One of the two reviewers criticized my results for not being new, saying everyone in the field had known all this for a long time; the other wrote that my results were wrong and flying in the face of all evidence. This outcome all too accurately emphasized the problem—fortunately I was able to publish elsewhere (Rahmstrof, 1996).
UNSTABLE CURRENTS
There is another crucial difference between the two views of the conveyor. A circulation driven by evaporation and high-latitude cooling would be very stable. But Stommel’s self-maintaining conveyor depends on precariously balanced forces: Cooling pulls in one direction, while the input of freshwater from rain, snow, melting ice, and rivers pulls in the other. This freshwater threatens to reduce the salinity and, therefore, the density of the surface waters; only by a constant flushing away of the freshwater and replenishing with salty water from the south does the conveyor survive. If the flow slows down too much, there comes a point where it can no longer keep up and the conveyor breaks down.
A look at a simple stability diagram shows how this works (Figure 4). The key feature is that there is a definite threshold (labeled S and called a “bifurcation”) for how much freshwater input the conveyor can cope with. Such thresholds are typical for complex, nonlinear systems. This diagram is based on Stommel’s theory, adapted for the Atlantic conveyor, and on global circulation model experiments (Rahmstorf, 1995).
Different models locate the present climate (P) at different positions on the stability curve—for example, models with a rather strong conveyor are located further left in the graph and require a larger increase in precipitation to push the conveyor “over the edge” (transition a in Figure 4). The stability diagram is thus a unifying framework that allows us to understand different computer models and experiments.
My experiments also revealed another kind of threshold where the conveyor can suddenly change. While the vulnerability in Stommel ’s model arises from the large-scale transport of salt by the conveyor, this new type of threshold depends on the vertical mixing in the convection areas (e.g., Greenland Sea, Labrador Sea). If the mixing is interrupted, then the conveyor may break down completely in a matter of years, or the locations of the convection sites may shift. Such a shift in convection sites is indicated as transition b in Figure 4.
Although the effect on climate of a cessation of Atlantic circulation had come to be generally understood, until 1994 no one had considered
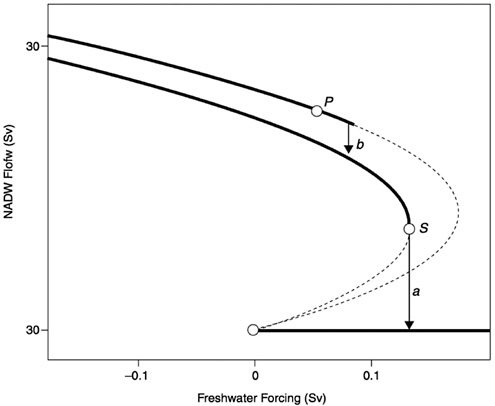
FIGURE 4 A schematic stability diagram shows how the flow of the conveyor depends on the amount of freshwater entering the North Atlantic. Units are 106 m3/s on both axes.
the possibility of the shifting of convection sites (or “convective instability” as it is now known), let alone the consequences. That year, quite by chance, I discovered that such an occurrence would have a major effect: Regional climates would change radically in less than a decade.
The paper I published on the subject (Rahmstorf, 1994) struck a chord with paleoclimatologists, scientists who had been seeking explanations for the evidence they had found of abrupt climatic changes taking place thousands of years ago (see “The Past: A Roller Coaster Ride” below).
The speed at which these convective shifts take place is frightening. With Stommel’s theory, once the freshwater threshold has been exceeded, the conveyor circulation slowly grinds to a halt over a century or more. But if a convective instability is triggered, within some few years the conveyor stops transporting heat to the far north.
We do not yet know where these critical limits of convection are or
what it would take to set off such an event. Current climate models are not powerful enough to resolve such regional processes clearly.
ICY TIMES
By looking back at past climates we can understand a little more about the effect of the North Atlantic circulation. The ancient icecaps of Greenland and Antarctica have preserved a unique and detailed record of the history of climate, layed down in year after year of snow that never melted, going back at least 100,000 years. Several cores have been drilled right through these mountain-high icecaps in recent years (Figure 5), and from the exact composition of the ice and enclosed air bubbles in different layers much information about the past climate can be recovered. Other valuable records of the past are contained in sea corals, tree rings, and in ancient pollen (pollen even reveals information about vegetation cover at different times in the planet’s history). And cores taken from the sediments at the ocean bottom give a wealth of clues about past ocean circulation and climate.
From these data, it has been possible to reconstruct conditions at the
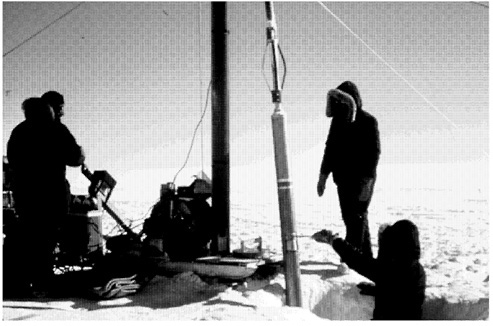
FIGURE 5 Scientists drilling an ice core in Greenland. Photo courtesy of Richard B. Alley, Pennsylvania State University.
height of the last Ice Age (the so-called “Last Glacial Maximum”) around 21,000 years ago. Huge ice sheets, several kilometers thick, covered the northern parts of North America and Eurasia. In Europe, ice covered all of Scandinavia and reached down as far as Berlin. As far south as France, cold, dry steppe extended across the continent, stalked by mammoths.
Evidence points to the ocean’s thermohaline circulation being quite different from today. Reconstructions show that the Atlantic conveyor did not nearly extend as far north. The convection regions were south of Iceland, and the water sank only to intermediate depths. The bottom of the North Atlantic was instead filled by waters of Antarctic origin which were pushing in from the south (Labeyrie et al., 1992).
In 1997, my colleagues and I at the Potsdam Institute for Climate Impact Research in Germany performed a computer simulation of the Ice Age climate (Ganopolski et al., 1998) (Figure 6), including both atmospheric and oceanic circulations—the first time such a simulation has been performed to our knowledge. Our model produced exactly the ocean circulation changes described above, and we could establish that the changes in the conveyor had a significant effect on Ice Age temperatures. We found that with the changes in the ocean circulation, the Northern Hemisphere was on average 9°C colder in the Ice Age than today, but if we experimented by deliberately preventing the ocean circulation changes, the temperatures were only 6°C colder.
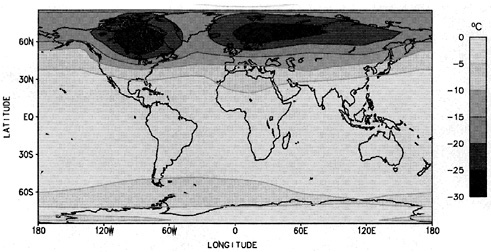
FIGURE 6 Cooling of surface temperatures at the height of the last Ice Age during Northern Hemisphere summer, as simulated by the Potsdam coupled climate model. SOURCE: Ganopolski et al. (1998).
It is a combination of such model simulations and further detective work on ice cores and similar data that will ultimately lead to a detailed understanding of the forces shaping the climate of our planet.
THE PAST: A ROLLER-COASTER RIDE
The coldness of the last Ice Age was punctuated by many sudden and erratic swings in the climate. The Greenland ice cores show sudden temperature shifts of about 5°C that happened over about a decade, but last for centuries (Figure 7). Many of these events were not local to Greenland, but had repercussions that have been detected as far afield as South America and New Zealand. When we look back over the history of climate, the past 10,000 years (the Holocene) appear as an unusually stable period. It is probably no coincidence that this is the time in which agriculture was invented and human civilization developed.
The cause of these rapid fluctuations puzzles paleoclimatologists. Subtle and gradual changes in the energy that the Earth receives from the Sun, due to wobbles in our orbit (the so-called Milankovich cycles), are the major reason for Ice Ages and other climate changes of the past. But why does the climate not respond in a smooth, gradual way? This is one of the greatest riddles in climatology.
Sediment cores from the sea bottom reveal that ocean currents were changing in sync with the weather over Greenland and other land areas. The shifts in ocean circulation (through the convective instability mechanism) together with instabilities in the large ice sheets may well be the culprits responsible for these erratic climate changes.
Even the relatively stable climate of the Holocene has not been an entirely smooth ride for humanity. An as yet unexplained cold snap oc-
Permission to display this figure electronically was not received.
FIGURE 7 Temperature record of the past 100,000 years, derived from a Greenland ice core.
curred around 8,000 years ago—perhaps also caused by a change in ocean circulation. The warm “Holocene Optimum” followed—around 6,000 years ago—when the Sahara was green and dotted with lakes, like the one at the mouth of the “Cave of Swimmers” made famous by the book and film The English Patient.
Our own millennium started with the “Medieval Optimum,” in which Vikings settled now icy Greenland and grapevines grew in Yorkshire, England. Then, from about 1550 to 1850, the so-called “Little Ice Age” took hold of Europe: Temperatures were around 1°C below those of the present century. The winter landscapes of Pieter Brueghel, depicting the Dutch countryside frozen over and blanketed with deep snow were painted during this period. Lake Constance, Western Europe’s largest lake, regularly froze over completely—something that has happened only once this century, in 1963. In England, festivals took place on the ice of the River Thames. The Great Frost of 1608 was later described in a novel by Virginia Woolf2: “Birds froze in mid-air and fell like stones to the ground. At Norwich a young countrywoman started to cross the road in her usual robust health and was seen by the onlookers to turn visibly to powder and be blown in a puff of dust over the roofs as the icy blast struck her at the street corner. The mortality among sheep and cattle was enormous. It was no uncommon sight to come upon a whole herd of swine frozen immovable upon the road.”
What role the ocean circulation played in these climate changes is as yet unclear. New data from sediment cores (Bond et al., 1997) strongly suggest that these events were part of a more or less regular 1,500-year-long cycle, involving major shifts in the North Atlantic ocean currents. With recent advances in computer modeling and the increase of data available on past climates, we may be on the verge of developing an understanding of such cycles.
THE FUTURE: RISK OF A SEA CHANGE?
The climate of the next century will be defined by an ongoing increase in the concentration of carbon dioxide and other greenhouse gases in the atmosphere. All climate models are predicting that this will lead to a substantial temperature increase (around 2°C by the year 2100) (Houghton et al., 1995). The hydrological cycle of evaporation and precipitation is also expected to increase, as in a warmer world the atmosphere can hold more moisture.
How will the Atlantic Ocean circulation respond to these changes? Given its past instability, this is a very real concern. A warmer climate will mean less cooling and more precipitation, possibly also extra freshwater from a melting of the Greenland ice sheet. The delicate balance in
which the present conveyor operates may cease to exist. Model scenarios for the twenty-first century consistently predict a weakening of the conveyor by between 15 and 50 percent of its present strength (Rahmstorf, 1999).
What has not yet been determined is whether sudden temperature shifts like those seen in the Greenland ice core could take place. Due to their limited resolution, the current generation of climate models cannot properly represent the processes that might lead to these sudden changes (i.e., the convective instability). We do not yet know if or when we would cross a threshold in the climate system that could dramatically change our future (Rahmstorf, 1997). It is a risk we cannot afford to ignore.
NOTES
1. Strictly speaking, there is no net transport of salt between oceans in equilibrium but rather an exchange of salinity (salt concentration), which is a quantity routinely measured from ships.
2. Woolf s description in Orlando is based on a contemporary report by Thomas Dekker.
REFERENCES
Bond, G., W. Showers, M. Cheseby, R. Lotti, P. Almasi, P. deMenocal, P. Priore, H. Cullen, I. Hajdas, and G. Bonani. 1997. A pervasive millennial-scale cycle in North Atlantic Holocene and glacial climates. Science 278:1257–1266.
Broecker, W. 1987. The biggest chill. Natural History Magazine 97:74–82
Broecker, W. S. 1991. The great ocean conveyor. Oceanography 4:79–89.
Broecker, W. 1995. Chaotic climate. Scientific American 273:44–50
Ellis, H. 1751. Philosophical Transactions of the Royal Society of London 47:211–214.
Ganopolski, A., S. Rahmstorf, V.Petoukhov, and M. Claussen. 1998. Simulation of modern and glacial climates with a coupled global model of intermediate complexity. Nature 391:350–356.
Houghton, J. T., L. G. Meira Filho, B. A. Caleander, N. Harris, A. Kattenberg, and K. Maskell. 1995. Climate Change 1995—The Science of Climate Change. Cambridge, U.K.: Cambridge University Press.
Labeyrie, L. D., J. C. Duplessy, J. Duprat, A. Juillet-Leclerc, J. Moyes, E. Michel, N. Kallel, and N. J. Shackleton. 1992. Changes in the vertical structure of the North Atlantic Ocean between glacial and modern times. Quaternary Science Reviews 11:401–413.
Manabe, S., and R. J. Stouffer. 1988. Two stable equilibria of a coupled ocean-atmosphere model. Journal of Climate 1:841–866.
Rahmstorf, S. 1994. Rapid climate transitions in a coupled ocean-atmosphere model. Nature 372:82–85.
Rahmstorf, S. 1995. Bifurcations of the Atlantic thermohaline circulation in response to changes in the hydrological cycle. Nature 378:145–149.
Rahmstorf, S. 1996. On the freshwater forcing and transport of the Atlantic thermohaline circulation. Climate Dynamics 12:799–811.
Rahmstorf, S. 1997. Risk of sea-change in the Atlantic. Nature 388:825–826.
Rahmstorf, S. 1999. Shifting seas in the greenhouse? Nature 399:523–524.
Stommel, H. 1961. Thermohaline convection with two stable regimes of flow. Tellus 13:224–230.
Thompson, B. 1798. Pp. 237–400 in The Complete Works of Count Rumford. 1870 reprint ed., Boston, Mass.: American Academy of Sciences.
Warren, B.A., and C. Wunsch. 1981. Deep circulation of the world ocean. Pp. 6–40 in B. A. Warren, ed., Evolution of Physical Oceanography. Cambridge, Mass.: MIT Press.
Weaver, A. 1995. Driving the ocean conveyor. Nature 378:135–136.