Carving Our Destiny: Scientific Research Faces a New Millennium (2001)
Chapter: Putting the Genome on the Map
8
Putting the Genome on the Map
Wendy Bickmore
Medical Research Council, Human Genetics Unit, Edinburgh, Scotland
Imagine an essay 5,000 times longer than this one. You probably would not be able to pick it up, let alone want to read it, because you would have trouble finding the 80,000 words embedded within its seemingly unintelligible list of 3,000 million characters. This is the scale of the human genome “map,” an international project to determine the sequence of bases (characters)—A, C, G, or T—of DNA that are strung out along the 23 pairs of our chromosomes and to find the position of the genes (words) within this list. The genes are the parts of the sequence that encode the instructions for making all of the proteins necessary for life, growth, and development. Storing, accessing, and making any sense out of a map of these proportions will require considerable ingenuity, but the completed human genome map will be a great achievement and will make an unparalleled contribution to our understanding of normal biology as well as to our understanding of disease.
Most of us are familiar with the concept of maps in our everyday lives and the diversity of information that they can, and should, communicate. They enable us to navigate our way around new and often complex landscapes. Hence, a good map is more than just a list of place names (or bases). A good map conveys information about different types of environment, about topological features of the landscape, and about its important structural and functional features. Such maps, full of colors and shapes, are a pleasure to behold and can conjure up an immediate mental
picture of what the landscape really looks like. If the map of the human genome were to include this richness of information, in addition to the raw DNA sequence (Figure 1), how much more would we know about our genomes and the way that they work?
Our genetic inheritance is more than just the DNA that we get from our parents. Genetic information is encoded as DNA intimately wrapped up with many layers of protein in the form of microscopic objects: chromosomes. Gene sequence spells out the raw ingredients of the recipe to make protein, but the chromosome itself dictates whether the page of the recipe book is opened to be read in the first place.
The average human chromosome contains 100 million base pairs of DNA that would be 5 cm long if stretched out. To fit the 2-m worth of DNA from all our chromosomes into the nucleus of the cell, which typically measures only one-thousandth of a centimeter across, the DNA must be folded up tightly and precisely. This is brought about by the DNA interacting with specific proteins to form chromatin— the stuff that chromosomes are made of. Two-thirds of the mass of the chromosome is made up from proteins—the DNA that is usually the focus of so much of our attention in current maps is a minority component. Information is embedded within the details of this packaging and can modify how genes are expressed, how the genome is copied, and how it is segregated to new cells. A more complete map of the genome needs to be able to describe these facets of the chromosome.
GENES IN AN OCEAN OF DNA
Developing a more functional map of the genome has been the objective of my research for the past six years. Ironically, interest in this goal was sparked by my own efforts to develop a conventional one-dimensional map of a small part of the human genome. I wanted to use this to identify the position of genes involved in the development of a particular genetic disorder.
Genes account for only a small proportion of our DNA sequence, and there can be extremely long stretches of DNA between genes. Locating the position of genes within this sea of DNA can feel like trying to find the proverbial needle in a haystack. Fortunately, in the genomes of mammals, half of the needles have beacons on them—termed CpG islands—which allow us to home in on the genes. CpG islands are found at the beginning of 60 percent of our genes, and they have sequence characteristics that make them stand out from bulk DNA. DNA-cutting enzymes that recognize the types of sequence found in CpG islands can therefore be used to pinpoint the position of some genes. What we noticed about the distribution of these cutting sites in our simple map was that they
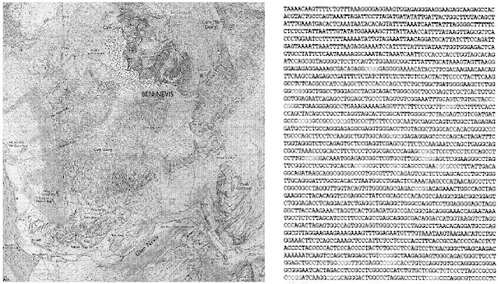
FIGURE 1 What type of map do we need to describe our genome? The map on the left shows the lie of the land around Ben Nevis—Scotland ’s highest mountain. Contour lines pick out precipitous cliffs and gentle slopes. The composition of different parts of the environment —rock, water, forest—are indicated through the use of symbols and colors. As well as a list of place names, this map also includes key structural and functional landmarks such as parking lots and rescue posts that are key to the way this landscape functions. The map on the right describes the DNA sequence of a part (0.000075 percent) of the human genome located on chromosome number 11. This sequence is part of the coding region for a gene called PAX6. Adapted from Bridger and Bickmore (1998, Figure 1).
were not uniform. In some places they were relatively frequent (every few hundred thousand base pairs apart), whereas in other parts of the map they were separated by millions of base pairs of DNA. This was not a random pattern—the areas where archipelagos of clustered islands were occurring with high frequency were at particular recognizable regions (bands) of chromosomes.
Chromosomes (from the Greek words meaning colored body) were first identified in the nineteenth century with the light microscope after staining with colored dyes. It is apt that the use of color permeates the way in which we analyze the chromosome and its structure today. In the early 1970s it was noticed that some stains produced reproducible bar codes on human chromosomes. These banding patterns enabled each chromosome to be unambiguously identified, and structural abnormalities in chromosomes could then be linked with particular diseases. This has been critical in our understanding of many genetic disorders. However, more fundamentally, these patterns suggest that there is an inherent organization of the genome at a level that affects both the structure and the behavior of the chromosome. We can crudely categorize chromosome bands into two types, “R” and “G” bands. From our elementary map it seemed that genes were clustering into the R type of chromosome band. This might have been a peculiarity of the small part of the genome that we were focused on at the time, rather than a generality. Therefore, we set out to discover whether this observation was true of the whole human genome: Are most of our genes concentrated into the parts of chromosomes that are visible to us down the microscope as R bands, and, conversely, are they thin on the ground in the G bands?
To answer this question we turned to a procedure known as fluorescence in situ hybridization (FISH). In FISH the chromosomal location of a particular DNA sequence is visualized by tagging it with molecules that are excited by, and emit, light of different wavelengths and hence different colors. The labeled DNA is then allowed to find its cognate site on chromosomes that have been spread out on glass slides, and the location of the colored “hybridization signal” is determined relative to the chromosome banding pattern using a fluorescence microscope. The labeled DNA molecules that can be used as probes in FISH can be chosen to light up not only single points on the chromosome, but also large regions of the chromosome, or even whole chromosomes. Probes that produce such broad brush strokes have appropriately been called chromosome “paints.”
To find out where along the chromosome genes with CpG islands were to be found, we isolated all the islands from the human genome and labeled them en masse so that they would appear in red (Figure 2).
The pattern of red paint we saw by annealing human CpG islands to chromosomes dramatically showed us that genes are not uniformly dis-

tributed either along, or between, our chromosomes. The areas of red paint did relate to the chromosome banding patterns; and not only did the density of genes, as measured by the intensity of the red paint, vary dramatically along the length of a single chromosome, but it also varied between different human chromosomes. Most striking were the differences between two small chromosomes—chromosomes 18 and 19. These are estimated to have similar amounts of DNA in them—approximately 70 million base pairs apiece. They also appear physically to be of the same size (human chromosomes are numbered in order of decreasing size). In our experiment, chromosome 19 was painted bright red whereas there was a distinct lack of red paint on chromosome 18. Our FISH experiment, which was designed to illuminate the gross organization of sequence within the genome, is being substantiated by the Human Genome Project itself as more and more individual genes (with or without associated CpG islands) are assigned to human chromosomes. In the databases at the moment, there are more genes localized to the small chromosome 19 than to any other chromosome in the karyotype barring the largest—chromosome 1. On the other hand, chromosome 18 has the smallest number of genes assigned to it of any chromosome except for the small Y sex chromosome. Our findings also allowed us to better understand why, excluding anomalies of the X and Y sex chromosomes, it is that only three human trisomies (additional copies of chromosomes 13, 18, or 21) commonly survive to birth. These are not the three physically smallest (in bases) chromosomes, but they are three chromosomes that our experiments showed as being poorly populated with CpG islands and that have small numbers of genes assigned to them. Trisomies of small but CpG island and gene-rich autosomes, such as chromosomes 19 and 22, are not generally seen as liveborne, and we assume that this is because their high gene concentration makes the presence of an extra copy incompatible with embryonic and fetal development and survival.
Our map of the human genome had already taken on new perspective: We could view the genome as broadly two different environments—one that is rich in genes and the other a gene desert. In some cases these two environments could be found intermingled within the same chromosome. In more extreme cases whole chromosomes seemed to be composed almost entirely of one or other type of environment. Does this represent a unique way of organizing a large and complex genome, or is it something that is found in other organisms and that might indicate that there are functional constraints on where genes can be placed on chromosomes? Studies of CpG island distributions in other vertebrates suggest the latter. The same high concentration of CpG islands into a limited number of distinct chromosomal locations is observed in the genomes of chickens,
mice, and pigs. There appears to be a very good reason why genes prefer to hang around together in large groups.
COPYING THE MAP: WHERE TO START AND WHEN TO BEGIN
Before every cell divides to form two new daughter cells, the enzymatic machinery of the cell nucleus accomplishes a remarkable feat. Every single base of DNA in the genome is duplicated with precious few mistakes. This replication of the DNA takes place during a period of the cell cycle known as the S (synthesis) phase, which lasts for approximately eight hours in human cells. All of the DNA on the chromosomes must be copied accurately, but must be copied once only. The process of DNA replication must therefore be carefully controlled. Any mistakes —base changes, omissions, or repetitions—that are made, and that are not corrected, will be passed on to daughter cells as mutations in the DNA. The consequences of this can be genetic disease, genome instability, or tumor formation.
DNA replication begins from sites on chromosomes termed replication origins. If the replication of an average human chromosome were to start from a single origin in the center of the chromosome, it would take 17 days and nights to be completed. Clearly, more than one replication origin per chromosome is needed. An average chromosome may use about 1,000 origins to ensure that replication is finished within the duration of the S phase. At present, we have no way of picking out where the replication origins are by simply looking at the DNA sequence—and I believe that we may never be able to. Considerable evidence points toward the position of replication origins being encoded within the structure and shape of the chromosome, rather than in its sequence per se. Therefore, we will have to look to this level of genetic information in order to describe the position of replication origins on our map.
Not all replication origins fire off at the same time. DNA replication is under temporal control; some parts of the chromosome are consistently copied earlier than others. Evidence for this could be seen in our CpG island FISHing experiment (Figure 2) where the green banding pattern was generated by labeling the DNA that was copied during the last half of the S phase (late-replicating DNA). The red and green colors on these chromosomes do not overlie each other (we would see yellow if they did). Parts of the chromosome that have the highest concentrations of genes (red-painted regions) have their DNA copied in the early stages of the S phase (they do not take up any green color). Conversely, the DNA that is copied later (green) does not contain many genes (it is not red). For our
two contrasting human chromosomes (18 and 19), the former is green, the latter is red. The same relationship between the presence of a lot of genes and the time of DNA replication is conserved in other vertebrates. Why might this be so?
During the S phase it is not only the DNA sequence that must be copied, but also the chromatin structure. The mechanism for making an accurate copy of the DNA molecule was readily apparent within the elegant structure of the DNA double helix itself. The same cannot be said for the replication of chromatin structures. We do not begin to understand how the different types of packing of DNA with protein, at different sites within the genome, can be copied and inherited (as epigenetic information) from one cell to the next, but we know that process takes place and that it is vital for the correct development of the animal. It is plausible that the time at which the DNA, and its associated chromatin, is copied may play some role in this. The spectrum of protein components that may be available to be chosen from to form new chromatin may be quite different at the early stages of the S phase than at the later stages. Hence, the very time of DNA replication could influence chromatin structure. This would ensure that the gene-rich compartments of the genome would become packed into a different sort of chromatin than the genepoor (late-replicating) bits, compounding the differences in the environment of these two compartments of the genome. Our comprehensive map of the genome should include an element to describe the time of replication of different parts of the sequence.
GETTING ALL WRAPPED UP
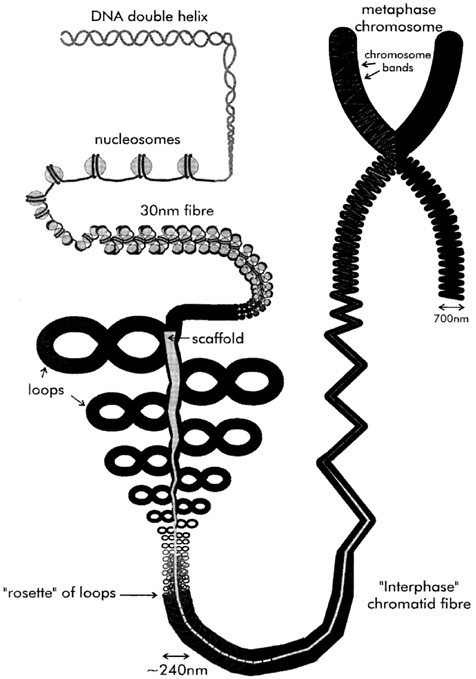
The organization of the DNA sequence into chromatin is hierarchical: One layer of packing is superimposed upon another (Figure 3). What this compaction brings about is the shortening in length of the naked helix by a factor of 10,000-fold. At the foundation of this hierarchy is the wrapping of the DNA sequence, in short lengths, around proteins called histones. This forms a series of beadlike structures (the nucleosomes). The beads on a string are then further folded to form the basic chromatin fiber, with a diameter of three-millionths of a centimeter (30 nm) and a compaction of 100-fold in length over the starting DNA molecule. Histones are some of the most conserved proteins in evolution, reflecting their central role in underpinning all subsequent layers of chromosome packing. Despite this conservation of their basic sequence, there is a lot of variation built into the histones by chemical modification. So far, the modification that has received most attention is the addition of acetyl (CH3COO) groups—histone acetylation. Addition of this seemingly innocuous chemical group to the ends of the histones has a dramatic effect on the structure of the result-
ant nucleosomes; the DNA associated with acetylated nucleosomes is much more accessible to other proteins and enzymes than is unacetylated chromatin.
In an experiment analogous to FISH, but using tagged antibodies to specific proteins as probes rather than DNA sequences (immunofluorescence), it was found that the most acetylated forms of chromatin in the human genome correspond with the R-band regions (i.e., the gene-rich, early-replicating compartment of our map). So, domains where genes are located are wrapped into the type of chromatin that is potentially most accessible to enzymes that are needed to transcribe gene sequences into the messages that eventually make proteins. The large parts of the genome with fewer genes are packed into more impenetrable chromatin. Predictably, human chromosomes 18 and 19 appeared unacetylated and highly acetylated, respectively, in this experiment.
Why bother to make this distinction in chromatin? Why not just package the whole genome into accessible acetylated nucleosomes? First, it may help sequester the gene-barren DNA away from proteins whose job it is to find genes and so limit their search area. It also opens up the opportunity to put a few special genes, whose inappropriate expression might be detrimental, into an environment that ensures their silence until the appropriate moment. It also adds another layer of control to gene expression that can operate over large chromosome areas rather than on a gene-by-gene basis. There is one particularly striking example of this: The silencing (inactivation) of genes on one of the two X chromosomes of females. This process is thought to ensure that there are equal doses of gene products from X-linked genes in males (who only have one X chromosome) and females (who have two). Once the X inactivation process has begun, early in the development of female mammals, the first detectable change in the chromosome is that its time of replication becomes late. Then the chromatin loses its histone acetylation, and many, but not all, of the genes on the chromosome fall silent. This might be a good example of a case in which a change in replication timing forces an alteration in the protein composition of the chromatin. Other late-replicating regions of the genome, that also lack acetylation, are completely gene-free areas where the DNA consists of simple short sequences that are reiterated over and over again. Some of these sites, though not coding for genes, may have very important roles in maintaining the structure and integrity of chromosomes. In the conventional human genome map, these regions will look very monotonous—the same sequence motif of a few hundreds of bases is reiterated again and again over many millions of bases—but in our version of the map their structure and topology will be important and distinctive components of the genome landscape. In particular, the centromere—the site on the chromosome that ensures the accurate segrega-
tion of the genome into daughter cells—is composed of this sort of repeating DNA and is also late replicating and is not acetylated. Its more compact chromatin structure may be critical in providing solid bedrock for a part of the chromosome that has to endure strong mechanical forces as part of its job. Each chromosome’s worth of a double-stranded DNA molecule is called a chromatid, and by the time the cell has replicated the whole genome and is ready to divide, there are two sister chromatids per chromosome that are held together at the centromere. The centromere’s functions are both to hold onto the two sisters until the right moment before letting go, and also to interact with the cagelike apparatus called the spindle that ensures each new daughter cell receives only one chromatid from each pair of sister chromatids—one accurate genome ’s worth of DNA. During cell division, chromosomes jostle in the middle of the spindle until one chromatid of a pair attaches to one side (pole) of the cage, whereas the other attaches to the opposite pole. Forces from the spindle poles pull on the chromatids, like a perfectly balanced tug of war. The all-clear is then given for the sister chromatid attachments at the centromere to be broken and for the chromatids to be pulled by motor proteins toward opposite poles of the spindle. If any part of this process—the making or breaking of attachments —ever goes awry, the consequences are dire. Cells in our bodies with too many or too few chromosomes can progress to form tumors. If the same thing happens in the formation of sperm or egg, the resulting fetus—if it develops at all—may carry a trisomy and suffer severe defects.
There are specific enzymes whose job it is to put acetyl groups onto histones—the acetyl transferases—and those whose job it is to undo this—the his tone deacetylases. The overall level of acetylation in chromatin is the playoff between these two opposing activities. If this balance were altered between early and late S phase, then it is easy to see how the time of replication might influence the histone acetylation level of a particular part of the genome. Nor does this train of events seem to be all one way: The histone acetylation level of chromatin may have some influence on when a piece of the genome is replicated. We can experimentally interfere with the normal balance of histone acetylation using chemicals that specifically inhibit histone deacetylases. We had been studying the replication behavior of parts of the human genome that are said to be imprinted. That is, the decision as to whether genes in these chromosome regions will be expressed depends on which parent the chromosome was inherited from. Some genes are only ever expressed when they are inherited from fathers, and for other genes it is the maternally derived copy that is active. This is not due to any difference in the DNA sequence per se between genes inherited from either parent: The conventional map of the human genome could look the same for the genome you inherited
from your mother and for the one that you got from your father, but the readout from each map will be very different. It is important that you do inherit one chromosome copy and its genes from a sperm and one from an egg. If you do not, and through a mistake in the partitioning of chromosomes you happen to get both of your copies of chromosome number 11 from your father, you will develop abnormally. Parts of your body will be overgrown and you will be at risk of developing certain cancers. How do the chromosomes in the cells of our bodies still remember which parent they originally came from so many cell divisions ago? Because we know that the memory is not in the DNA sequence, it must be imposed epigenetically. Some of the memory lies in the chemical modification (by methylation) of C residues in the DNA sequence. The pattern of methylation can be accurately copied during DNA replication. However, we also provided evidence that part of this memory is in the histone acetylation state of chromatin. We observed that imprinted parts of chromosomes are also replicated at different times, depending on the parental origin. We calculated this difference in time to be less than one hour—a much more subtle difference in timing than that seen between the gene-rich and the gene-poor domains along chromosomes (several hours). We found that we could wipe away this memory if we stopped the histone deacetylases from working (the parental copy that had been the later replicating one caught up with the earlier replicating one). Most excitingly, in collaboration with two groups in Cambridge, United Kingdom, we found the same pattern of synchronous replication (but in the absence of any experimental interference with acetylation), at regions that should have been imprinted, within the genomes of individuals who had all the clinical symptoms of an imprinting defect. These individuals looked as though they had got two copies of chromosome 11 from their fathers by mistake, but they had not. They had inherited one paternal and one maternal copy of chromosome 11. What must have been wrong in these individuals is that the maternal copy of the chromosome had forgotten where it had come from and so incorrectly expressed genes that should normally only be read from a paternal chromosome 11. The methylation pattern of the chromosomes looked normal. Could the underlying imprinting defect in these individuals be a problem with the pattern of histone acetylation?
FOLDING LANDSCAPES
The interaction of DNA with histones is far from the end of the story as far as the chromosome is concerned. A further tenfold to a thousand-fold of packing still has to take place (Figure 3), and how this is achieved is a matter of contention. A growing consensus is that the chromatin fiber is organized into a series of loops, which radiate out from a group of pro-
teins collectively known as the chromosome scaffold (Figures 3). The loops are probably wound up on themselves, like twisted rubber bands, in the final fully condensed form of the chromosome. Use of the term scaffold immediately conjures up an image of a structural element providing a framework for the underlying form, and indeed the chromosome scaffold may serve no purpose other than to aid in the spatial management of the genome and to add rigidity to the chromosome. However, I find it an appealing idea that the topological constraint of DNA into loops, anchored at their bases, should naturally organize the genome into functional units. What might these units be?
The internal architecture of the chromosome can be revealed experimentally by biochemical extraction of proteins from the chromosome. This reveals the residual scaffold of proteins at the core of the chromosome and running along the length of the chromosomes. The main proteins in this structure are enzymes that are capable of either disentangling strands of DNA or of coiling, folding, and condensing chromatin— all sensible activities for a central element involved in organizing the chromosome and in separating its sister chromatids ready for cell division. In these partially unraveled chromosomes, the loops of stripped chromatin spread out from the scaffold to a far greater extent than can be seen in native chromosomes. We reasoned that if such a deconstructed chromosome could still be used in FISH experiments, then, because we had preserved some of the two-dimensional structure of the chromosome, we would be able for the first time to see some of the topology of the DNA sequence within the chromosome. This was indeed the case: The winding path of long stretches of the human genome could be traced using tags of different colors (Figure 4). Specific places along the DNA sequence could be mapped as being close to the scaffold at the center of the chromosome. Other sequences were exposed on the chromosomes’s surface. At the chromosome scaffold we saw that the DNA sequence is bent sharply so that these sites are in the bottom of steep-sided valleys of chromatin, and the sequences at the apex of the loops are on the hilltops of the genome.
Like a reflection in a lake, the topology of one DNA molecule was mirrored in its sister. This implies that the folding of the genome is copied just as the sequence is copied. How this can be brought about is beyond the limits of our current knowledge. What was most intriguing about our observation was that the places on the chromosome where we knew origins of replication were located were in the valley bottoms close to the chromosome scaffold. The frequency with which the hills and glens occurred in the chromosome appeared to be quite regular—the troughs were every few hundred thousand bases so that the rolling hills of the
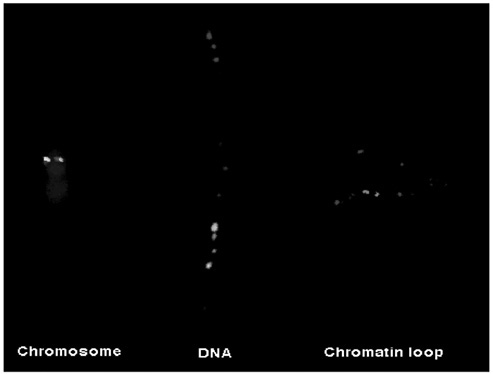
FIGURE 4 The first two-dimensional map of the human genome? The three images are from a FISH experiment in which the same two DNA probes were used. The first—500,000 bases in length—was labeled in red; the green probe is 40,000 bases long and is located within the sequence covered by the first probe. When these two probes are hybridized together to a fully condensed chromosome (blue), the DNA packing is so tight on both sister chromatids that the signals from the two probes are superimposed on each other in tight spots. At the other end of the spectrum, when the two probes are hybridized to naked DNA, from which all chromatin has been removed, the signal is a long line of red signals with the green signal part way along this line (central image). On the right, the probes have been hybridized to stripped chromosomes in which only the scaffold remains. The topology of this part of the genome can now be resolved. The part of the sequence associated with the scaffold is halfway along the red signal and is sharply bent. The green signal is halfway up the slope made from a chromatin loop. Adapted from Bridger and Bickmore (1998, Figure 1).
genome are all of about the same height. This frequency is surprisingly similar to that of replication origins, and other organisms in which the valley periodicity is different from that of our own genome have paralleled changes in replication origin frequency. We may have found a signature in the topology of the genome that identifies origins of replication.
There was one exception to this vista of rolling hills throughout the
genome, and that was at the position of the centromere. Even though the simple DNA sequences at each human centromere extend over many millions of bases—enough to make several hills’ worth of chromosome loops—we could not see any. This entire DNA was constrained tightly to the chromosome scaffold. Is this another example of structural rigidity being built into the centromere through an unusual chromatin structure? We also saw another unique topological feature at the centromere that appears to relate to centromere-specific functions. At all other sites in the genome that we looked at, the DNA molecules of the two sister chromatids were close together but were clearly physically separate. However, at the centromere we could see strands of DNA tangled up in between the two sisters. Remembering that one of the functions of the centromere is to hold sister chromatids together until the right time, we thought that this entangling of centromeric DNA might be part of the molecular glue holding the sisters together. There seems to be no other part of the genome in which the relationship between genome topology and function is so graphically displayed as at the centromere.
INTO THE THIRD DIMENSION
The map of the human genome described here is growing in complexity and is taking on elements of color and shape. However, it is still a map in a vacuum whereas the genome operates inside a membrane-bound cell nucleus—the central part of the cell in so many ways. Therefore, we need to describe not just how the chromosome looks with respect to its own components, but also the relationship of the genome to the nuclear space. Also, the nucleus itself is not a homogeneous bag. We are increasingly aware that the nucleus is organized into compartments, each with distinct functions. In retrospect, spatial management of the nucleus into compartments is probably the most sensible way to deal with a complex genome and its diverse functions, but it has taken us a long time to come to this realization. This is because, unlike the very obvious compartments in the rest of the cell (cytoplasm) each bounded by membranes, those in the nucleus do not have any very obvious morphological or physical boundaries.
Many textbooks have a lot to answer for in their description of the chromosome inside the nucleus—usually some variation of spaghetti on a plate is common. It is assumed that the DNA molecules of each chromosome are splayed out all over the available space and intertwined with each other. We now appreciate that each chromosome is a rather distinct body, occupying a discrete space or territory within the nucleus—in fact more penne than spaghetti! There is no evidence that any particular chromosome has a definitive address within the nucleus, but rather that there
are preferred locations for certain chromosomes. Probably the best example is five of the human chromosomes (numbers 13, 14, 15, 21, and 22). These are all physically associated with each other because each of them houses copies of the same genes—the ribosomal RNA (rRNA) genes. The RNA made from these genes is an essential component of the cellular machinery that translates conventional RNA messages from genes into protein (i.e., it decodes the genetic code). RNA is processed for this job in the best understood of the compartments of the nucleus—the nucleolus (literally, the little nucleus)—and these five chromosomes congregate around it with their rRNA genes protruding into it. These five chromosomes very well illustrate the concept that DNA sequences that might be far apart in the conventional genome map—even on different DNA molecules —can be physically close in space. This physical closeness also manifests itself through plasticity of the genome in the form of chromosome translocations. Translocations are exchanges of large portions of sequence between different chromosomes so that, for example, part of a sequence from chromosome 1 appears on chromosome 2, and the displaced chromosome 2 material is now on chromosome 1. These sorts of large-scale movements have probably been a major driving force in genome evolution, and they are also a common cause of genetic disease because they involve breaking and rejoining the DNA. If the break occurs within a gene sequence it can prevent the production of the correct protein product from that gene. Alternatively, altered and inappropriate gene and protein function can be formed by the fusion of two gene sequences that were originally on different chromosomes. This underpins many translocations associated with human leukaemias. Given that exchanges of sequence between separate DNA molecules are involved in chromosome translocations, it is not unreasonable to assume that the frequency with which they occur is a reflection of physical proximity of the chromosomes in space (i.e., in the nucleus). In accord with this, the most common translocations in man are those occurring between the rRNA-carrying chromosomes. Can we use the frequencies of other chromosome translocations in the human population to help us build our three-dimensional map of the genome?
Because of their physically similar size but different functional characteristics, we asked what the respective territories of chromosomes 18 and 19 looked like in the nucleus (Figure 5). They were surprisingly different. Chromosome 18 was considerably more compact than chromosome 19, despite their similar DNA content, and they also differed in their relative dispositions. Chromosome 18 was found toward the periphery of the nucleus, and chromosome 19 was located more centrally. Because most of the volume of a sphere is around its edge, chromosome 18 is in the part of the nucleus where the majority of the genome is located. Chromo-
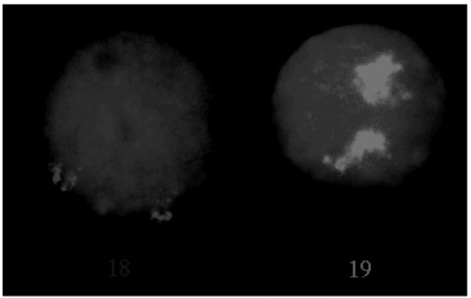
FIGURE 5 Despite the fact that human chromosomes 18 and 19 each contain about 70 million bases of DNA, the two chromosomes 19 (green) adopt much bigger territories within the nuclei of our cells than do the pair of 18s (red). Chromosomes 19 are also more centrally located in the nucleus and make more contacts with the nuclear matrix than do chromosomes 18.
some 19 is in a more confined location and so might be expected to come into proximity with other chromosomes less frequently. As expected, chromosome 18 is found as the partner in translocations to other chromosomes much more frequently than is chromosome 19. Rarest of all are translocations between chromosomes 18 and 19, but we were able to find one example. In nuclei of these cells, the translocation chromosomes took up distinctive orientations so that their chromosome 18-derived material was oriented toward the chromosome periphery whereas their chromosome 19 component pointed to the middle. Each part of the translocated chromosome seemed to know where its real home should be.
If, as we showed in our experiments on the chromosome scaffold, some parts of our DNA sequence are buried in the chromosome interior, whereas other parts are exposed on the surface, then it follows that these two sorts of sequence will see the nucleus and its components in quite different ways. Sequences on the outside will be in intimate contact with the nuclear environment. Sequences in the chromosome core may be quite protected. It has been argued that the various bits of machinery that are needed to express genes and to process their messages are embedded within a network of proteins in the nucleus called the matrix. This matrix
would form channels running between the chromosome territories. Active genes are thought to make more contacts with this matrix and to be exposed on the chromosome surface. The RNA products of these genes can then be transported out of the nucleus and into the cytoplasm through the interchromosomal channels. In accord with this idea we have found that human chromosome 19 makes more intimate contacts with the nuclear matrix than does chromosome 18.
THE GEOLOGY AND GEOGRAPHY OF THE GENOME
To describe our map of the genome we need to understand what all the components of the complex landscape are. Surprisingly we are still a long way from this simple goal. Some of the most abundant nuclear and chromosomal proteins, and some of those with very specific and tractable functions, have been identified. We have recently begun a series of experiments to augment the components list for the chromosome and nucleus. This experiment takes advantage of the fact that we can see chromosomes, and even parts of chromosomes, with the aid of a microscope. We have randomly put into the mouse genome 9,000 bases of sequence that, when inserted appropriately into an endogenous mouse gene, will tag the end of the protein product of that gene with the ability to turn a simple chemical into a blue stain. This stain is deposited in the cell wherever the tagged protein normally resides. In this way we have already identified three new proteins that reside in different parts of mammalian chromosomes. The design of the experiment also allows us ready access to the sequence of the “trapped” host genes. Database analysis with these sequences has exposed our ignorance about the protein composition of chromosomes. The sequences of all three new genes encoding chromosomal proteins match human and mouse DNA sequences that have been recorded as being genes of a previously unknown function. We can now assign a partial function to these genes, based on the location of their protein products within the cell. There is a certain irony to this: We are using the current human genome map and sequence database, and that of the mouse, to describe more fully the human genome! This is a step toward the functional genomics phase of the human genome project. One of the fundamental things about our genome that we are finding out from this experiment is that mammals appear to devote a larger proportion of their genes to the job of making nuclear proteins than do simpler organisms such as yeasts. This suggests to us that much of the complexity of multicellular animals has been brought about not so much by expanding the repertoire of different proteins in the cytoplasm or at the cell surface, but by making the control of gene expression in the nucleus in time and space more exquisite.
MOVING MAPS INTO THE FUTURE
Maps are not very good at depicting the fourth dimension, but we do need to build an element of time into our maps of the future. The genome moves and changes shape through the cell cycle and as cells divide. We have been hampered by the fact that most of the ways that we have looked at the genome depend on killing the very cells we are studying. At last we now have a way of potentially following different parts of the genome in real time and space in living cells. This advance came from the unlikeliest of sources—a jellyfish. A protein found in this animal is naturally fluorescent—it shines out in green when exposed to ultraviolet light. The sequence of the gene encoding this protein was cloned and adapted for use inside mammalian cells (Figure 6). We have begun experiments

FIGURE 6 Living mouse cells in which the centromeric regions of the genome are lit up by green fluorescent protein (green) and the nuclei and chromosomes are stained in blue. In the top left is a cell that is in the process of dividing. The two chromosome sets are migrating toward opposite poles of the spindle (which we cannot see) with the green centromeres clearly leading the way and the rest of the genome following.
targeting green fluorescent protein to different parts of the human and mouse genome. With it we look forward to making bright, multicolored, and multidimensional maps of the human genome in the future.
SUMMARY AND CONCLUSIONS
I have described our vision of the human genome as a complex, heterogeneous, highly organized, and folded but moving environment. Is this just an aesthetic picture of the genome or of an important substance for us to understand? Normal gene expression and development depend on the maintenance of correct nuclear and chromosomal organization. In some instances, this organization must be robust enough to persist through many cell divisions, but in other cases it must be flexible and responsive to signals from both within and outside of the cell. Moving a gene out of its normal context and placing it somewhere else in the genome with a different environment can result in the failure of that gene to work correctly—a so-called position effect. An increasing number of genetic disorders are being shown to result from this type of positional defect, rather than from a mistake in gene sequence. The key to understanding them will lie in chromosome and nuclear structure. Similarly, I have illustrated how key chromosomal functions, such as the ability to replicate and segregate the genome depend on the folding of the DNA sequence. The very integrity of our genome depends on the successful execution of these functions throughout our lifetime—we each produce one hundred thousand million new blood cells and cells to line our gut every day. Defects in the ability to segregate chromosomes accurately through these many divisions and to maintain the integrity of the genome underpin many human cancers, infertility, and developmental abnormalities. There is hope that in the near future many genetic defects in man can be corrected by gene therapy. Normal copies of defective genes will be put into cells on small artificial chromosomes. For this to work to its full potential we need to understand how normal genes are organized and controlled so that we can produce appropriately functioning engineered versions for any particular cell or tissue type. If we better understand the diverse environments of genes in their normal home, we might also be able to tailor artificial chromosomes to have similarly different surroundings and to adopt different positions in the nucleus to suit the needs of different applications.
Determining the sequence of the human genome will be the end of a massive undertaking, but it is only the beginning of a long and winding road in efforts to understand how we evolved, how we develop, and how we maintain and pass on our genomes.