Accelerating Decarbonization of the U.S. Energy System (2021)
Chapter: 2 Opportunities for Deep Decarbonization in the United States, 20212030
CHAPTER TWO
Opportunities for Deep Decarbonization in the United States, 2021–2030
INTRODUCTION
Since the industrial revolution, U.S. greenhouse gas (GHG) emissions have risen steadily in most years, in tandem with an economy fueled by fossil fuels. In recent years, however, the correlation between U.S. economic growth and emissions has weakened. After peaking in 2007, emissions have declined in 7 of the past 11 years, falling 11 percent from 2007 to 2018 (EPA, 2020) even as the economy grew by 19 percent over the same time (OMB, 2020). Nonetheless, emissions are not declining in all economic sectors, and the transition to a zero-carbon economy is not occurring fast enough to meet climate targets.
As discussed in Chapter 1, the United States emits about 6.7 billion metric tons of carbon dioxide equivalent (Gt CO2e) each year, of which roughly 80 percent is carbon dioxide (CO2), with the remainder split between methane (10 percent), nitrous oxide (7 percent), and the fluorinated gases (F-gases) (3 percent). Positive changes in land use and forestry offset about 700 million metric tons of carbon dioxide annually, with the result that net U.S. GHG emissions have hovered around 6 billion metric tons of CO2e over the past several years (2018 data, from EPA, 2020).
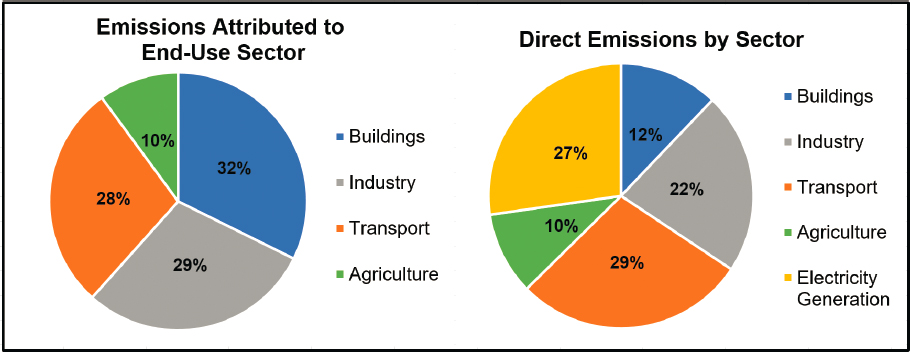
As shown in Figure 2.1, when all GHG emissions, including from electricity generation, are distributed by end-use sector, buildings account for the largest share of gross emissions at 32 percent, followed by industry (29 percent), transportation (28 percent), and agriculture (10 percent). When electricity emissions are considered separately, transportation is the top source of direct emissions (28 percent), followed by the electric power sector (27 percent), industry (22 percent), commercial and residential buildings (12 percent), and agriculture (10 percent) (EPA, 2020).
Electric power generation has been the real workhorse of emissions reductions, with carbon dioxide emissions from electricity generation declining by a third from 2005 to 2019 (EIA, 2020a). This decrease resulted from the replacement of the oldest, least-efficient coal plants with output at plants that burn natural gas (up 15 percentage
points of U.S. market share from 2009), and renewable energy, primarily variable generation from wind (up 5.5 percentage points) and solar (up 2 percentage points) (EIA, 2020b). Rapid declines in power sector emissions have been facilitated by the low cost of extracting natural gas from shale formations and precipitous declines in the cost of new solar photovoltaics (PVs; 89 percent cheaper since 2009) and new wind facilities (70 percent cheaper since 2009) (Lazard, 2019). All three of these trends have been driven by proactive public policy support, although these technologies were nascent and still costly (Trembath et al., 2012; Cox et al., 2015; Nemet, 2019; DOE-EERE, 2020b).
Thanks to ongoing policy support and steady innovation by the private sector (and preferences among many corporations for renewable power), the electricity sector could deliver as much as 90 percent clean electricity by 2035 at rates comparable to today’s levels. Such an outcome could occur by retaining existing hydropower and nuclear capacity, accelerating deployment of wind and solar to displace coal and some gas-fired generation, retaining most existing natural gas power plants for reliability and flexibility purposes, and building out sufficient electric transmission capacity to connect new renewable generation to the grid (Phadke et al., 2020).
However, there are limits to the quantity of cost-effective emissions reductions achievable with mature technologies, even in the power sector. Even taking into consideration the future coal-plant retirements that have already been announced, there could still be significant coal plant capacity online by 2030, unless competitive pressure increases over time (EIA, 2020c). Some of the remaining coal plants are owned by traditional investor-owned and publicly owned utilities, with their coal-plant investment costs included in the utility’s rate base and recovered through retail rates, and are
therefore partially shielded from market forces. Additionally, some coal plants provide local reliability service and may not be able to retire unless their capacity is replaced in the near term with sufficient amounts of other resources (e.g., new gas-fired capacity) capable of providing such services, and it may be difficult, if not impossible, to get approvals for such new fossil units. Also, some existing nuclear reactors have been unable to recover their costs in competitive wholesale markets, in part because current markets do not value the carbon-free attribute of electricity generated from nuclear plants. This is especially true for single-unit nuclear power plants and those that are not supported by state policies (e.g., New Jersey’s Zero Emissions Certificate Law). The retirement of nuclear power plants will need to be offset by additional net-zero carbon generation to continue making forward progress toward decarbonization goals. While natural gas plants can continue to provide reliability and flexibility services in the near term, reaching a 100 percent carbon-free electricity sector will ultimately require deployment of one or more “clean firm” electricity sources, including geothermal energy, biogas, nuclear energy, natural gas with carbon capture and sequestration (CCS), and hydrogen or other carbon-free fuels produced from net-zero carbon processes. Clean firm resources offer the benefit of carbon-free, dispatchable electricity that is available on demand for as long as needed without dependence on weather, and are thus critical complements to weather-dependent variable renewables and energy-constrained electricity storage technologies (Sepulveda et al., 2018).
Emissions from end-use sectors have not declined as rapidly, and in some cases have even increased. Since 2005, direct emissions (i.e., not accounting for electricity consumption) from transportation and industry declined by 5 percent and 2 percent, respectively. Emissions from agriculture and buildings grew by 5 percent and 6 percent (EPA, 2020). Across the end-use sectors, the story has been remarkably consistent: Increased activity in each sector has been partially offset by moderate levels of efficiency improvements, resulting in only incremental changes in emissions. In the transportation sector, growth in vehicle miles traveled has been offset by improved fuel economy. In the industrial sector, increased economic output has been offset by a combination of more efficient industrial processes and structural changes in the economy (e.g., a shift away from energy-intensive manufacturing to the services industry). And in the buildings sector, growth in floor space has been offset by improved efficiencies of buildings and appliances.
Deep decarbonization of the transportation, industry, and buildings sectors will require taking full advantage of a broader suite of decarbonization tools, including (1) accelerating improvement in end-use efficiency to reduce total fuel and materials demand; (2) substituting hydrocarbon fuels with carbon-free electricity; (3) using “drop-in” hydrocarbon fuels with net-zero lifecycle GHG emissions; and
(4) using CCS, enhanced land carbon sinks, or increases in negative emissions technologies (NETs) to capture or offset emissions from residual fossil fuel use.
This interim report focuses on actions to decarbonize the U.S. economy as part of efforts to reduce net GHG emissions—across all gases—to zero by midcentury. Figure 2.2 provides an illustrative path to achieving net-zero emissions, in which gross carbon dioxide emissions from the end-use sectors are almost completely eliminated, and negative emissions technologies are scaled up to offset residual emissions from hard-to-abate energy sectors. Non-CO2 gases and land sinks are discussed in Box 2.1.
Some end-use subsectors will be difficult (or prohibitively expensive) to decarbonize completely by 2050. In particular, aviation and shipping are more challenging to electrify than other transportation sectors, and low-carbon fuels may not reach sufficient scale by midcentury. Many industrial sectors, such as cement, iron, and steel and chemicals manufacturing, pose unique decarbonization challenges—for example, decarbonization options for high-temperature heat (Friedmann et al., 2019) and industrial process emissions (de Pee et al., 2018; Rissman et al., 2020), and sector-specific integration challenges. While technologies exist to cut emissions in these sectors,

they remain at precommercial or first-of-a-kind demonstration stages and require significant improvement in cost and performance to become commercially viable. Proactive innovation and maturation of emerging technologies over the next decade could ultimately supply a range of decarbonization options, even in these difficult-to-decarbonize sectors, but the feasibility of complete decarbonization by 2050 remains uncertain. Negative emissions technologies such as direct air capture and storage (DACS) and bioenergy with carbon capture and sequestration (BECCS) may be needed to offset these residual emissions, and provide additional tools in the decarbonization toolkit. To achieve net-zero CO2 emissions, residual emissions from the energy end-use sectors and negative emissions must sum to zero.
LESSONS FROM DEEP DECARBONIZATION STUDIES AND THE HISTORY OF ENERGY INNOVATION
This report builds on a rich literature of research exploring what a net-zero emissions economy looks like and how to make this transition. Previous deep decarbonization studies vary in their specific technology and policy recommendations, but all share several common core elements. Specifically, the studies promote pathways that combine the following:
- Reducing overall energy demand through increased energy and materials efficiency;
- Decarbonizing electricity generation;
- Switching to electricity and low-carbon fuels in buildings, transportation, and industry (which often involves lower overall energy use in addition to electrification);
- Capturing carbon from residual use of fossil fuels at stationary sources (e.g., fossil power plants, cement, ammonia production);
- Reducing non-CO2 emissions; and
- Enhancing land sinks and negative emissions technologies to offset all remaining direct emissions.
Most importantly, these analyses find that deep decarbonization is technically feasible at relatively low cost.
- Deep decarbonization is technically feasible, but proactive innovation is essential.
Deep decarbonization studies find that reaching net-zero emissions is technically feasible (and relatively low cost) provided that significant proactive effort is invested over the next decade to drive the maturation and improvement of a range of more nascent
technologies and solutions needed to reach net-zero emissions. For example, the International Energy Agency (IEA) finds that nearly half of the global annual emissions reductions necessary to achieve a net-zero energy system by 2050 will likely have to come from technologies that are currently at the demonstration or prototype stage of development but are not yet commercially available (IEA, 2020a). Although nascent, all of these technologies are technically feasible and do not require fundamental scientific “breakthroughs” in order to be deployed (although continued and expanded investment in scientific research can contribute further solutions not yet considered above). The challenge today is to drive the scale-up, maturation, cost reduction, and steady improvement of the full suite of low-carbon solutions. The history of successful energy innovations points the way forward.
Over the past decades, the United States has seen precipitous declines in the cost of five key technologies: wind power, solar power, shale gas, light emitting diodes (LEDs), and lithium-ion batteries for electric vehicles and grid-connected electricity storage (Trembath, 2012; DOE, 2015a). Deployment of these technologies has helped to bring about the bulk of emissions reductions to date and has transformed the economics of decarbonization. In each case, these remarkable trends were influenced by similar processes involving both proactive public investment in research, development, and demonstration (RD&D) and the creation of markets to hasten early adoption and ignite private sector innovation and competition through incentives and standards. Examples include the unconventional gas tax credit for shale gas, production and investment tax credits for wind and solar, utility rebate programs for LEDs, and fuel economy and zero emissions vehicle standards and electric vehicle subsidies for lithium-ion batteries. Thanks to prior decades of investment and policy, all five of these technologies went from expensive “alternative energy” to cost-competitive, mainstream energy choices that are transforming the electricity, buildings and appliances, and transportation sectors and will enable cost-effective and sustained reductions in GHG emissions over decades to come. Now, even as the United States targets deployment of these technologies at scale, the task remains to use this same successful engine of innovation to complete the net-zero carbon toolkit.
- Changes in energy expenditures during a net-zero transition are manageable, and less than historical expenditures.
Under a business-as-usual scenario, U.S. energy consumers across residential, commercial, industrial, and other sectors are likely to spend more than $1 trillion annually on energy services between now and 2050 (EIA, 2019). This level of spending, including investment dollars that underpin it, provides an opportunity to leverage and redirect investment and expenditures toward a clean energy system.
Historical expenditures on energy ranged from 5.5 percent to nearly 14 percent of gross domestic product (GDP) for much of the period from 1970 through 2018 (EIA, 2020d).
Global and domestic spikes in the price of natural gas and oil have historically driven energy expenditures to the higher end of the range (as high as 9.6 percent of GDP as recently as 2008 [EIA, 2020d]). These spikes have exposed U.S. consumers and the economy to risks that could be substantially insulated if the nation were to build a net-zero emissions economy.
Multiple studies estimate that net-zero emissions could be achieved while spending roughly 4–6 percent of GDP on energy in total (Haley et al., 2019; Larson et al., 2020). Energy system expenditures in a net-zero emissions economy are likely to be higher than a business-as-usual pathway—Princeton’s Net-Zero America study (Larson et al., 2020)

estimates cumulative incremental cost (net present value, NPV) of $4 trillion to $6 trillion from 2020 to 2050 relative to a reference case. However, adopting a net-zero economy in the United States would reduce the risks of spikes in fossil markets and reduce the share of economic activity spent on energy services relative to today’s levels, while also eliminating the U.S.’ ongoing contributions to climate change. Estimates of the incremental cost of a net-zero transition have been decreasing over time as the costs of clean energy technologies (e.g., wind, solar, and electric vehicles) have been declining, indicating that innovation can further decrease the costs of the clean transition.
- A net-zero economy requires fundamental shifts in our energy systems. The success of any pathway requires high levels of public acceptance and is bounded by societal constraints and expectations.
Any pathway to decarbonization entails fundamental shifts in the way Americans power their homes and economies, produce goods, deliver services, transport people and goods, and manage public and private lands. This transition is bounded by societal expectations of reliability and costs of energy services and products, considerations of energy access and equity, uncertainties in the pace of technology development and deployment, and regulatory and market barriers to new technologies (EFI, 2019). The energy system has considerable inertia, aversion to risk, and market, finance, and regulatory structures that favor incumbents. Previous experiences have demonstrated that widespread adoption of new technologies is facilitated by perceived value, clear communication, and consumer incentives. For example, much of the success of the ENERGY STAR program can be attributed to its recognizable and easily understandable labeling and purchase incentives, in addition to consumer desire for improved energy efficiency (EPA, 2017). Similarly, Tesla offers vehicles that have both desirable performance features as well as decarbonization benefits. Societal preferences and policy, regulatory, and investment environments will constrain and shape the transition (EFI, 2019). These ideas are further discussed in Chapter 3.
- Long lifetimes and slow stock turnover of energy infrastructure and equipment limit the pace of the transition.
Slow stock turnover in buildings, industrial facilities, and other long-lived assets leaves little room for delay and few opportunities to replace or repurpose existing infrastructure for a low-carbon energy system (Figure 2.4). Deep decarbonization can be achieved without retiring existing equipment and infrastructure before the end of their economic lifetime, which reduces the cost of the transition (Williams et al., 2014). However, long-lived infrastructure, such as power plants, buildings, and many industrial facilities and equipment, has only one natural replacement cycle before midcentury. As these assets are replaced, the new equipment must be consistent with
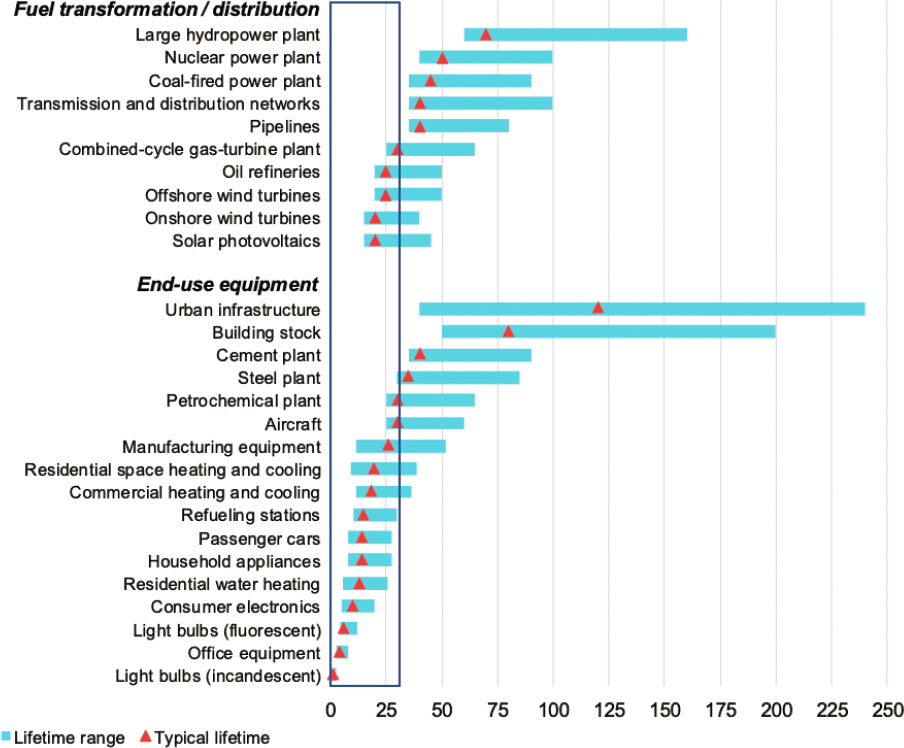
the net-zero transition path in order to achieve net zero at the lowest total cost. Failure to replace retiring infrastructure with efficient, low-carbon successors will either result in the inability to meet emission-reduction targets or require early retirement of the replacement equipment, leading to sunk costs and stranded assets.
Recent studies see the 2020s as the time to build out enabling infrastructure for the net-zero transition and end most new investments in infrastructure to transport fossil fuels (e.g., pipelines) (Williams et al., 2018; Farbes et al., 2020; Kwok et al., 2020). Required infrastructure developments include electric vehicle (EV)-charging
infrastructure for vehicles and long-distance high-voltage transmission lines (Podesta et al., 2019; Haley et al., 2019; Phadke et al., 2020), as well as hydrogen transport and storage infrastructure and with the need to plan for CO2 infrastructure, including pipelines and storage, to come online during the 2030–2035 period (Larson et al., 2020). Efforts to site and permit new infrastructure projects must be initiated soon, given the challenges associated with obtaining permits and the long build-times. For example, new transmission lines, which are needed to connect renewable resources to areas of high electricity demand, can take as long as 16 years, and an average of 8–10 years, to site and permit (Reed et al., 2020).
- Repurposing existing fossil fuel infrastructure can reduce the overall costs of the transition while reducing the potential for stranded assets and workers.
Repurposing existing energy infrastructure could play a key role in enabling a clean energy future by reducing the overall costs of the transition to clean energy, as well as mitigating likely opposition to the needed transition by reducing the potential for stranded investments and workers (EFI, 2019). For example, upgrading or converting natural gas pipelines to carry hydrogen/natural gas blends or 100 percent hydrogen could help retain the use of those pipelines in a low-carbon energy system, avoiding the need for more costly and difficult-to-site new builds while also preventing stranded assets for pipeline owners and preserving jobs in natural gas transmission and distribution utilities. Using residual oil and gas basins for permanent underground storage of carbon dioxide could help oil companies transition into carbon management utilities. Maximizing the use of existing infrastructure would help create greater buy-in for companies and their employees who benefit from the current carbon-intensive economy.
- A net-zero economy is very different from one with more modest reductions. Near-term actions can avoid locking in suboptimal resources.
Reaching net-zero emissions is much more challenging and requires a different set of low-carbon resources than a system with more modest reductions. For example, modest emissions reductions in the power sector (e.g., 50–70 percent CO2 reductions) can be achieved with deployment of natural gas-fired power plants. However, transitioning to near-zero emissions from electricity generation requires replacing the vast majority of fossil fuel power plants or equipping them with carbon capture technologies (Jenkins et al., 2018). Similarly, moderate transportation sector reductions can be achieved by blending conventional biofuels with petroleum-based transportation fuels. However, there is strong agreement in the literature that decarbonizing transportation entails the phase-out of internal combustion engine (ICE) vehicles and
replacement with electric drivetrains, including battery electric and fuel cell vehicles. Policies that produce incremental reductions in emissions without facilitating transformation can lead to technology lock-in and emissions cul-de-sacs that make deep decarbonization by midcentury unattainable (Williams et al., 2014).
- Different decarbonization scenarios reflect different societal preferences regarding the mix of policies and technologies they employ. These scenarios can be assessed by technology mix, cost, resource needs, infrastructure buildout rates, stranded investments, jobs created and lost, societal impacts, and a suite of other factors.
Decarbonization pathways differ in their varied mixes of policies and the central technologies upon which they depend. Some pathways are constructed using least-cost models that deploy or retire energy infrastructure based on the lowest cost of meeting energy demand without emissions. Least-cost models generally employ a broad range of zero-carbon technologies, although such models may not account for permitting and siting, regulatory, financing, or other barriers. Sometimes, lowest-cost pathways from a techno-economic or engineering perspective overlook costly impacts on certain communities or minimize or ignore friction in markets that make it difficult to accomplish those least-cost approaches.
Some other pathways are constructed using a preferred set of technologies, such as 100 percent renewables scenarios (in the electricity sector or economy wide). Still others are developed by envisioning different policy pathways, such as pathways that rely heavily on technology-neutral carbon prices or clean energy standards.
In general, decarbonization modeling finds that scenarios that constrain available technology options result in higher overall mitigation costs than scenarios that are technology neutral. For example, the Intergovernmental Panel on Climate Change (IPCC) Fifth Assessment Report determined that mitigation costs increased by 138 percent in models with no CCS (IPCC, 2014), and Sepulveda et al. (2018) found that decarbonizing the electricity sector is 11 to 163 percent more expensive if all clean-firm power generation technologies such as nuclear, CCS, and bioenergy are excluded.
More difficult to quantify, but just as important, scenarios that remove viable options generally present a greater risk of failure, as they depend more heavily on scale-up of favored technologies without impediment by any social, financial, regulatory, or other barriers. An effective risk-management strategy would hedge against likely failure modes by investing in low-carbon technologies or strategies that may prove unnecessary in a favored scenario, but provide critical alternatives should one or more bottlenecks slow progress.
- There are many pathways to zero emissions, and they share several core features.
All plausible pathways to zero emissions share core features: decarbonizing electricity; switching to electricity and other low-carbon fuels for energy services in the transportation, industry, and buildings sectors; increasing energy efficiency in each of those sectors, in the power sector, and in materials; increasing carbon sequestration, and reducing emissions of non-carbon climate pollutants.
In particular, there is strong agreement among deep decarbonization studies on the following points:
- Energy and materials efficiency: One of the lowest-cost decarbonization opportunities helps to reduce the overall need for low-carbon fuels and electricity, and will continue to be important across all economic sectors through the next 30 years (Williams et al., 2014; White House, 2016).
- Zero-carbon electricity: The electric power sector should cut emissions faster and deeper than other sectors of the economy in order to meet economy-wide targets, owing to the comparative ease and wide range of zero-carbon generation options (Kriegler et al., 2014; White House, 2016; Morrison et al., 2015; Williams et al., 2014; Krey et al., 2014).
- Electrification and fuel switching: Electrification of energy services where possible—for example, space and water heating in buildings, light-duty cars and trucks, and some industrial processes—is key to further reducing the use of fossil energy in the end-use sectors (Kriegler et al., 2014; White House, 2016; Morrison et al., 2015; Williams et al., 2014; Jacobson et al., 2015; Steinberg et al., 2017). Zero- and low-carbon fuels can then meet much of the remaining demand for liquid and gaseous fuels (de Pee et al., 2018; ETC, 2018; Davis et al., 2018).
- CCS: Important for mitigating industrial process emissions, CSS may also be a useful option for the power sector (IPCC, 2018; de Pee et al., 2018; Rissman et al., 2020; Friedmann et al., 2019; ETC, 2018; Sepulveda et al., 2018).
- Non-CO2 gases: These are more challenging to address, although options exist to transition away from hydrofluorocarbons (HFCs) in refrigeration and cooling, and to minimize emissions of methane and nitrous oxide (IPCC, 2018).
- Negative emissions: Enhancing carbon sequestration through land sinks and negative emissions technologies is important to counter residual emissions from non-CO2 gases and hard-to-abate energy sectors that are impossible or prohibitively expensive to eliminate completely (IPCC, 2018; NASEM, 2019).
- Decarbonization studies converge on similar near-term (2021–2030) specific actions needed to put the United States on a path to net-zero emissions by 2050.
Feasible decarbonization pathways are very similar in the first 10 years and diverge only in later years. This first report focuses on near-term priority decarbonization actions for 2021–2030 that are robust across many scenarios or retain optionality in the face of uncertainty about the final decarbonization pathway. The committee’s assessment of decarbonization approaches and pathways from 2021–2050 will be discussed in its second report.
Analyses that model pathways to net-zero emissions in 2050 agree that in the next 10 years, the United States must:
- Improve efficiency of material and energy use by 15 to 19 percent in the industrial sector (Ungar and Nadel, 2019; Larson et al., 2020); 20 to 30 percent in the building sector (Ungar and Nadel, 2019; Mahajan, 2019a); and 10 to 15 percent in the transportation sector between 2021 and 2030 (Larson et al., 2020).
- Electrify energy services that directly use fossil fuels at the rate of 10 to 50 percent of new light-duty vehicles, and heat pump electrification of space heating and water heating in 15 to 25 percent of residences, with all new construction to be fully electric in order to achieve >50 percent of building energy supplied by electricity by 2030 (up from ~44 percent today). Industrial boilers fueled with natural gas are replaced with electric as they retire (Ungar and Nadel, 2019; Mahajan, 2019a,b; Rissman, 2019; Larson et al., 2020).
- Increase clean electricity generation from 37 percent of U.S. electricity in 2020 to roughly 75 percent by 2030 through expanding generation capacity of wind (~250–300 GW) and grid-scale solar (~280–360 GW) (Larson et al., 2020; Phadke et al., 2020). Coal retirements continue or accelerate and contribute ~1 GtCO2 emissions reduction by 2030. These analyses assume that most existing nuclear capacity should be preserved (and/or expanded with upgrades), with studies ranging from 11 GW retirement to 5 GW addition in 2030 (Haley et al., 2019; Larson et al., 2020).
- Build no new long-lived fossil fuel infrastructure (such as pipelines) that cannot be repurposed for use in a net-zero economy, and instead build network infrastructure to enable net-zero energy transition. This assumes that the nation must begin the siting, permitting, and building of high-voltage transmission lines (up to ~60 percent increase in total GW-miles of capacity [Larson et al., 2020]), electric-vehicle charging infrastructure (Haley et al., 2019; Podesta et al., 2019), with ~1–3 million Level 2 chargers and ~100,000 DC faster chargers
- (Larson et al., 2020), and the planning for siting, permitting, and construction of hydrogen storage and transport networks and trunk pipelines for a national CO2 transport system (as much as 12,000 miles by 2030 [Larson et al., 2020]).
- Continue to demonstrate and improve CCS and capture as much as 65 MMT CO2 per year at industrial and power facilities, equivalent to about 5 large cement facilities, 5–10 methane reforming hydrogen production facilities, and 5–10 gas power plants with CCS (Larson et al., 2020). Begin demonstration of direct air capture (DAC), and build out DAC capacity of 9 MMT CO2 per year by 2030 (Larsen et al., 2019).
- Invest in RD&D and create niche markets via incentives and standards to drive innovation, maturation, and improvement of a range of nascent technologies including for hydrogen production from biomass gasification, direct air capture, low-carbon or carbon-sequestering materials, low-carbon synthetic fuels, advanced nuclear, and other low-carbon energy technologies (Haley et al., 2019; Larson et al., 2020; NASEM, 2019; Podesta et al., 2019).
This report builds on the existing, robust literature on possible pathways to deep decarbonization. Metrics for three of the most recent and comprehensive studies are reported in more detail in Table 2.1. The scenarios analyzed in these studies projected energy demand, share of non-emitting electricity, share of electricity in final energy demand, energy productivity, and scale of CCS, land sinks, hydrogen production, impact of non-CO2 gases, building energy intensity, and EV share. Table 2.1 compares both their 2030 and 2050 results. Although these studies and models rely on different assumptions, data, and methods, the comparison in Table 2.1 illustrates their coherence in the first 10 years in particular.
- New open-source energy system optimization models need to be developed to further study transitions, trade-offs, and opportunities in net-zero energy systems.
No model currently exists in the public domain that is capable of modeling all major elements of a net-zero system at the requisite level of detail to analyze: deep reductions in energy demand through efficiency in vehicles, appliances, buildings; flexible central-station and distributed resources (including flexible demand) at dispatch time scales; power flows and realistic expansion of local and high-voltage electricity networks; gas and liquid fuels production, transportation, storage, and consumption; CO2 capture, pipelines, use, and sequestration; and non-CO2 greenhouse gases and carbon sinks. The primary technical impediment to developing such a model is computational constraints, because the model must simultaneously optimize decisions across all sectors, at high temporal resolution (to capture flexibility needs and
TABLE 2.1 Relevant Metrics/Indicators Across Three Separate Decarbonization Studies
| Key Metric | 2015a | 2030 | 2050 | ||||
|---|---|---|---|---|---|---|---|
| Energy Innovationb | Deep Decarbonization Pathways Projectc | Net-Zero America Projectd | Energy Innovation | Deep Decarbonization Pathways Project | Net-Zero America Project | ||
| Final Annual Energy Demand (quads) | 97 | 129 | 80 | 64–67 | 125 | 65 | 50–56 |
| Percent Non-emitting electricity | 18 | 60 | 55 | 62–77 | 100 | 85 | 98–100 |
| Electricity share of final energy demand (percent) | 28 | 44 | 32 | 21–25 | 73 | 60 | 38–51 |
| Energy productivity of GDP ($ economic output per energy) ($ billion/quad)e | 185.5 | 182 | 293 | 350–367 | 272 | 524 | 609–682 |
| Carbon capture (MMT CO2/yr) | 0 | 30.6 | ND | 65–197 | 26 | 775 | 690–1760 |
| Land sinks (MMT CO2/yr) | 760 | 245 | 1050 | 750 | 630 | 1050 | 850 |
| Hydrogen production (quads/yr) | 0.74f | 2.5 | <1 | 0.95–1.9 | 5.5 | <1 | 7–18 |
| Non-CO2 gases (MMT CO2e/yr) | 1264 | 1243 | ND | 1090 | 587 | ND | 1020 |
| Key Metric | 2015a | 2030 | 2050 | ||||
|---|---|---|---|---|---|---|---|
| Energy Innovationb | Deep Decarbonization Pathways Projectc | Net-Zero America Projectd | Energy Innovation | Deep Decarbonization Pathways Project | Net-Zero America Project | ||
| Building energy demand (quads/yr) | 18 | 17 | 16.4 | 18–19 | 11 | 13 | 13–15 |
| EV share of light-duty vehicle stock (percent) | 1 | 47 | 44 | 6–17 | 100 | 100 | 61–96 |
a EIA 2019a, 2020a; EPA, 2019, 2020; White House, 2016.
c Haley et al., 2019. Follows EIA projections for economic growth and increased consumption of “energy services.” Assumes rapid adoption of electrification technologies and high-efficiency technologies where the end-use is already electric (i.e., refrigeration) or where complete electrification is infeasible. Adoption rates of these technologies accelerate through 2030, with the stock of these technologies lagging but making steady progress through 2050. Assumes an enhanced land sink 50 percent larger than the current annual sink. Assumes that nuclear plants already in operation will be operated and retired based on the schedule in the 2017 Annual Energy Outlook.
e Calculated using data from PWC, 2017.
f D. Brown, 2016. U.S. Hydrogen Production—2015. CryoGas International.
NOTE: These studies, while conducted with different modeling frameworks and assumptions, find commonality in the near term and greater divergence in the long term. This comparison illustrates agreement in the literature regarding near-term actions to begin a long-term energy transition and underscores the importance of actions that maintain or enhance optionality in the long term. ND = not determined.
impacts of variable renewable electricity production), and with sufficient geospatial detail to capture complex variations in demand, siting limitations, and local policies and to provide actionable insights to inform real-world decision making. New tools and ways of thinking about energy system models will be required to overcome these barriers. The United States should invest in the development of an ecosystem of open-access modeling tools and open-source data to accurately parameterize these models to help plan the transition to net zero and to better represent the universe of possible net-zero transitions.
THE FIRST 10 YEARS: FIVE CRITICAL ACTIONS
This report identifies 10-year actions that are robust across decarbonization pathways. The committee emphasizes strategies that are (1) “no-regrets” actions that would be needed regardless of the final path taken or (2) that retain “optionality” and flexibility so that the United States can take advantage of technological advances, mitigate risks that could derail primary strategies, and avoid stranded actions. Such an approach is also important in light of uncertainties in technology, support for climate policy, differences in regional energy resources or stakeholder preferences, and future climate impacts. The final report focusing on a longer time period will need to consider more strongly methods for planning and policy making under deep uncertainty (Marchau et al., 2019; Mathy et al., 2016; Waisman et al., 2019; Bataille et al., 2016). However, identifying a strategy for 2021–2030 is easier than it sounds, because feasible paths for near-term emissions reductions and early investment in long-term potential strategies are very similar in the first 10 years and diverge only in later years.
For these strategies, the committee has provided estimates of the pace and depth of needed technology deployment and action, in order to provide the order of magnitude of changes warranted in a no-regrets strategy and set of actions in the next 10 years. A selection of these is summarized in Table 2.3 below.
- Invest in energy efficiency and productivity.
Energy and materials efficiency is one of the most cost-effective near-term approaches to reduce energy demand and associated emissions. This approach includes adopting developing technologies and processes that increase fuel efficiency of vehicles (on-road and off-road, including farming equipment); increasing the efficiency of building enclosures as well as installing efficient appliances and equipment in buildings; enhancing energy productivity in manufacturing and other industrial processes and in the power generation fleet; and improving systems efficiencies from greater energy system integration. Demand efficiency and materials efficiency measures (e.g., recycling and reuse)
are also included in this category. Priority actions in the 2021–2030 time frame include the following:
- Buildings: Reduce building space conditioning and plug load energy use by 3 percent per year for existing buildings from a 2018 baseline, to achieve a 30 percent reduction by 2030. Meet the Architecture 2030 goal of carbon neutrality for all new buildings, developments, and major renovations by 2030 (Architecture 2030, n.d.). These targets may be met by implementing a combination of sustainable design strategies, generation of on-site renewable energy, and/or purchasing (20 percent maximum) of off-site renewable energy. It is also critical to work toward maximum conditioning goals for new construction that reflect passive house site energy standards of 5–60 kBtu/ft2/year (depending on climate and building type), with plug loads held to 3000–4000 kWh/year per household, and peak demand capped under 10 W/m2 (3.2 Btu/ft2). As addressed in Wright and Klingenberg (2018), it is essential to reduce peak loads in addition to operational demands through conservation and load shifting in both new and existing buildings. Incorporate district heating, where feasible.
- Transportation: Increase energy productivity by encouraging shifts in transportation from single-occupancy light-duty vehicles (LDVs) to multi-occupancy vehicles, public transit, cycling, and walking (although historically, these shifts can be difficult or costly to achieve). Shift on-road trucking to freight rail. Steadily improve the fuel efficiency of new ICE vehicles—especially important for the medium-duty vehicle/heavy-duty vehicle (MDV/HDV) sectors, as well as planes, ships, and trains, which are more difficult and/or expensive to power with electricity. Encourage flexible and remote work patterns. Invest in improved real-time traffic control, introduce automated vehicles for smoother traffic flow and less congestion from crashes, and reduce travel through telework and mixed-use development. Efficiency improvements could reduce emissions by 10 to 30 percent over the next few decades (Lah, 2017). Between 2007 and 2017, average annual improvement in LDV fuel economy was 1.9 percent per year, and this could be continued in the next decade and extended to trucks with appropriate policies in place (Table 4.1 of Davis and Boundy, 2020). The aviation and maritime industries have also established goals and policies for substantial GHG reductions, primarily through efficiency improvements in the use of alternative fuels (USG, 2015; ICCT, 2018).
- Industry: Deliver 25 percent of the potential industrial sector energy efficiency reductions (3 quads, 117 million tons CO2 reduction) by 2030 (Ungar and Nadel, 2019). Achieve 3 percent per year sustained improvement in industrial energy
- productivity (i.e., dollar of economic output per energy consumed) and improving materials efficiency by minimizing/recycling waste by 10 percent, and advancing waste heat recovery/reuse to improve energy efficiency of process equipment such as furnaces by 10 percent. Optimize systems and promote energy and materials management—for example, strategic energy management (SEM)—across all industries and all size companies, advance smart manufacturing, and institute circular economy strategies.
- Embodied energy in products and building materials: Increase materials and water efficiency to reduce associated energy and GHG inputs. Decrease high-carbon-intensive building and infrastructure materials with goals to reduce carbon intensity by a minimum of 30 percent and to pursue carbon-sequestering alternatives.
- Electrify energy services in the buildings, transportation, and industry sectors.
Electrification of energy services, in tandem with decarbonization of electricity generation, has emerged as a core element in nearly all deep decarbonization scenarios. The greatest near-term (2021–2030) potential for electrification is in the buildings and transportation sectors. In buildings, electric heat pumps for space conditioning and water heating can help lower carbon emissions compared to fossil systems. Among LDVs, electric vehicles are projected to reach cost-parity with internal combustion engine vehicles in the next decade and, in conjunction with relatively low-carbon electricity, will also reduce emissions. Some potential exists for electrification of industrial processes, although electrification technologies for the industrial sector are at a relatively early stage of development and play a greater role beyond the 2030 time frame, as electrification technologies mature, decline in cost, and are demonstrated at scale.
-
Buildings:
- Space heating: Deploy high-efficiency heat pumps in ~25 percent of current residences by 2030 (25–30 million households) and 15 percent of commercial buildings. Focus on stock turnover and new builds in climate zones 1–5,1 planning for 100 percent of sales by 2030.
- Hot water: Switch to heat-pump hot water heaters when existing stock reaches end of life, ramping up to 100 percent of new sales by 2030.
___________________
1 Climate zones are based on heating degree days, average temperatures, and precipitation. Climate zones 1–5 cover all of the United States except for the “cold,”“very cold,” and “subarctic” regions that include Alaska, the northern half of Rockies, the Upper Plains states, Minnesota and Wisconsin, northern Michigan, upstate New York, and the northern half of New England (DOE, 2015b).
-
Transportation:
- Electric vehicles: Approximately 50 percent of new vehicle sales across all vehicle classes (light, medium, and heavy duty) and 15 percent of on-road fleet will be electric vehicles (with some fuel cell EVs in the MDV and HDV subsectors) by 2030. This includes approximately 50 million LDV cars and trucks and 1 million MDV and HDV trucks and buses. Invest in more electrified train services and aircraft. Ports and airport taxiing should be electrified.
- Renewable transportation fuels: Expand power to liquids opportunities for post-2030 by developing regionally based pilot production facilities.
-
Industry:
- Develop and deploy options to decrease emissions from process heat production, including a significant proportion of electric technologies. As opportunities arise for replacement of legacy equipment, advance the use of low-temperature solutions such as heat pumps, infrared, microwave, electric and hybrid boilers, and other options as described in Rightor et al. (2020, Appendix A).
- Deploy tens of GWs of electric boilers to supply low- and medium-temperature heat for various industrial processes whenever electricity cost, economics, and non-energy benefits can justify replacement. In some applications, electric boilers can be installed alongside existing gas boilers, enabling hybrid use of electricity to displace fossil fuels when electricity supply is abundant and costs are low.
- Deploy 1–2 GW of advanced industrial heat pumps (IHPs), with early development/demonstrations at industrial clusters to lower barriers, for a range of process heat, drying, evaporator trains, and other applications lowering CO2 emissions with the electricity coming from low-carbon sources.
- Produce carbon-free electricity.
The electric sector plays a critical role in decarbonization, both in terms of reducing GHG emissions from electricity production and use and for supporting the decarbonization of other sectors. Since 2005, the share of electricity from zero-carbon emitting sources—including nuclear power, hydropower, wind, solar, biomass, and geothermal—has increased from 28 percent to 37 percent. This growth comes primarily from wind and solar, as cost reductions and policy incentives have combined to drive deployment (even as other zero-carbon emitting technologies have declined or remained stagnant). Wind or solar power is now the cheapest source of new electricity generation in 34 percent of U.S. counties, based on levelized cost of electricity and considering regional differences in capital costs and fuel delivery prices (UT-Austin, 2020).
The 2020s are a key decade to build out the electric transmission and distribution infrastructure needed to accommodate flows from and access to these commercially ready new zero-carbon resources.
-
Electricity generation and storage:
- Carbon-free electricity: Roughly double the share of U.S. electricity generation from carbon-free sources from 37 percent today to roughly 75 percent nationwide by 2030.
- Wind and solar power: Deploy ~250–300 GW of wind (~2–3× existing capacity) and ~300 GW of solar (~4× existing) by 2030, supplying approximately 50 percent of U.S. electricity generation (up from 10 percent today). To reach this level, the sustained annual pace of wind and solar capacity deployment must match or exceed record annual rates to date from 2021–2025 and accelerate to roughly double that rate in the 2026–2030 time frame.
- Coal power: Manage continued (or accelerated) retirement of existing coal-fired power plants, including associated operational reliability and local economic transition challenges and impacts.
- Nuclear power: Preserve existing nuclear power plants wherever safe to continue operation as a foundation for growing the carbon-free share of electricity generation. The deployment of small modular reactors may occur by the late 2020s and provide additional clean electricity generation.
- Natural gas power plants: Modest decline in gas-fired electric generation (10 percent–30 percent) and capacity is roughly flat nationally through 2030 to maintain reliability as coal (and some nuclear) units retire, and to provide system flexibility alongside wind, solar, and storage, while avoiding new commitments to long-lived natural gas pipeline infrastructure.
- Energy storage: Deploy 10–60 GW / 40–400 GWh of intraday energy storage capacity (e.g., battery energy storage) through 2030 to reduce need for infrequently utilized peaking power plants, mitigate transmission and distribution constraints, and integrate variable renewable energy. Enhanced demand flexibility (e.g., through real-time pricing, demand response programs, and aggregation and control of flexible loads such as electric vehicle charging) can directly reduce the scale of battery storage required.
- Plan, permit, and build critical infrastructure and repurpose existing energy infrastructure.
In the 2020s, efforts must begin to build out enabling infrastructure for the low-carbon transition. These will include EV-charging networks (to enable vehicle
electrification); long-distance high-voltage transmission lines (to bring remote power resources to population centers, because high-quality renewable sources are often not located near major load centers); upgrades to distribution grid upgrades to enable electrification of heating and transport; and renewable fuel (e.g., hydrogen) transport and storage infrastructure. Planning and siting for a national CO2 pipeline system should begin immediately, and various developments in the first half of the decade will determine whether CO2 infrastructure, including pipelines and storage, will need to be built at scale by 2030 or the middle of the next decade.
-
Transportation:
- Charging infrastructure: Proactive build-out of EV charging infrastructure to facilitate greater adoption of EVs, including 2–3 million Level 2 chargers and at least 100,000 DC fast chargers by 2030. This infrastructure should be a mix of private and public ownership and operation, including fleet operators.
- Investment in vehicle connectivity and real-time control infrastructure.
-
Electricity transmission and distribution:
- Electric transmission: Strengthen and expand U.S. long-distance electricity transmission by identifying corridors needed to support wind and solar deployment (both through 2030 and beyond, given the long siting and build timeline for transmission), which will require policy and process reforms described in Chapter 4. Leverage opportunities to reconductor existing transmission lines at higher voltages and take advantage of existing rights of way and dynamic line rating to enhance existing transfer capacity. Increase overall transmission capacity (as measured in GW-miles) by about 40 percent by 2030. Incorporate new materials to reduce losses and increase efficiency.
- Electric distribution: Strengthen distribution-system planning, investment, and operations to allow for greater use of flexible demand and distributed energy resources for system needs, improve asset utilization in the distribution network, and efficiently accommodate up to an approximately 10 percent increase in peak electricity demand from EVs, heat pumps, and other new loads during the next decade. Prepare for more-rapid electrification and peak demand growth after 2030.
- Expand smart grids: Expand automation and controls across electricity distribution networks and end-use devices by increasing the fraction of electricity meters with advanced two-way communications capabilities from about half to 80 percent. Smart grid expansion will enable greater demand response of EV charging, space and water heating loads, and cooling energy storage for air conditioning buildings. It will also allow the use of a
-
- variety of smart home and business technologies that can increase energy efficiency while reducing consumer costs. Further development of the broadband network across the country is required in order to enable these smart grid expansions. Such actions could also spur economic development and potentially reduce transportation-related carbon emissions by facilitating telework.
-
Fuels:
- Expand hydrogen infrastructure, including transmission and distribution.
- Leverage the current natural gas pipeline infrastructure to operate with 5 percent hydrogen (on an energy basis), with appropriate user retrofits. Complete one or more demonstrations of large-frame combustion turbine operations consuming greater than 20 percent hydrogen (by energy content) on an annual basis through typical operational cycles for multiple years to reduce technology risk and identify longevity and operability challenges with high hydrogen/natural gas blends.
- Build connections from points of H2 generation (via electrolysis or other renewable sources) to the user base, current hydrogen delivery infrastructure, and natural gas distribution system (for blending purposes). Maximize opportunities to utilize and repurpose existing gaseous and liquid fuel transmission, distribution, and logistics infrastructure. Expand hydrogen refueling for medium- and heavy-duty vehicles. Hydrogen networks will likely be regional in scope, given the ability to cost-effectively produce hydrogen in most parts of the country from a combination of electrolysis, natural gas reforming with CCS, and biomass gasification.
-
Industry:
- Define infrastructure requirements to deliver on industrial needs (e.g., interconnections, substations, high-voltage lines, storage, and grid energy flows). Pursue these capacity improvements in collaboration with utilities and industry, again starting with clusters.
- Build capability, market pull, and lower costs for hydrogen use in iron and steel, chemistry, and refining, targeting 2 percent of combined energy and fuel use by 2030 to kick-start future increases.
-
Carbon capture, utilization, and sequestration (CCUS):
- CCUS network development: Set the foundation for large-scale CCUS by planning for the location and timing of an “interstate CO2 highway system” or trunk line network, and determine by mid-decade whether construction of trunk lines needs to be completed by 2030 or 2035 (~10,000 miles, up from 4,500 miles today). Regional clusters can be a starting point of a larger, interconnected network. This network will connect the
-
- high CO2 supply that needs to be abated long term (50 to 75 MMT CO2 per year by 2030 and as much as 250 MMT CO2 by 2035) to regions of high CO2 use potential or storage. Development of a CO2 network could involve repurposing existing natural gas or oil pipeline infrastructure or rights-of-way.
- Reservoir characterization: Characterize sustained CO2 injection rates that can be achieved across each of the major CO2 sequestration basins and identify by 2030 high injection rate locations suitable for injection of approximately 250 million metric tons of CO2 per year.
- Expand the innovation toolkit.
For some sources of emissions, and particularly those in harder-to-abate sectors, low-carbon alternatives are still in the pilot stage or remain nascent industries. For these sectors, near-term opportunities for emissions reduction are limited to improving energy efficiency, materials efficiency, demand management, and other tools that reduce—but cannot completely eliminate—the emissions intensity of these sectors. Maturation, improvement, and scale-up of an expanded set of carbon-free alternatives will be needed as near-term emission reduction opportunities are exhausted. Bringing new energy technologies to market can take 20–70 years from the first prototype, and driving maturation and cost declines for nascent industries proceeds over a decade or longer time scales. Therefore, proactive RD&D and market creation efforts are needed in the 2020s to develop, improve, and scale up nascent low-carbon energy technologies, including the following:
-
Electricity generation:
- RD&D and early market deployment for clean-firm electricity resources (e.g., advanced nuclear, CCS, enhanced geothermal, and hydrogen combustion turbines or fuel cells).
-
Industry:
- Develop transformative processes for utilizing low-carbon energy carriers (e.g., hydrogen) in the generation of low-carbon precursors and products (ammonia, methanol, ethylene, etc.) and as solutions for reductants (e.g., steel).
- Develop and pursue low-carbon process heat solutions across all temperature ranges, especially providing options for mid and high temperatures.
- Advance electrolyzer efficiency and longevity, thereby enabling lower costs and broader application of water electrolysis for H2 and other electrolytic processes
- Substantially increase the efficiency of separations to cut energy costs (upward of 50 percent energy spend for some processes) and introduce low-carbon separation (e.g., membranes driven by electricity).
-
Energy storage:
- RD&D for batteries and other energy storage technologies.
- Improve battery storage for vehicle applications to achieve cost below $50/kWh, performance above 500 Wh/kg, a 10-year life, and several thousand cycles.
- Improve long-duration energy storage for deployment with the electric grid and renewable energy to operate at an ultra-low cost per kWh (~ $1/kWh) and long asset life (e.g., 10–30 years).
-
Fuels:
- RD&D and early market deployment to reduce costs of net- zero carbon fuels, including drop-in and non-drop in fuels, to be cost-competitive with electrification. Specific areas of interest include hydrogen production from electrolysis, biomass gasification, and methane reforming with CCS, particularly early commercial deployment to drive experience and reduce costs; synthesis of hydrocarbon fuels from cellulosic biomass and H2 and CO2 via Fischer-Tropsch or methanation processes (e.g., “drop-in” fuels); and high-yield bioenergy crops.
-
Carbon capture, utilization, and sequestration:
- Develop CCUS technologies (including with support of enabling policies) for a variety of applications across the industry and power generation sectors.
- Perform advanced characterization of geologic formations that have received little attention but may have significant impact (e.g., basalt, ultramafics,2 and saline aquifers). Survey and analyze natural and industrial alkaline sources that could serve as a feedstock for CO2 mineralization.
- Integrate CCS with process heat to lower costs.
- Continue developing and deploying more efficient capture technologies (e.g., Jacoby, 2020) and other negative emission technologies.
- Advance direct CO2 utilization (e.g., syngas, Fischer Tropsch, etc., with renewable H2 and recycled CO2).
-
Innovation to reduce infrastructure siting challenges:
- Increase investment in research, technology, and process/procedural solutions that reduce siting challenges with network infrastructure, including repurposing existing natural gas or oil pipelines for hydrogen or CO2 transport, developing low-cost underground transmission lines on existing rights of way, and increasing utilization and transfer capacities of existing electricity transmission.
- Coordination of these activities to account for the timing of demand changes for CO2, natural gas, and oil as well as the higher pressure operation of CO2 pipelines will be required.
___________________
2 Ultramafic rock is igneous in nature.
IMPACT ON U.S. ENERGY EXPENDITURES IN THE 2020s
Many recent studies estimate that from a technical point of view, the United States could transition to net zero by 2050 using only commercial and near-commercial technologies and spending a smaller fraction of the nation’s GDP on energy system expenditures3 than the country has in the past, including the past decade (see Figure 2.3). However, energy system expenditures during a net-zero transition would be significantly greater than business as usual. If technological options improve faster than considered in recent modeling studies, then the cost of decarbonization could prove lower.
Studies reviewed by the committee in this chapter (Larson et al., 2020; SDSN, 2020) indicate that cumulative incremental energy system expenditures during a net-zero energy transition would be approximately $100 billion to $300 billion through 2030, and $4 trillion to $6 trillion through 2050 beyond the $22.4 trillion in a business-as-usual baseline. (These estimates are reported on a NPV basis of cumulative total expenditures with a 2 percent real social discount rate.4 With a 5 percent social discount rate, the impact would be $210 billion to $270 billion through 2030 and $2 trillion to $3 trillion through 2050. These estimates do not provide a commensurate indicator of the benefits of these investments.) It is important to note that these estimates of energy costs do not capture general equilibrium effects, such as changes in global oil prices. Note, however, that a net-zero transition would greatly reduce U.S. oil demand and put substantial downward pressure on prices. Nor do these cost estimates include impacts of changes in the U.S. balance-of-trade and other effects, which include both positive and negative factors.
The costs for deep decarbonization also must be considered in the context of the considerable benefits of a clean energy transition that could offset some, all, or more than the cost of the transition. There are climate benefits, new economic and employment opportunities, substantial improvements in public health, and intangible global leadership credentials. For example, Hsiang et al. (2017) estimate U.S. economic losses of 1.2 percent of GDP per 1°C temperature rise, with risk distributed unequally across the country and the poorest third of counties in the United State projected to incur the largest damages. They estimate the mitigation of economic damages of $200 billion to $300 billion annually by 2100 compared to a business-as-usual course.
___________________
3 The energy system expenditures referenced here encompass both energy supply and demand, but do not include capital investments.
4 Discount rates put a present value on future costs and benefits. Social discount rates attempt to value the cost and benefits for future generations relative to costs and benefits today.
Benefits of a net-zero transition also include reductions in premature deaths owing to reduced air pollution from fossil fuels, with the magnitude ranging by study: a reduction of 85,000 total premature deaths from air pollution over the 2020–2050 time period from decarbonizing electricity (Phadke et al., 2020); a reduction of 11,000 to 52,000 annual premature deaths from the elimination of air pollution from coal power plants (Prehoda and Pearce, 2017; Larson et al., 2020); and a reduction of up to 200,000 annual premature deaths from eliminating air pollution from fossil fuels entirely (Lelieveld and Münzel, 2019). In addition, a recent report estimated 5 million sustained jobs could be associated with electrifying most energy uses beyond an even larger initial surge of the infrastructure deployment (Griffith and Calisch, 2020), although this would be offset by the loss of about 1.6 million jobs in fossil fuel related sectors. Another recent study estimates that a net increase of roughly 1 million to 5 million jobs would be supported by energy supply-related sectors by 2050 (0.5–1 million by 2030), as total employment in wind, solar, transmission, and other growing sectors offset losses in oil, gas, and coal, in aggregate (Larson et al., 2020). The committee’s task directed it to focus on mitigating emissions, and therefore these beneficial impacts are not extensively reviewed. However, it is clear there are substantial benefits of a net-zero transition.
MOBILIZING CAPITAL INVESTMENT IN THE 2020s
Figure 2.5 and Table 2.2 summarize the roughly $2 trillion in incremental capital investments that must be mobilized over the next decade for projects that come online by 2030 (i.e., total capital in service in the 2020s) to put the United States on track to net zero by 2050. This includes roughly $0.9 trillion in incremental capital investment in supply-side sectors and networks (roughly double the total capital expenditures under business-as-usual) and $1.2 trillion in incremental demand-side investments in buildings, vehicles, and industrial efficiency. It is important to note that these capital investments are not a direct cost borne by either taxpayers or energy consumers. They are investments in the U.S. economy made by both private and public sector actors. The sum of capital investments that must be mobilized in the 2020s is much larger than the increase in total consumer energy expenditures described above because capital investments are paid back through energy expenditures over many years and because investments in renewable electricity, efficient buildings and vehicles, and other capital-intensive measures offset significant annual expenditures on consumption of fuels.
Box 2.2 discusses potential synergies within the systems involved in a net-zero transition, including possible trade-offs and unintended consequences.

TABLE 2.2 Comparison of Supply-Side Capital Investment Needed Between 2021 and 2030 in Princeton Net-Zero America Study of High Electrification (E+) Net-Zero Pathway and Reference Scenario
| Supply Side—Total Capital Investment | Billion USD, 2021–2030 | ||
|---|---|---|---|
| Reference | Net-Zero (E+) | ||
| Electricity | Wind | 110 | 414 |
| Solar | 62 | 374 | |
| Natural gas CT and CCGT | 101 | 112 | |
| Natural gas with CCS | 0 | 0 | |
| Li-ion battery storage | 3 | 3 | |
| Biomass with CCS | 0 | 2 | |
| Networks | Electricity transmission | 203 | 356 |
| Electricity distribution | 352 | 369 | |
| EV chargers | 1 | 7 | |
| CO2 storage | 0 | 11 | |
| CO2 transportation | 0 | 68 | |
| Fuels and industry | H2—gas reforming | 3 | 3 |
| H2—gas reforming with CCS | 0 | 7 | |
| H2—biomass gasification with CCS | 0 | 0 | |
| Electric boilers | 0 | 12 | |
| Gas boilers | 5 | 5 | |
| Cements with CCS | 0 | 9 | |
| DRI steel | 0 | 0 | |
| Total supply side capital expenditure, 2021–2030 | 840 | 1,752 | |
NOTE: The Princeton Net-Zero America analysis (Larson et al., 2020) quotes both total capital in service for projects that come online from 2021 to 2030 and total capital mobilized, which includes capital being spent in the 2020s for projects that come online post-2030. This table quotes total capital in service. NOTE: CCS = carbon capture and sequestration; DRI = direct reduced iron. SOURCE: Data from Larson et al. (2020).
TABLE 2.3 Key Actions Necessary by 2030 for the Five Key Decarbonization Approaches in a Selection of Sectors
| Improve Efficiency and Energy Productivity | Electrify Energy Services in the Buildings, Transportation, and Industrial Sectors | Decarbonize Electricity | Build Critical Infrastructure | Innovate to Complete the Low-Carbon Toolkit | |
|---|---|---|---|---|---|
| Buildings |
|
|
|
|
|
| Transportation |
|
|
|
|
|
| Industry |
|
|
|
|
|
| Electrical energy storage |
|
|
|
|
|
|
|
|
|||
| Fuels |
|
|
|
||
| Electricity generation and transmission |
|
|
|
|
|
||||
| Carbon capture and sequestration |
|
|
|
|
|
|
NOTE: CCS = carbon capture and sequestration; EV = electric vehicle; ICE = internal combustion engine; RD&D = research, development, and demonstration.
IMPLICATIONS BY SECTOR
The following topical boxes (Boxes 2.3 through 2.9) highlight the committee’s evaluation of technologies and approaches required in 2021–2030 to remain on the trajectory for full decarbonization by 2050, organized by sector. Energy demand, supply, carrier, and storage approaches are discussed, including needs for buildings, transportation, industry, energy storage, fuels, electricity generation and transmission, and carbon capture and sequestration. For each topic, the following aspects are highlighted:
- technologies and approaches with the greatest near-term (2021–2030) emissions impact;
- technologies and approaches that have a large potential impact/role in 2031–2050 but need improvement and maturation over the next decade; and
- network infrastructure or other enabling technology or research investment needs that have to be deployed to pave the way to deep decarbonization.
The overall goals for a decarbonization policy plan and the beneficial policies to implement the needed emissions reduction approaches are discussed in Chapters 3 and 4, respectively.
SOURCE: Committee generated using data from Sullivan (2019).
Six overarching goals and strategies to achieve building demand reduction and decrease carbon emissions from the building sector are described below:
- Invest in demand reduction to improve quality of life, provide U.S. jobs, and reduce inequities. Current U.S. codes, standards, RD&D, and investments in building demand reduction significantly lag behind peer nations. The development of national standards and the removal of market barriers can lead to significant reductions in energy use from key building technologies through their natural replacement cycle. Such standards, which would likely be enforced at a local or state level, are further discussed in Chapter 4.
-
Make strategic investments in building efficiency and fuel switching to meet near-term building energy and carbon goals, as outlined in (Ungar and Nadel, 2019):1
- Appliance and equipment efficiency: 5.6 quads, 210 M MtCO2/yr reductions. Next-generation Energy Star standards and replacements for low-income homeowners offer 70 percent energy savings from a dozen products: residential water heaters, central air conditioners/heat pumps, showerheads, clothes dryers, refrigerators, faucets, and furnaces, as well as commercial/industrial fans, electric motors, transformers, air compressors, and packaged unitary air conditioners and heat pumps.
-
- Net-zero emissions in new homes and commercial buildings: 5.7 quads, 265 M MtCO2/yr reductions. Standards and low-income homeowner incentives offer 70 percent energy savings relative to reference-case efficiency levels, with the remaining 30 percent coming from on-site or off-site carbon-free energy systems.
- Smart homes and commercial buildings—new and existing: 3.2 quads, 125 M MtCO2/yr reductions. Weatherization Assistance Program (WAP) training and employment for smart controls, access to real-time information, and smart algorithms will optimize energy savings for automation systems in both residential and commercial buildings (Elliott et al., 2012).
- District and combined heat, cooling, and power—new and existing: 4 quads, 150 MtCO2/yr reductions. Co- or poly-generation of power, heating, hot water, and cooling with district energy systems can reduce emissions by 150 million metric tons of CO2 each year (M MtCO2/yr) by installing new combined heat and power (CHP) plants with a total capacity of 40 GW by 2020 (Park et al., 2019). As long as there is sufficient waste heat from industry and power generation (including increases in waste-to-power), district energy systems offer substantial efficiencies in mixed-use communities in heating dominated climates and offer resiliency for hospitals, schools, and community spaces.
- Existing home and commercial building envelope retrofits: 3.8 quads, 125 M MtCO2/ yr reductions. WAP training and employment for retrofits that improve air tightness, envelope insulation, and window quality to meet ENERGY STAR can reduce energy use by 20–30 percent and improve comfort and health (Belzer et al., 2007; Liaukus, 2014). All commercial buildings undergoing major retrofits should achieve 50 percent reductions in demand (Shonder, 2014).
- Electrification of space heating and water heating in existing homes and commercial buildings: 0.9 quads (after measures above), 76 M MtCO2/yr reductions. Industry standards and incentives can accelerate the deployment of high-efficiency heat pumps that use electricity from low- or no-carbon generation, including on-site photovoltaics that can offer a level of resiliency.
- Reduce embodied carbon emissions. As buildings become more efficient, the embodied carbon in building materials becomes as critical as operational carbon. The embodied carbon emissions from all new buildings, infrastructures, and associated materials should be reduced by 50 percent by 2030 and eliminated by 2050.
-
Electrify the built environment and integrate it with the grid. Buildings have a role in electricity generation, storage, and carbon sequestration as well. Buildings and communities play a significant role in decarbonizing energy supply through the following:
- Electrification of the built environment with the lowest conditioning, process, plug and parasitic loads through conservation, passive conditioning, and energy cascades;
- Peak load shaving and demand flexibility;
- District and building CHP for 150 M MtCO2/yr;
opportunity as well, delivering roughly 300–1,000 MtCO2/yr of negative emissions by 2050 (Larson et al., 2020) that can offset direct emissions elsewhere in hard-to-decarbonize sectors.
Avoiding CO2 emissions through capture at the point source requires less energy than capture from dilute air. However, direct air capture is receiving increased attention as an approach to offset difficult-to-eliminate emissions from the transportation, industrial heating, and agriculture sectors, and for other options in carbon removal (Wilcox, 2020a,b).
TABLE 2.9.1 Scale, Energy, Cost, and Example Carbon Capture Projects Globally
| Capture Application | 2020-Scale (MtCO2/yr)a | Percent CO2b | Min Work (kJ/mol)c | Nth-kind Costd ($/tCO2) | Example Projects (Start Date; Scale) |
|---|---|---|---|---|---|
| Natural Gas | 700 | 3–5 | ~9–10 | ~55–60 | Elk Hills, Fluor (2020; Mt/yr) |
| Industry (process emissions only) | |||||
| Cement | 67 | 25–30 | ~4 | ~30 | Lafarge Holcim, Total, Svante (2019; kt/yr) |
| Refining | 40 | 15–20 | ~6 | ~40 | Norway, Statoil Mongstad (2012; 100s kt/yr) |
| Bioethanol | 37 | 99+ | ~0 | ~<20 | Decator, ADM (2017; Mt/yr) |
| Hydrogen | 26 | 45–70 | ~2-3 | ~25–30 | Port Arthur, Air Products (2013; Mt/yr) |
| Iron and Steel | 19 | 20–25 | ~5 | ~35–40 | Abu Dhabi CCS Project, UAE (2016; Mt/yr) |
| Air Capturee | |||||
| Solvents | ~1 | 0.04 | 21 | ~150–600 | Carbon Engineering (2023; 1 Mt/yr) |
| Solid Sorbents | <1 | 0.04 | 21 | ~150–600 | Climeworks—14 plants globally (kt/yr) |
a Pilorgé et al., 2020; Psarras et al., 2020.
b Bains et al., 2017; Pilorgé et al., 2020; Psarras et al., 2020.
d Based on nth-of-a-kind technology-agnostic modeling from Pilorgé et al., 2020.
e Cost range is broad and depends on technology and energy resource choices, in addition to scale of deployment.
CONCLUSION
The many feasible pathways for deep decarbonization by 2050 all have similar requirements in 2021–2030, which are summarized in this report’s five key actions for the 2020s:
- Invest in energy efficiency and productivity across end-use sectors.
- Electrify energy services, particularly transportation and heating.
- Produce carbon-free electricity, doubling the share of clean electricity generation to roughly 75 percent.
- Plan, permit, and build critical infrastructure and repurpose existing energy infrastructure.
- Expand the innovation toolkit, investing in RD&D and creating initial markets for nascent net-zero technologies via incentives and standards.
In order to remain on a path to decarbonization by 2050, decision makers in transportation, buildings, industry, electricity generation/transmission/distribution, fuels, and other sectors must align their actions with the five key actions. Some actions for 2021–2030 are already under way with existing technology and need to be maintained or accelerated, such as the steady installation of new zero-carbon electricity generation and retirement of coal-fired generation. Some actions could be implemented immediately with existing technology but need to begin, such as replacement of building heating with electric equipment, widespread deployment of electric vehicles, and blending of hydrogen with natural gas in industrial infrastructure and equipment. Other actions, such as carbon capture, require improvement and maturation of existing technologies or new technology or approaches to be developed and tested at scale, and research, development, and deployment in these areas must be accelerated in the decade after the release of this report to provide options in 2030–2050.
The investment requirements in 2021–2030 to implement the five key actions would require spending no more of the nation’s GDP on energy services than the United States has over the past decade and would require a total incremental expenditure of about $300 billion above the business-as-usual case through 2030 (an ~3 percent increase relative to business-as-usual). The transition to a decarbonized system would have significant benefits in the United States, on the order of $200 billion to $300 billion annually of avoided climate damages, in addition to preventing hundreds of thousands of premature deaths and saving trillions of dollars of health costs from fossil fuel pollution.
Although the approaches to decarbonization are well known, and the technologies to get started are ready for implementation in 2021–2030, new policies and systems are required to reduce cost and encourage adoption of needed technologies and
approaches at a sufficient pace and scale. The technological goals for a net-zero energy system by 2050 detailed in this chapter are complementary to the socioeconomic goals discussed in Chapter 3 and integral to the policy options presented in Chapter 4.
REFERENCES
Ahmadi, P. 2019. Environmental impacts and behavioral drivers of deep decarbonization for transportation through electric vehicles. Journal of Cleaner Production 225: 1209–1219.
Architecture 2030. n.d. “The 2030 Challenge.” https://architecture2030.org/2030_challenges/2030-challenge/.
Bains, P., P. Psarras, and J. Wilcox. 2017. CO2 capture from the industry sector. Progress in Energy and Combustion Science 63: 146–172.
Balaraman, K. 2020. “Why Is the Utility Industry Less Bullish on Grid-Scale Storage?” Utility Dive. https://www.utilitydive.com/news/safety-volatile-market-less-bullish-storage/572013/.
Bataille, C., H. Waisman, M. Colombier, L. Segafredo, and J. Williams. 2016. The Deep Decarbonization Pathways Project (DDPP): Insights and emerging issues. Climate Policy 16(Suppl 1) S1–S6.
Belzer, D., G. Mosey, P. Plympton, and L. Dagher. 2007. Home Performance with ENERGY STAR: Utility Bill Analysis on Homes Participating in Austin Energy’s Program. National Renewable Energy Laboratory. https://www.osti.gov/biblio/910503.
Bhatti, A.R., Z. Salam, M.J. Bin Abdul Aziz, K.P. Yee, and R.H. Ashique. 2016. Electric vehicles charging using photovoltaic: Status and technological review. Renewable and Sustainable Energy Reviews 54: 34c47.
BNEF (Bloomberg New Energy Finance). 2019. “New Energy Outlook 2019.” BloombergNEF (blog). https://about.bnef.com/new-energy-outlook/.
Bonner, B. 2013. “Current Hydrogen Cost.” Presented at the DOE Hydrogen and Fuel Cell Technical Advisory Committee, October 30. https://www.hydrogen.energy.gov/pdfs/htac_oct13_10_bonner.pdf.
Brown, D.R. 2015. Hydrogen production and consumption in the U.S.; The last 25 years. Cryogas International 53(9):40–41.
Brynolf, S., M. Taljegard, M. Grahn, and J. Hansson. 2018. Electrofuels for the transport sector: A review of production costs. Renewable and Sustainable Energy Reviews 81: 1887–1905.
Chen, K., M.J. Namkoong, V. Goel, C. Yang, S. Kazemiabnavi, S.M. Mortuza, E. Kazyak, et al. 2020. Efficient fast-charging of lithium-ion batteries enabled by laser-patterned three-dimensional graphite anode architectures. Journal of Power Sources 471.
Cox, S., S. Tegen, I. Baring-Gould, F.A. Oteri, S. Esterly, T. Forsyth, and R. Baranowski. 2015. Policies to Support Wind Power Deployment: Key Considerations and Good Practices. Golden, CO: National Renewable Energy Laboratory.
Davis, S., and R.G. Boundy. 2020. Transportation Energy Data Book: Edition 38. Oak Ridge, TN: Oak Ridge National Laboratory.
Davis, S.J., N.S. Lewis, M. Shaner, S. Aggarwal, D. Arent, I.L. Azevedo, S.M. Benson, et al. 2018. Net-zero emissions energy systems. Science 360(1419).
de Pee, A., D. Pinner, O. Roelofsen, K. Somers, E. Speelman, and M. Witteveen. 2018. Decarbonization of Industrial Sectors: The next Frontier. Washington, DC: McKinsey and Company.
DOE (Department of Energy). 2014. Energy Storage Safety Strategic Plan. Washington DC: Office of Electricity Delivery and Energy Reliability.
DOE. 2015a. “Revolution . . . Now: The Future Arrives for Five Clean Energy Technologies—2015 Update.” https://www.energy.gov/sites/prod/files/2015/11/f27/Revolution-Now-11132015.pdf.
DOE. 2015b. Guide to Determining Climate Regions by County. Building American Best Practices Volume 7.3. Richland, WA: Pacific Northwest National Laboratory.
DOE. 2015c. 2015 Improving Process Heating System Performance: A Sourcebook for Industry, Third Edition. Washington DC: Office of Energy Efficiency and Renewable Energy.
DOE. 2018. Spotlight: Solving Challenges in Energy Storage. Washington, DC: Office of Technology Transitions.
DOE-EERE (Department of Energy Office of Energy Efficiency and Renewable Energy). 2020a. “WINDExchange: U.S. Installed and Potential Wind Power Capacity and Generation.” https://windexchange.energy.gov/maps-data/321.
DOE-EERE. 2020b. “Advancing the Growth of the U.S. Wind Industry: Federal Incentives, Funding, and Partnership Opportunities.” Washington DC. https://www.energy.gov/sites/prod/files/2020/02/f71/weto-funding-factsheet-2020.pdf.
EFI (Energy Futures Initiative). 2019. The Green Real Deal: A Framework for Achieving a Deeply Decarbonized Economy. Washington DC.
EIA (Energy Information Administration). 2014. “Table 3.2 Energy Consumption as a Fuel by Mfg. Industry and Region (Trillion BTU).” 2014 Manufacturing Energy Consumption Survey (MECS) Survey Data. https://www.eia.gov/consumption/manufacturing/data/2014/pdf/table3_2.pdf.
EIA. 2018. “U.S. Battery Storage Market Trends.” May 21. https://www.eia.gov/analysis/studies/electricity/batterystorage/archive/2018/.
EIA. 2019a. Annual Energy Outlook 2019 with Projections to 2050. January 29. Washington, DC. https://www.eia.gov/outlooks/archive/aeo19/.
EIA 2019b. “Henry Hub Natural Gas Spot Price.” https://www.eia.gov/dnav/ng/hist/rngwhhdA.htm.
EIA 2019c. “Today in Energy: Daily Prices.” https://www.eia.gov/todayinenergy/prices.php.
EIA. 2020a. Annual Energy Outlook 2020 with Projections to 2050. January 29. Washington, DC. https://www.eia.gov/outlooks/archive/aeo20/.
EIA. 2020b. “Table 7.2a Electricity Net Generation: Total (All Sectors).” Monthly Energy Review. September 24.
EIA. 2020c. “Electric Power Annual 2019.” Washington, DC. October. https://www.eia.gov/electricity/annual/pdf/epa.pdf.
EIA. 2020d. “Table 1.7 Primary Energy Consumption, Energy Expenditures, and Carbon Dioxide Emissions Indicators.” Monthly Energy Review. August 26.
EIA. 2020e. “Recent Data.” Consumption and Efficiency. http://www.eia.gov/consumption.
Elliott, N., M. Molina, and D. Trombley. 2012. A Defining Framework for Intelligent Efficiency. Washington, DC: American Council for an Energy-Efficient Economy.
Energy Innovations. 2020. “Net-Zero Emissions Scenario.” Policy Solutions. https://us.energypolicy.solutions/scenarios/home.
EPA (Environmental Protection Agency). 2019. GlobalNon-CO2 GreenhouseGasEmissionProjections&Mitigation2015–2050. Washington, DC.
EPA. 2020. Inventory of U.S. Greenhouse Gas Emissions and Sinks: 1990–2018. Washington, DC.
EPA Office of Air and Radiation, Climate Protection Partnerships Division (EPA). 2017. National Awareness of ENERGY STAR for 2016: Analysis of 2016 CEE Household Survey. Washington, DC.
EPRI (Electric Power Research Institute). 2019. Renewable Ammonia Generation, Transport, and Utilization in the Transportation Sector. Technology Insights Brief. Washington, DC.
ETC (Energy Transitions Commission). 2018. “Mission Possible: Reaching Net-Zero Carbon Emissions from Harder-to-Abate Sectors by Mid-Century.” https://www.energy-transitions.org/wp-content/uploads/2020/08/ETC_MissionPossible_FullReport.pdf.
Farbes, J., G. Kwok, and R. Jones. 2020. “Low-Carbon Transition Strategies for the Midwest.” https://irp-cdn.multiscreensite.com/be6d1d56/files/uploaded/SDSN_Midwest%20Low%20Carbon%20Strategies_FINAL.20200713.pdf.
Friedmann, J.S., Z. Fan, and K. Tang. 2019. Low-Carbon Heat Solutions for Heavy Industry: Sources, Options, and Costs Today. New York, NY: Columbia University Center on Global Energy Policy.
Global Cement. 2019. “Cross River Partners with Svante for Carbon Capture and Storage.” https://www.globalcement.com/news/item/10150-cross-river-partners-with-svante-for-carbon-capture-and-storage.
Global Cement. 2020. “Holcim US Invests in CCS Study at Portland Cement Plant.” https://www.globalcement.com/news/item/10283-holcim-us-invests-in-ccs-study-at-portland-cement-plant.
Griffith, S., and S. Calisch. 2020. “Mobilizing for a Zero Carbon America: Jobs, Jobs, Jobs, and More Jobs.” Rewiring America. https://www.rewiringamerica.org/jobs-report.
Haley, B., R. Jones, G. Kwok, J. Hargreaves, J. Farbes, and J. Williams. 2019. 350 PPM Pathways for the United States. U.S. Deep Decarbonization Pathways Project. Evolved Energy Research. https://www.evolved.energy/post/2019/05/08/350-ppm-pathways-for-the-united-states.
Hand, M.M., S. Baldwin, E. DeMeo, J.M. Reilly, T. Mai, D. Arent, G. Porro, M. Meshek, and D. Sandor. 2012. Renewable Electricity Futures Study. Golden, CO: National Renewable Energy Laboratory.
Harper, G., R. Sommerville, E. Kendrick, L. Driscoll, P. Slater, R. Stolkin, A. Walton, et al. 2019. Recycling lithium-ion batteries from electric vehicles. Nature 575 (7781): 75–86.
Hsiang, S., R. Kopp, A. Jina, J. Rising, M. Delgado, S. Mohan, D.J. Rasmussen, et al. 2017. Estimating economic damage from climate change in the United States. Science 356(6345): 1362.
IEA (International Energy Agency). 2020a. Energy Technology Perspectives 2020. Paris, France.
IEA. 2020b. Global EV Outlook 2020. Paris, France.
ICCT (International Council on Clean Transportation). The International Maritime Organization’s Initial Greenhouse Gas Strategy. Washington, DC.
Investing.com. 2019. “Gasoline RBOB Futures Historical Data.” https://www.investing.com/commodities/gasolinerbob-historical-data.
IPCC (Intergovernmental Panel on Climate Change). 2014. Climate Change 2014: Synthesis Report. Geneva, Switzerland.
IPCC. 2018. Global Warming of 1.5°C. Geneva, Switzerland: Intergovernmental Panel on Climate Change.
IRENA (International Renewable Energy Agency). 2018. “Hydrogen From Renewable Power: Technology Outlook for the Energy Transition.” Abu Dhabi.
Jacobson, M.Z., M.A. Delucchi, G. Bazouin, Z.A.F. Bauer, C.C. Heavey, E. Fisher, S.B. Morris, et al. 2015. 100% clean and renewable wind, water, and sunlight (WWS) all-sector energy roadmaps for the 50 United States. Energy & Environmental Science 8(7): 2093–2117.
Jacoby, M. 2020. Tailor-made MOF readily catches and releases CO2. Chemical and Engineering News 98(29).
Jenkins, J.D., M. Luke, and S. Thernstrom. 2018. Getting to zero carbon emissions in the electric power sector. Joule 2(12): 2498–2510.
Kelemen, P., S.M. Benson, H. Pilorgé, P. Psarras, and J. Wilcox. 2019. An overview of the status and challenges of CO2 storage in minerals and geological formations. Frontiers in Climate 1: 9.
Kim, S.J., C.R. Tang, G. Singh, L.M. Housel, S. Yang, K.J. Takeuchi, A.C. Marschilok, et al. 2020. New insights into the reaction mechanism of sodium vanadate for an aqueous Zn ion battery. Chemistry of Materials 32(5): 2053–2060.
Krey, V., G. Luderer, L. Clarke, and E. Kriegler. 2014. Getting from here to there—Energy technology transformation pathways in the EMF27 scenarios. Climatic Change 123(3): 369–382.
Kriegler, E., J.P. Weyant, G.J. Blanford, V. Krey, L. Clarke, J. Edmonds, A. Fawcett, et al. 2014. The role of technology for achieving climate policy objectives: Overview of the EMF 27 study on global technology and climate policy strategies. Climatic Change 123(3): 353–367.
Kwok, G., J. Farbes, and R. Jones. 2020. Low-Carbon Transition Strategies for the Southeast. U.S. Deep Decarbonization Pathways Project. San Francisco, CA: Evolved Energy Research.
Lah, O. 2017. Decarbonizing the transportation sector: Policy options, synergies, and institutions to deliver on a low-carbon stabilization pathway. Wiley Interdisciplinary Reviews: Energy and Environment 6(6).
Larson, J., W. Herndon, M. Grant, and P. Marsters. 2019. CapturingLeadership:PoliciesfortheUStoAdvanceDirectAirCapture Technology. New York: Rhodium Group.
Larson, E., C. Greig, J. Jenkins, E. Mayfield, A. Pascale, C. Zhang, S. Pacala, et al. 2020. Net-Zero America by 2050: Potential Pathways, Deployments, and Impacts. Princeton, NJ: Princeton University.
Lazard. 2019. “Lazard’s Levelized Cost of Energy Analysis—Version 13.0.” https://www.lazard.com/media/451086/lazardslevelized-cost-of-energy-version-130-vf.pdf.
Lelieveld, J., and T. Münzel. 2019. Air pollution, chronic smoking, and mortality. European Heart Journal 40(38), 3204–3204.
Leuenberger, M., and R. Frischknecht. 2010. Life Cycle Assessment of Battery Electric Vehicles and Concept Cars. Schaffhausen, Switzerland: ESU-Services Ltd.
Li, J., E. Murphy, J. Winnick, and P.A. Kohl. 2001. Studies on the cycle life of commercial lithium ion batteries during rapid charge-discharge cycling. Journal of Power Sources 102: 294–301.
Liaukus, C. 2014. Energy Efficiency Measures to Incorporate into Remodeling Projects. Golden, CO: National Renewable Energy Laboratory.
Lutsey, N., and M. Nicholas. 2019. “Update on Electric Vehicle Costs in the United States through 2030.” Working Paper. San Francisco, CA: International Council on Clean Transportation. April 2.
Mahajan, M. 2019a. “How To Reach U.S. Net Zero Emissions By 2050: Decarbonizing Buildings.” Forbes. https://www.forbes.com/sites/energyinnovation/2019/11/05/reaching-us-net-zero-emissions-by-2050-decarbonizing-buildings/.
Mahajan, M. 2019b. “How To Reach U.S. Net Zero Emissions By 2050: Decarbonizing Electricity.” Forbes. https://www.forbes.com/sites/energyinnovation/2019/11/12/how-to-reach-us-net-zero-emissions-by-2050-decarbonizingelectricity/?sh=4d9e62e749e7.
Majeau-Bettez, G., T.R. Hawkins, and A.H. Strømman. 2011. Life cycle environmental assessment of lithium-ion and nickel metal hydride batteries for plug-in hybrid and battery electric vehicles. Environmental Science and Technology 45(10): 4548–4554.
Marchau, V.A.W.J., W.E. Walker, P.J.T.M. Bloemen, and S.W. Popper. 2019. Decision Making Under Deep Uncertainty: From Theory to Practice. 1st ed. Switzerland: Springer International Publishing.
Mathy, S., P. Criqui, K. Knoop, M. Fischedick, and S. Samadi. 2016. Uncertainty management and the dynamic adjustment of deep decarbonization pathways. Climate Policy 16(1): 47–62.
McKinsey and Company. 2013. “Pathways to a Low Carbon Economy: Version 2 of the Greenhouse Gas Abatement Cost Curve.” https://www.mckinsey.com/business-functions/sustainability/our-insights/pathways-to-a-low-carbon-economy.
McQueen, N., P. Psarras, H. Pilorgé, S. Liguori, J. He, M. Yuan, C.M. Woodall, et al. 2020. Cost analysis of direct air capture and sequestration coupled to low-carbon thermal energy in the United States. Environmental Science and Technology 54(12): 7542–7551.
Morrison, G.M., S. Yeh, A.R. Eggert, C. Yang, J.H. Nelson, J.B. Greenblatt, R. Isaac, et al. 2015. Comparison of low-carbon pathways for California. Climatic Change 13(4): 545–557.
NAM (National Association of Manufacturers). 2018. “2019 United States Manufacturing Facts.” https://www.nam.org/state-manufacturing-data/2019-united-states-manufacturing-facts/.
NASEM (National Academies of Sciences, Engineering, and Medicine). 2019. Negative Emissions Technologies and Reliable Sequestration: A Research Agenda. Washington, DC: The National Academies Press.
Nemet, G.F. 2019. How Solar Energy Became Cheap: A Model for Low-Carbon Innovation. New York, NY: Routledge, Taylor and Francis Group.
OMB (Office of Management and Budget). 2020. “Historical Tables.”Washington DC: The White House. https://www.white-house.gov/omb/historical-tables/.
Palacín, M.R., and A. de Guibert. 2016. Why do batteries fail? Science 351(6273): 1253292.
Park, J., S. Lim, and S. Yoo. 2019. Does combined heat and power mitigate CO2 emissions? A cross-country analysis. Environmental Science and Pollution Research 26(11): 11503–11507.
Phadke, A., U. Paliwal, N. Abhyankar, T. McNair, B. Paulos, D. Wooley, and R. O’Connell. 2020. 2035 The Report: Plummeting Solar, Wind, and Battery Costs Can Accelerate Our Clean Electricity Future. Berkeley, CA: Goldman School of Public Policy, University of California, Berkeley. September.
Pilorgé, H., N. McQueen, D. Maynard, P. Psarras, J. He, T. Rufael, and J. Wilcox. 2020. Cost analysis of carbon capture and sequestration of process emissions from the U.S. industrial sector. Environmental Science and Technology 54(12): 7524–7532.
Podesta, J., C. Goldfuss, T. Higgins, B. Bhattacharyya, A. Yu, and K. Costa. 2019. A 100 Percent Clean Future. Washington, DC: Center for American Progress.
Poyraz, A.S., J. Huang, S. Cheng, D.C. Bock, L. Wu, Y. Zhu, A.C. Marschilok, et al. 2016. Effective recycling of manganese oxide cathodes for lithium based batteries. Green Chemistry 18(11): 3414–3421.
Prehoda, E.W., and J.M. Pearce. 2017. Potential lives saved by replacing coal with solar photovoltaic electricity production in the U.S. Renewable and Sustainable Energy Reviews 80: 710–715.
PWC (PricewaterhouseCooper). 2017. “The World in 2050.” https://www.pwc.com/gx/en/issues/economy/the-world-in-2050.html.
Psarras, P., J. He, H. Pilorgé, N. McQueen, A. Jensen-Fellows, K. Kian, and J. Wilcox. 2020. Cost analysis of carbon capture and sequestration from U.S. natural gas-fired power plants. Environmental Science and Technology 54(10): 6272–6280.
Reddy, S., and C. Freeman. 2018. “Fluor Solvent Evaluation and Testing (Project 70814).” Pacific Northwest National Laboratory. https://netl.doe.gov/sites/default/files/netl-file/C-Freeman-PNNL-Advanced-Solvent-Testing.pdf.
Reed, L., M. Dworkin, P. Vaishnav, and M.G. Morgan. 2020. Expanding transmission capacity: Examples of regulatory paths for five alternative strategies. The Electricity Journal 33(6): 106770.
Rightor, E., A. Whitlock, and R.N. Elliott. 2020. Beneficial Electrification in Industry. Washington DC: American Council for an Energy-Efficient Economy.
Rissman, J. 2019. “How To Reach U.S. Net Zero Emissions By 2050: Decarbonizing Industry.” Forbes. https://www.forbes.com/sites/energyinnovation/2019/11/04/how-to-reach-us-net-zero-emissions-by-2050-decarbonizing-industry/.
Rissman, J., C. Bataille, E. Masanet, N. Aden, W.R. Morrow, N. Zhou, N. Elliott, et al. 2020. Technologies and policies to decarbonize global industry: Review and assessment of mitigation drivers through 2070. Applied Energy 266: 114848.
Schnitkey, G. 2018. “Weekly Farm Economics: Fertilizer Prices Higher for 2019 Crop.” University of Illinois, Urbana-Champaign. Farmdoc Daily 8: 178.
SDSN (Sustainable Development Solutions Network). Zero Carbon Action Plan. New York, NY: Sustainable Development Solutions Network.
SEIA (Solar Energy Industries Association). 2020. U.S. Solar Market Insight. SEIA and Wood Mackenzie Power and Renewables. Washington, DC.
Sepulveda, N.A., J.D. Jenkins, F.J. de Sisternes, and R.K. Lester. 2018. The role of firm low-carbon electricity resources in deep decarbonization of power generation. Joule 2(11): 2403–2420.
Sepulveda, N.A., J.D. Jenkins, A. Edington, D. Mallapragada, and R.K. Lester. 2021. Evaluating the technology design space for long-duration energy storage and role in deep decarbonization of power systems. Nature Energy (in press).
Shonder, J. 2014. Energy Savings from GSA’s National Deep Energy Retrofit Program. Oak Ridge, TN: Oak Ridge National Laboratory.
Steinberg, D., D. Bielen, J. Eichman, K. Eurek, J. Logan, T. Mai, C. McMillan, et al. 2017. Electrification and Decarbonization: Exploring U.S. Energy Use and Greenhouse Gas Emissions in Scenarios with Widespread Electrification and Power Sector Decarbonization. Golden, CO: National Renewable Energy Laboratory.
Sullivan, T. 2019. “2018 Building Energy Benchmarking.” City of Seattle Open Data Portal. https://data.seattle.gov/dataset/2018-Building-Energy-Benchmarking/7rac-kyay.
Tallman, K.R., B. Zhang, L. Wang, S. Yan, K. Thompson, X. Tong, J. Thieme, et al. 2019. Anode overpotential control via interfacial modification: Inhibition of lithium plating on graphite anodes. ACS Applied Materials and Interfaces 11(50): 46864–46874.
Trembath, A., J. Jenkins, T. Nordhaus, and M. Shellenberger. 2012. “Where the Shale Gas Revolution Came From.” The Breakthrough Institute. https://thebreakthrough.org/issues/energy/where-the-shale-gas-revolution-came-from.
Ungar, L., and S. Nadel. 2019. Halfway There: Energy Efficiency Can Cut Energy Use and Greenhouse Gas Emissions in Half by 2050. Washington, DC: American Council for an Energy-Efficient Economy.
United Nations. 2016. Amendment to the Montreal Protocol on Substances that Deplete the Ozone Layer, C.N.872.2016. TREATIES-XXVII.2.f § (2016). https://treaties.un.org/doc/Publication/CN/2016/CN.872.2016-Eng.pdf.
USG (U.S. Government). 2015. United States Aviation Greenhouse Gas Emissions Reduction Plan. Submitted to the International Civil Aviation Organization. https://www.icao.int/environmental-protection/Pages/ClimateChange_ActionPlan.aspx.
UT-Austin (University of Texas at Austin Energy Institute). 2020. “Levelized Cost of Energy Map, Version 1.4.0.” https://calculators.energy.utexas.edu/lcoe_map/#/county/tech.
Vibrant Clean Energy. 2019. Colorado Electrification and Decarbonization Study. Boulder, CO: Community Energy, Inc.
Waisman, H., C. Bataille, H. Winkler, F. Jotzo, P. Shukla, M. Colombier, D. Buira, et al. 2019. A pathway design framework for national low greenhouse gas emission development strategies. Nature Climate Change 9(4): 261–268.
Wang, L., Q. Wu, A. Abraham, P.J. West, L.M. Housel, G. Singh, N. Sadique, et al. 2019. Silver-containing α-MnO2 nanorods: Electrochemistry in rechargeable aqueous Zn-MnO2 batteries. Journal of the Electrochemical Society 166(15): 3575–3584.
Webster, M., J. Arehart, R. Chepuri, J. D’Aloisio, K. Gregorian, M. Gryniuk, J. Hogroian, et al. 2020. “Achieving Net Zero Embodied Carbon in Structural Materials by 2050.” White paper. Structural Engineering Institute’s Sustainability Committee Carbon Working Group. American Society of Civil Engineers. https://www.asce.org.
White House. 2016. United States Mid-Century Strategy for Deep Decarbonization. Washington, DC.
Wilcox, J. 2012. Carbon Capture. New York, NY: Springer New York.
Wilcox, J. 2020a. The giving Earth. The Bridge 50(1): 43-50.
Wilcox, J. 2020b. “The Essential Role of Negative Emissions in Getting to Carbon Neutral.” Policy Digest. Kleinman Center for Energy Policy, University of Pennsylvania. https://kleinmanenergy.upenn.edu.
Williams, J.H., B. Haley, F. Kahrl, J. Moore, A.D. Jones, M.S. Torn, and H. McJeon. 2014. Pathways to Deep Decarbonization in the United States. San Francisco CA: Energy and Environmental Economics, Inc.
Williams, J., R. Jones, G. Kwok, and B. Haley. 2018. Deep Decarbonization in the Northeast United States and Expanded Coordination with Hydro-Québec. Evolved Energy Research. https://www.evolved.energy.
Woo, J., and C.L. Magee. 2020. Forecasting the value of battery electric vehicles compared to internal combustion engine vehicles: The influence of driving range and battery technology. International Journal of Energy Research 44(8): 6483–6501.
Wood, D.L., M. Wood, J. Li, Z. Du, R.E. Ruther, K.A. Hays, N. Muralidharan et al. 2020. Perspectives on the relationship between materials chemistry and roll-to-roll electrode manufacturing for high-energy lithium-ion batteries. Energy Storage Materials 29: 254–265.
Wright, G.S., and K. Klingenberg. 2018. Climate-Specific Passive Building Standards. Golden, CO: National Renewable Energy Laboratory.
Zheng, J., Q. Zhao, T. Tang, J. Yin, C.D. Quilty, G.D. Renderos, X. Liu, et al. 2019. Reversible epitaxial electrodeposition of metals in battery anodes. Science 366(6465): 645–648.
This page intentionally left blank.


