Development of a MASH Barrier to Shield Pedestrians, Bicyclists, and Other Vulnerable Users from Motor Vehicles (2024)
Chapter: 13 Finite Element Analysis for Final Thrie Beam Transition System

CHAPTER 13
Finite Element Analysis for Final Thrie Beam Transition System
This chapter describes the design of the transition system and the results of the computer simulation that was conducted to determine the crashworthiness of the proposed design and to identify the CIP for the full-scale crash test.
Transition Design with Thrie Beam
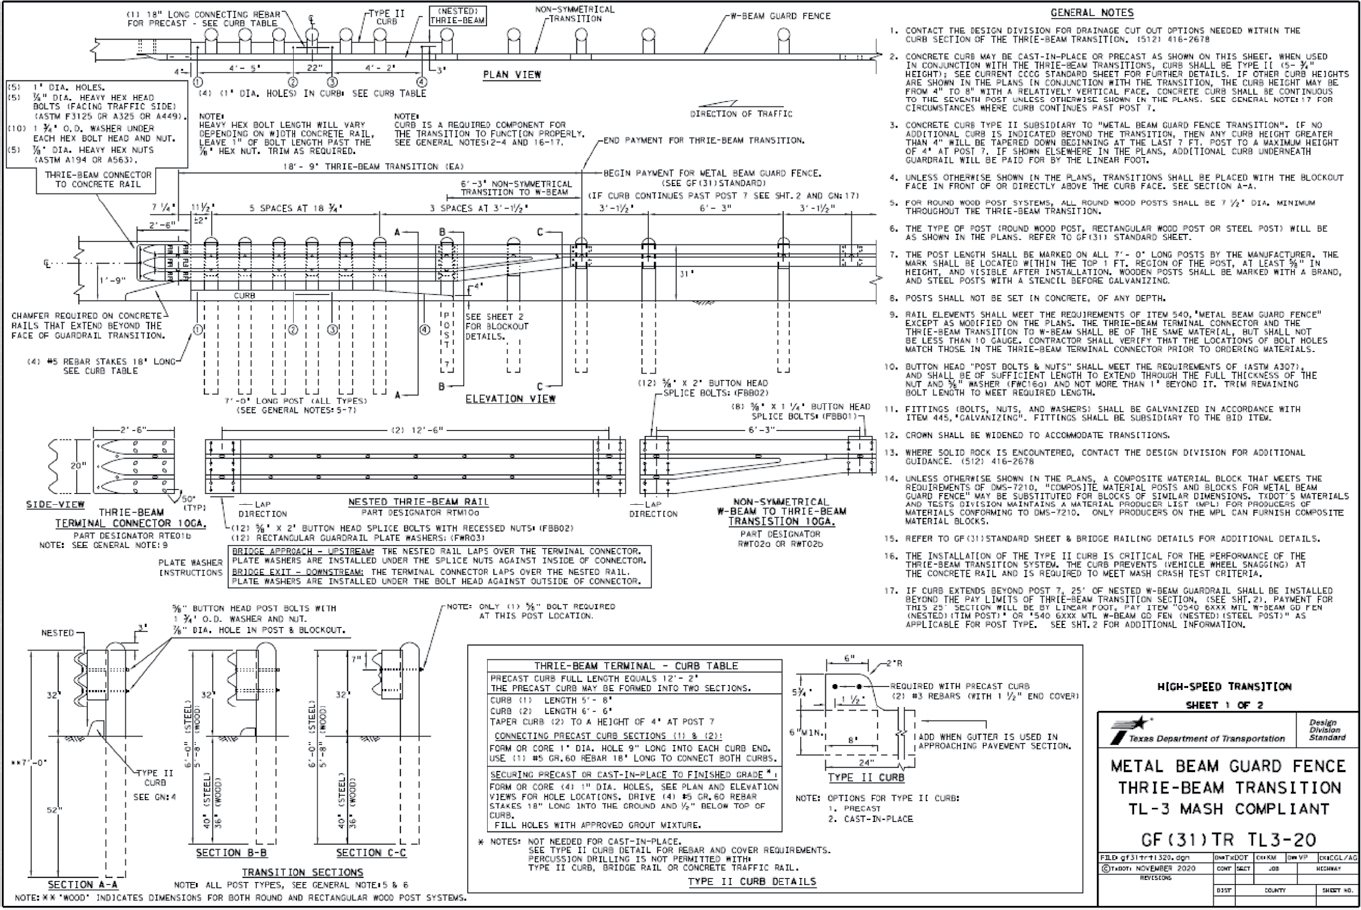
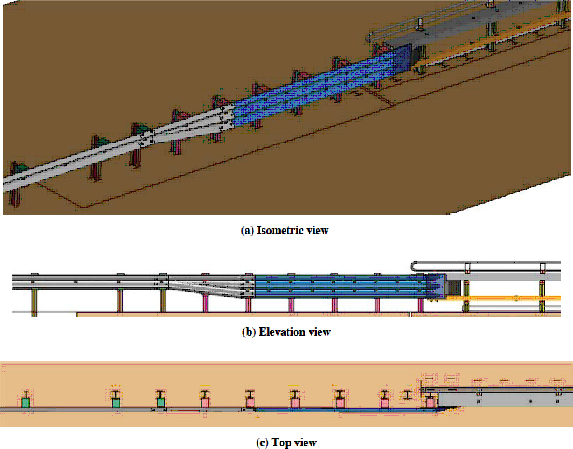
The proposed Thrie beam transition system was designed by adapting and modifying the standard TxDOT Thrie beam transition design (see Figure 107). Figures 108 through 112 present specific details of the transition design.
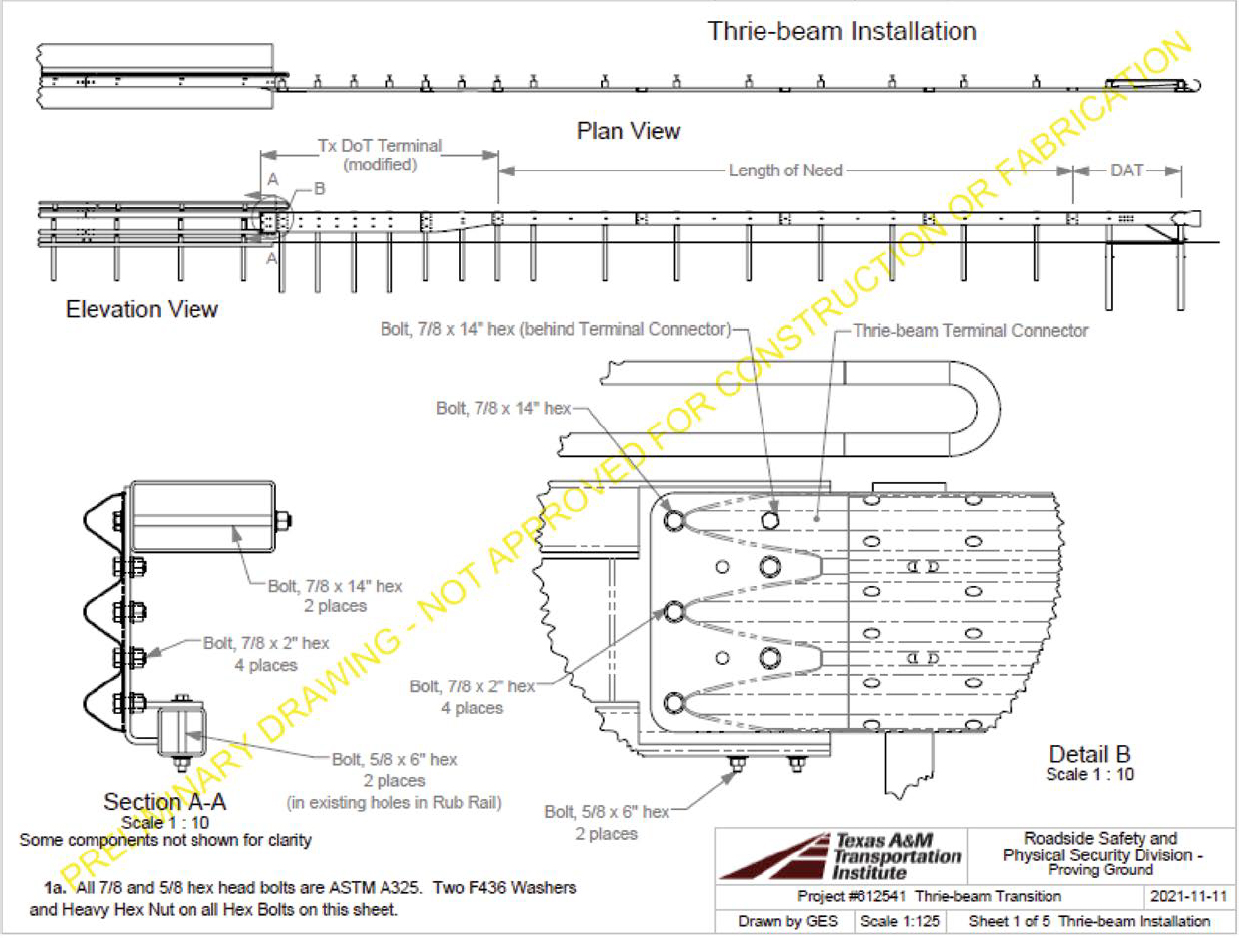
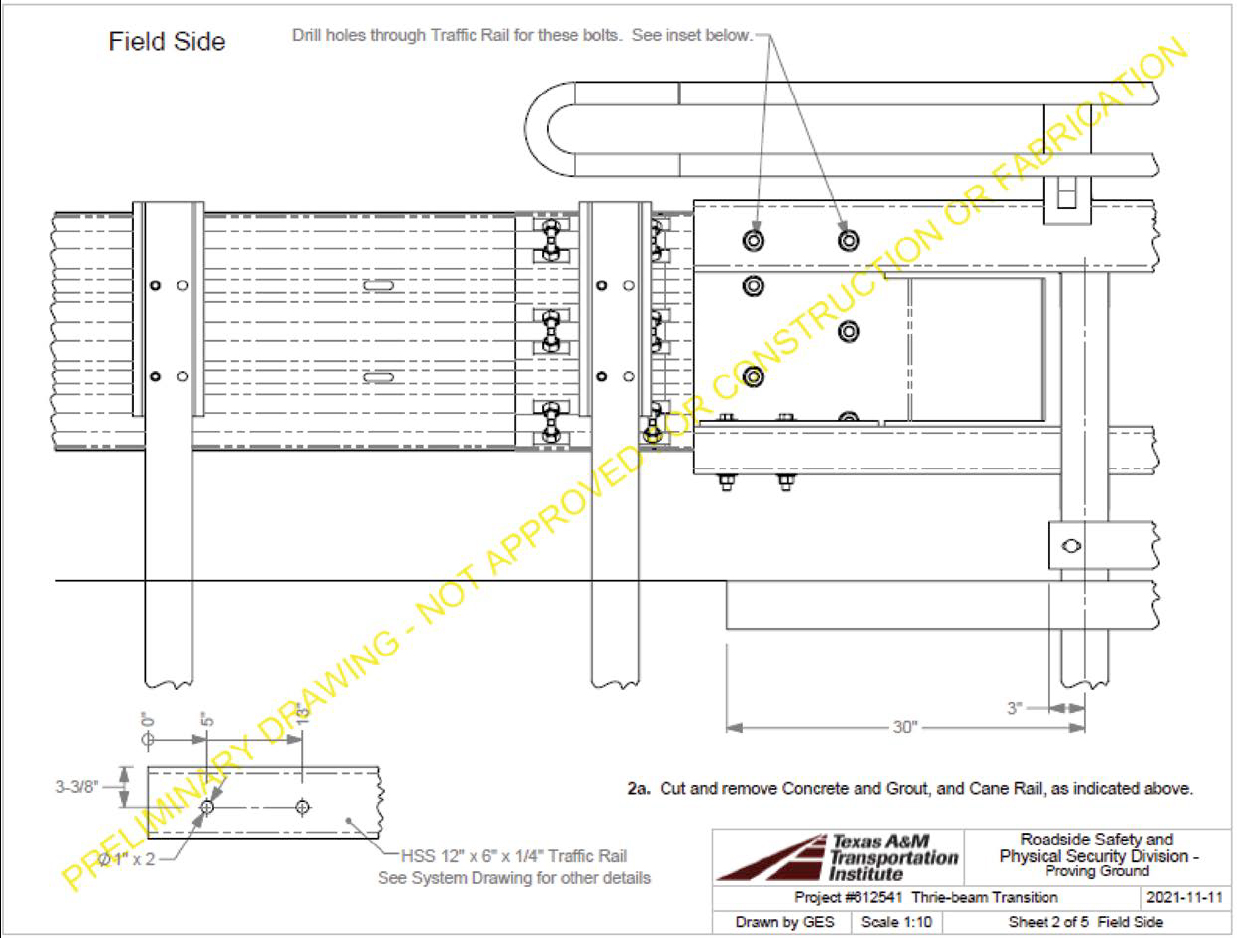
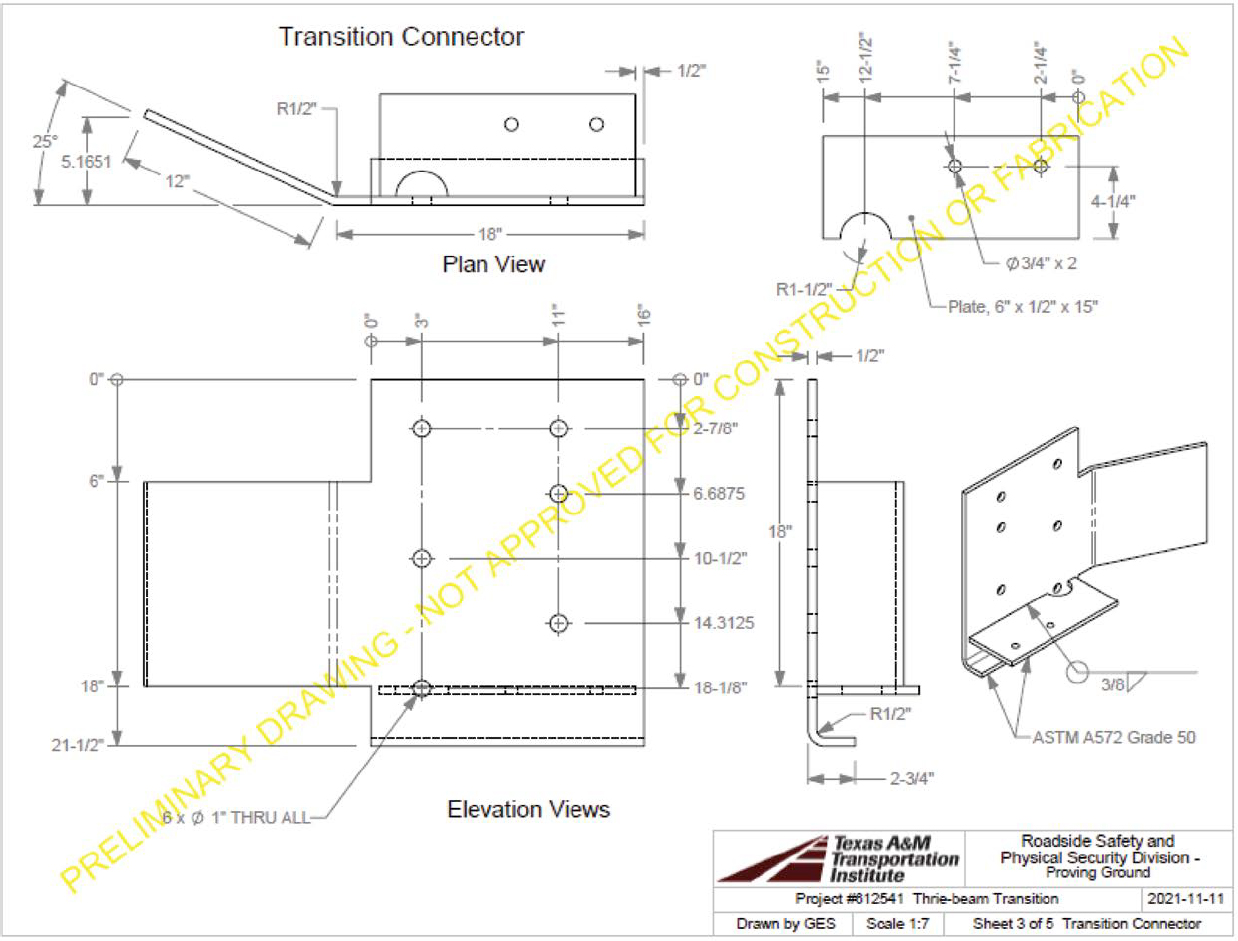
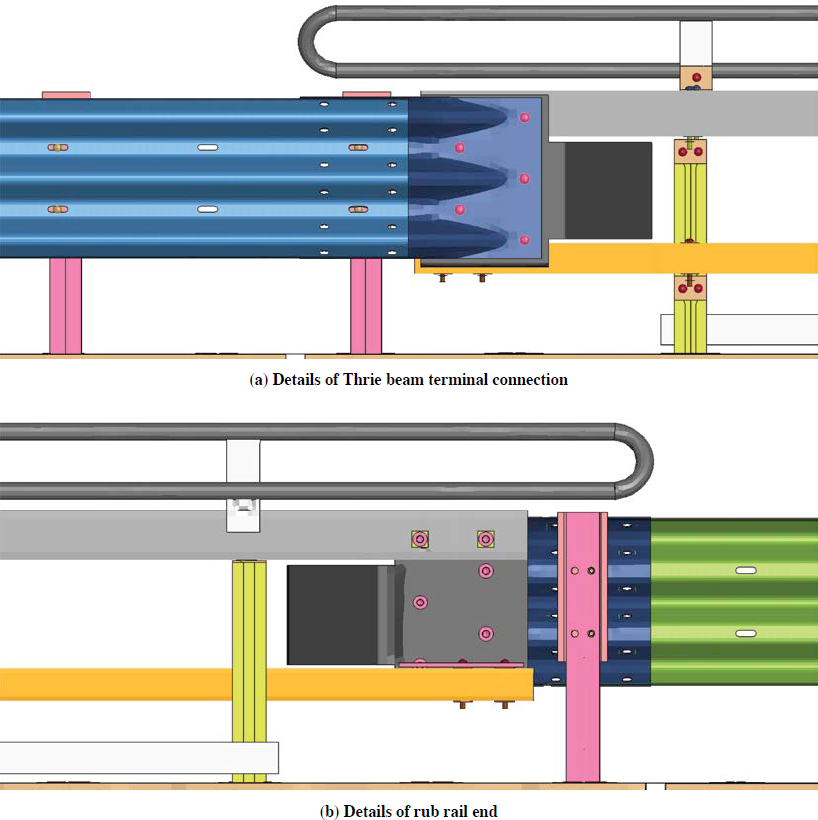
Figure 108 and Figure 109 show specific details of the connection between the Thrie beam and the multifunctional barrier. Two Thrie beam sections are nested and connected to the multifunctional barrier by the proposed transition connector, as shown in Figure 110. The rub rail of the multifunctional barrier (HSS 4 × 4 × ¼ × 30 in.) is terminated at the connector. The rub rail’s end is connected to the back of the connector, and the flared portion of the connector is designed to minimize interaction with an impacting vehicle. As the TxDOT Thrie beam transition suggested, 7-ft-long W6 × 8.5 steel posts and 6-ft-long W6 × 8.5 steel posts were used at the Thrie beam and at the asymmetric beam locations, respectively, with half-post spacing (3 ft 1.5 in.), as shown in Figure 112.
The cane rail ended behind the last post of the multifunctional LON barrier, while the traffic rail and handrail extended past the LON’s last post (see Figure 109). A terminal handrail component is suggested to connect the two handrails of the system’s LON, as shown in Figure 111. The upstream (W-beam portion) of the proposed design is the same as the TxDOT Thrie beam transition (Figure 112).
Figure 113 shows the general overview of the FE model of the proposed Thrie beam transition, while Figure 114 provides specific details of the FE model of the proposed transition. The overall modeling technique and material/contact properties were similar to those utilized and described in the discussion of the multifunctional LON barrier in Chapter 6.


Predictive Investigation of Crashworthiness of Transition
The research team conducted simulations to replicate the impact vehicles at various locations of the proposed Thrie beam transition. Since the passenger car (1100C) showed more critical behavior than the pickup truck (2270P), the passenger car simulations in accordance with MASH Test 3-20 were conducted prior to the pickup truck simulations. MASH recommends performing a parametric investigation of the critical location of impact, to identify the system CIP, which is the impact point that maximizes the risk of failure of the system’s crashworthiness.
MASH Test 3-20 Simulations (1100C)
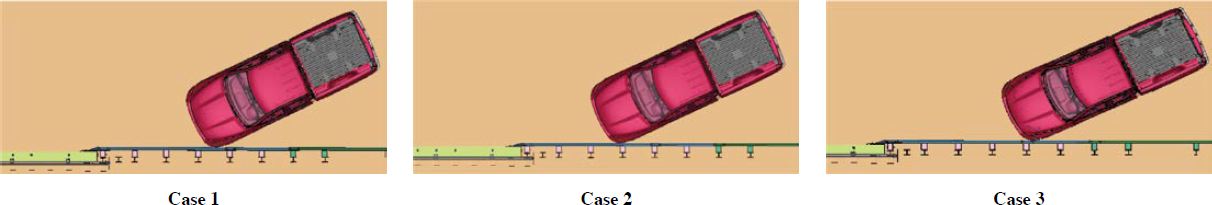
Since the upstream configuration of the proposed Thrie beam transition was the same as the TxDOT Thrie beam transition, the research team agreed to focus on investigating the system’s crashworthiness at its downstream location, that is, at the attachment between the transition and the multifunctional rail. A professional opinion is available for the upstream location (i.e., the connection between the transition and the W-beam guardrail LON) (34). Therefore, the downstream impact locations were selected for the preliminary CIP investigation. The following impact locations were considered in the investigation of the system’s crashworthiness during the 1100C impact (Figure 115):
- Case 1: Impact location = 1 ft upstream of fourth transition post.
- Case 2: Impact location = at fifth transition post.
- Case 3: Impact location = 1 ft downstream of fourth transition post.
The selection of the impact locations was based on previous transition design and testing experience. Cases were selected with the objective of maximizing the potential for vehicle instability and pocketing on the end of the multifunctional barrier (near the transition connection).
According to the computational investigation of downstream impact points (Cases 1, 2, and 3), the passenger car was successfully contained and redirected and maintained its stability throughout the impact event. Figures 116 through 118 show sequential frames of the impact simulations for Cases 1 through 3. Table 80 shows the summary of numerical and TRAP analysis results. The occupant risk factors for all cases met the MASH TL-3 evaluation criteria.
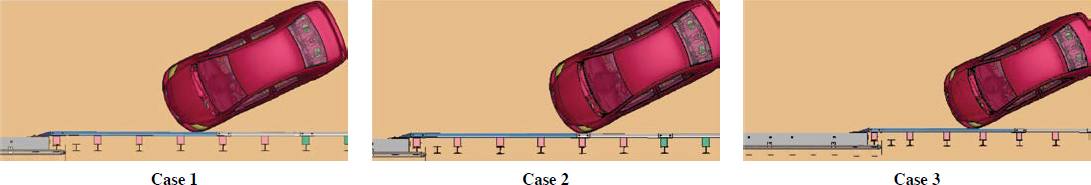
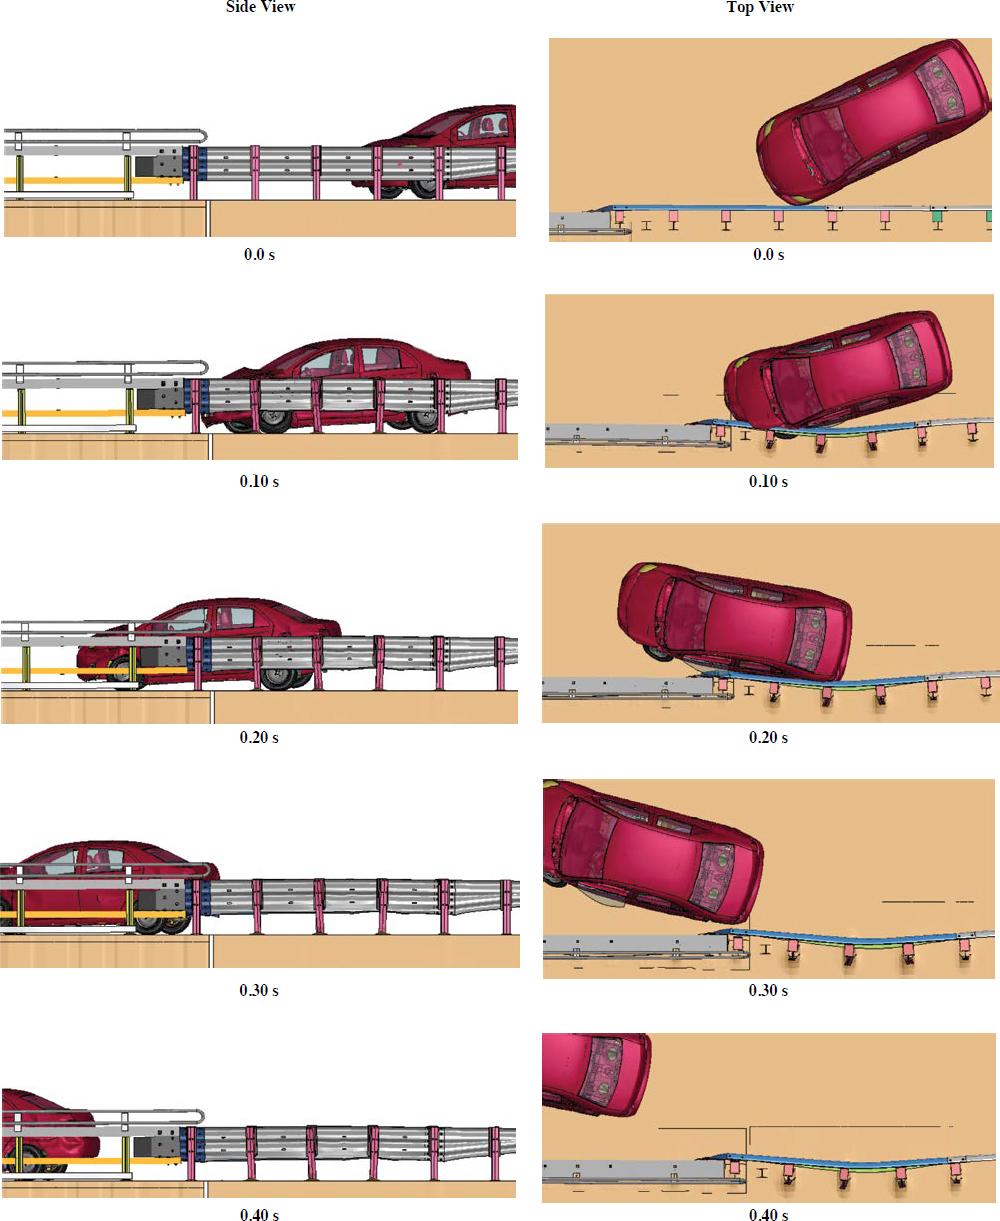
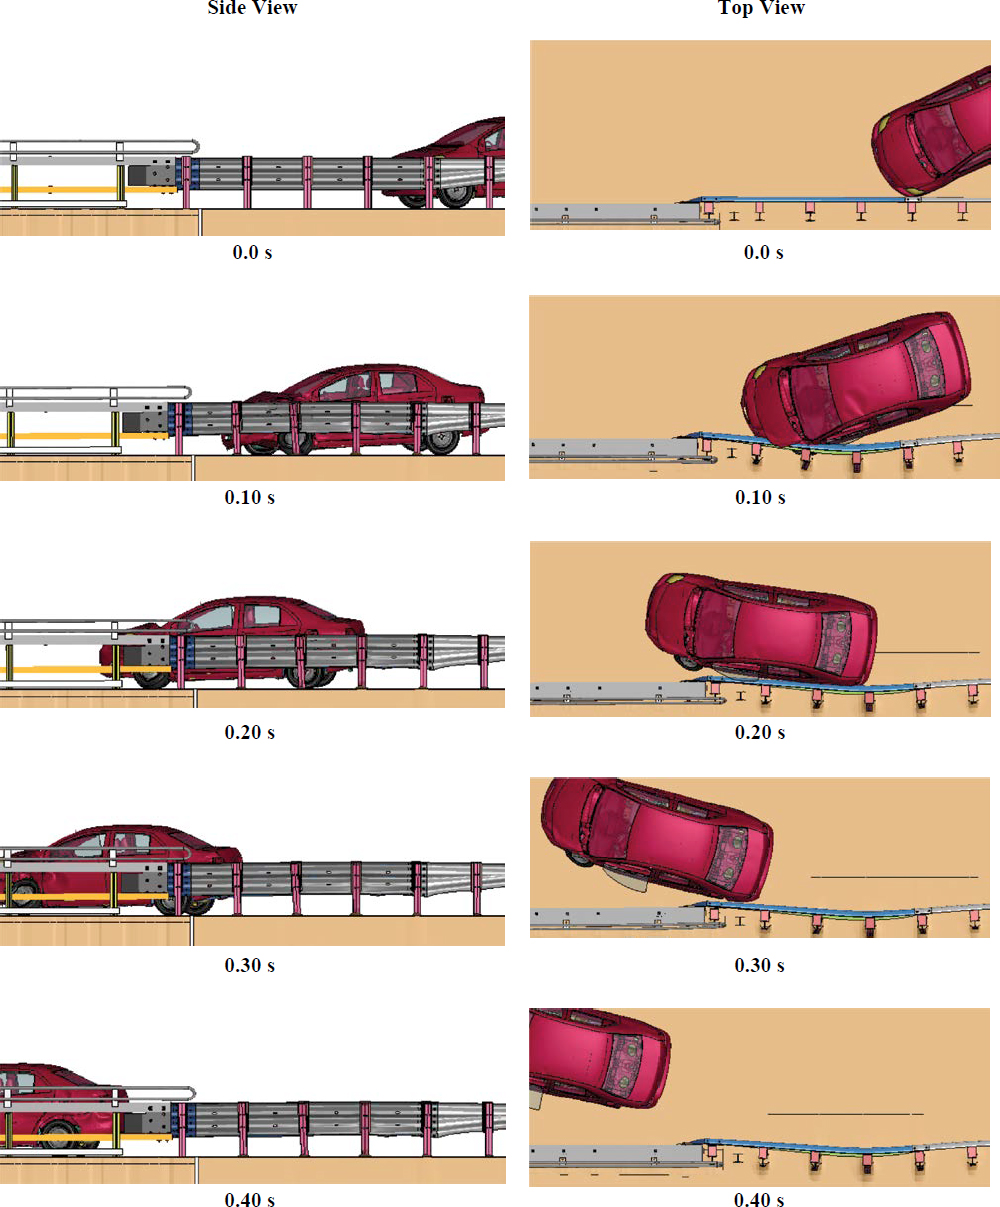
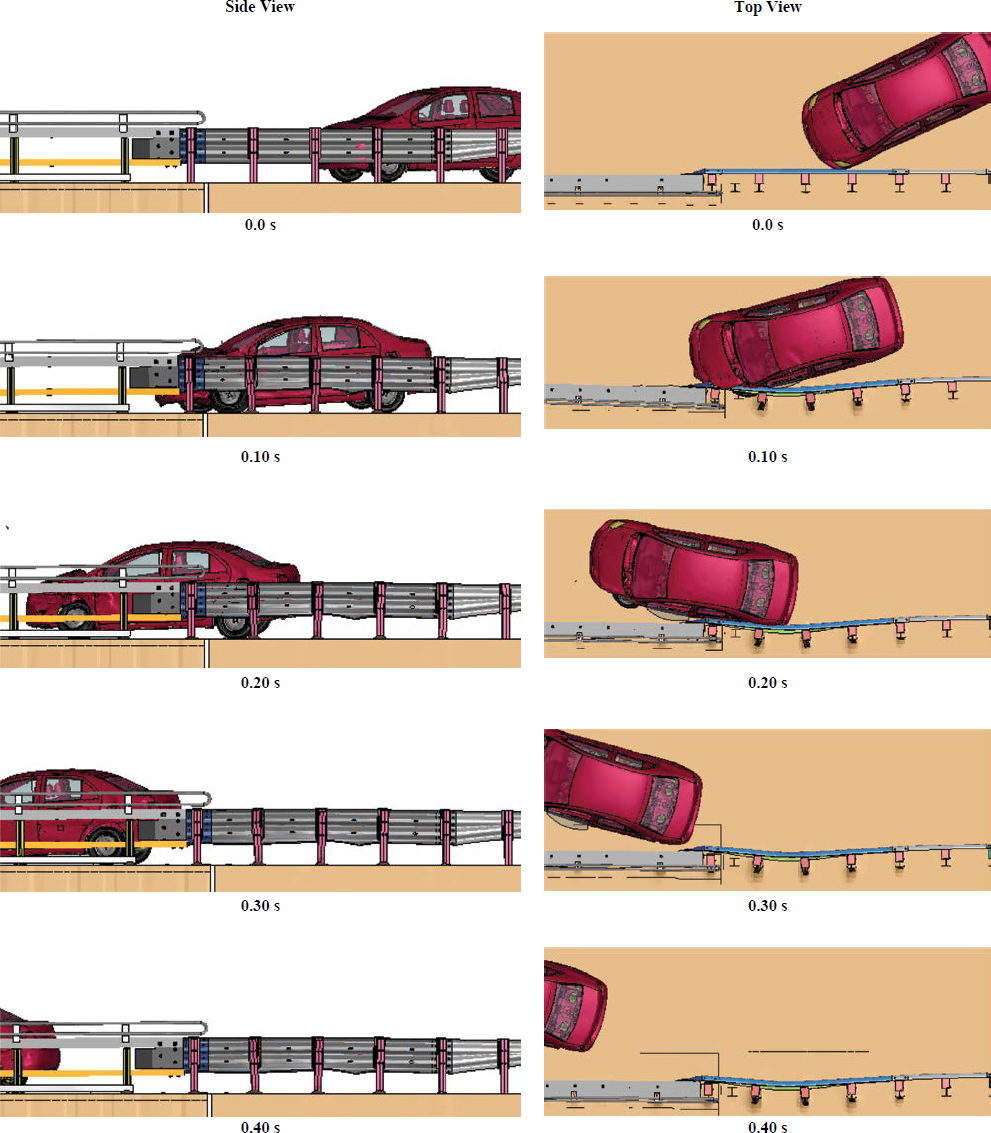
Table 80. Summary table of MASH Test 3-20 Thrie beam transition CIP analysis.
| Variable | Measurement | Variable | Measurement | Variable | Measurement |
|---|---|---|---|---|---|
| Case 1: 1100C—1 ft upstream of fourth transition post | Case 2: 1100C—fifth transition post | Case 3: 1100C—1 ft downstream of fourth transition post | |||
| Deflection (in.) | Deflection (in.) | Deflection (in.) | |||
| Dynamic | 12.05 | Dynamic | 11.5 | Dynamic | 12.1 |
| Permanent | 10.1 | Permanent | 9.6 | Permanent | 9.9 |
| OIV (ft/s) | OIV (ft/s) | OIV (ft/s) | |||
| X | 21.0 | X | 20.0 | X | 20.7 |
| Y | 27.2 | Y | 30.5 | Y | 29.9 |
| Stability (deg) | Stability (deg) | Stability (deg) | |||
| Roll | 3.2 | Roll | 2.5 | Roll | 3.3 |
| Pitch | 2.4 | Pitch | 2.5 | Pitch | 2.6 |
| Yaw | 39.8 | Yaw | 39.7 | Yaw | 41.4 |
| Ridedown acceleration (g) | Ridedown acceleration (g) | Ridedown acceleration (g) | |||
| X | 9.2 | X | 8.6 | X | 7.7 |
| Y | 16.2 | Y | 8.4 | Y | 9.4 |
The impact location for Case 2 allowed for more interaction with the end of the multifunctional LON barrier. However, the lateral ORA value for Case 1 was almost twice that recorded for Case 2. On the basis of the impact simulation results, Case 1 was determined to be the CIP for the passenger car crash tests.
MASH Test 3-21 Simulations (2270C)
Since the passenger car (1100C) met MASH TL-3 evaluation criteria, impact simulations for the pickup truck (2270P) were conducted to assess the crashworthiness of the proposed system with regard to pickup truck impact conditions and to investigate the proposed CIP for testing. For the same reason reported in the previous section regarding the passenger car investigation method, only downstream impact simulations were conducted to account for pickup truck impacts. The following impact locations were considered in the investigation of the system’s crashworthiness under 2270P impact (Figure 119):
- Case 1: Impact location = 2 ft downstream of fourth transition post.
- Case 2: Impact location = at fourth transition post.
- Case 3: Impact location = at fifth transition post.
The selection of the impact locations was based on previous transition design and testing experience. Cases were selected with the objective of maximizing the potential for vehicle instability and pocketing on the end of the multifunctional barrier (near the transition connection).
During all the simulations conducted with consideration of different CIPs, the pickup truck was successfully contained and redirected and maintained its stability during the impact event. Figures 120 through 122 show the sequential images of the impact simulations of the pickup truck (2270P). Table 81 shows the summary of numerical and TRAP analysis results. The occupant risk factors for all cases met the MASH TL-3 evaluation criteria. On the basis of the results of the simulations and the predicted interaction between the pickup truck and the system during impact, Case 1 was determined to be the most critical for consideration for full-scale testing.
Conclusion
The proposed Thrie beam transition system shows promise for meeting MASH requirements for both the pickup truck (MASH Test 3-21) and the passenger car (MASH Test 3-20) impacting at the downstream portion of the transition. On the basis of the simulation design, the CIP for the passenger car (1100C) and the pickup truck (2270P) is 1 ft upstream and 2 ft upstream of the fourth transition post, respectively.
As mentioned previously, the design and layout of the upstream configuration of this Thrie beam transition system are similar to the TxDOT Thrie beam transition. The upstream end of the TxDOT Thrie beam transition is considered MASH compliant on the basis of a professional opinion developed under the Roadside Safety Pooled Fund program (34). The research team recommends using the professional opinion developed for the TxDOT Thrie beam transition for the upstream end of the proposed transition. If testing of the upstream end of the proposed transition is desired, further funding will be needed to conduct the full-scale crash tests.


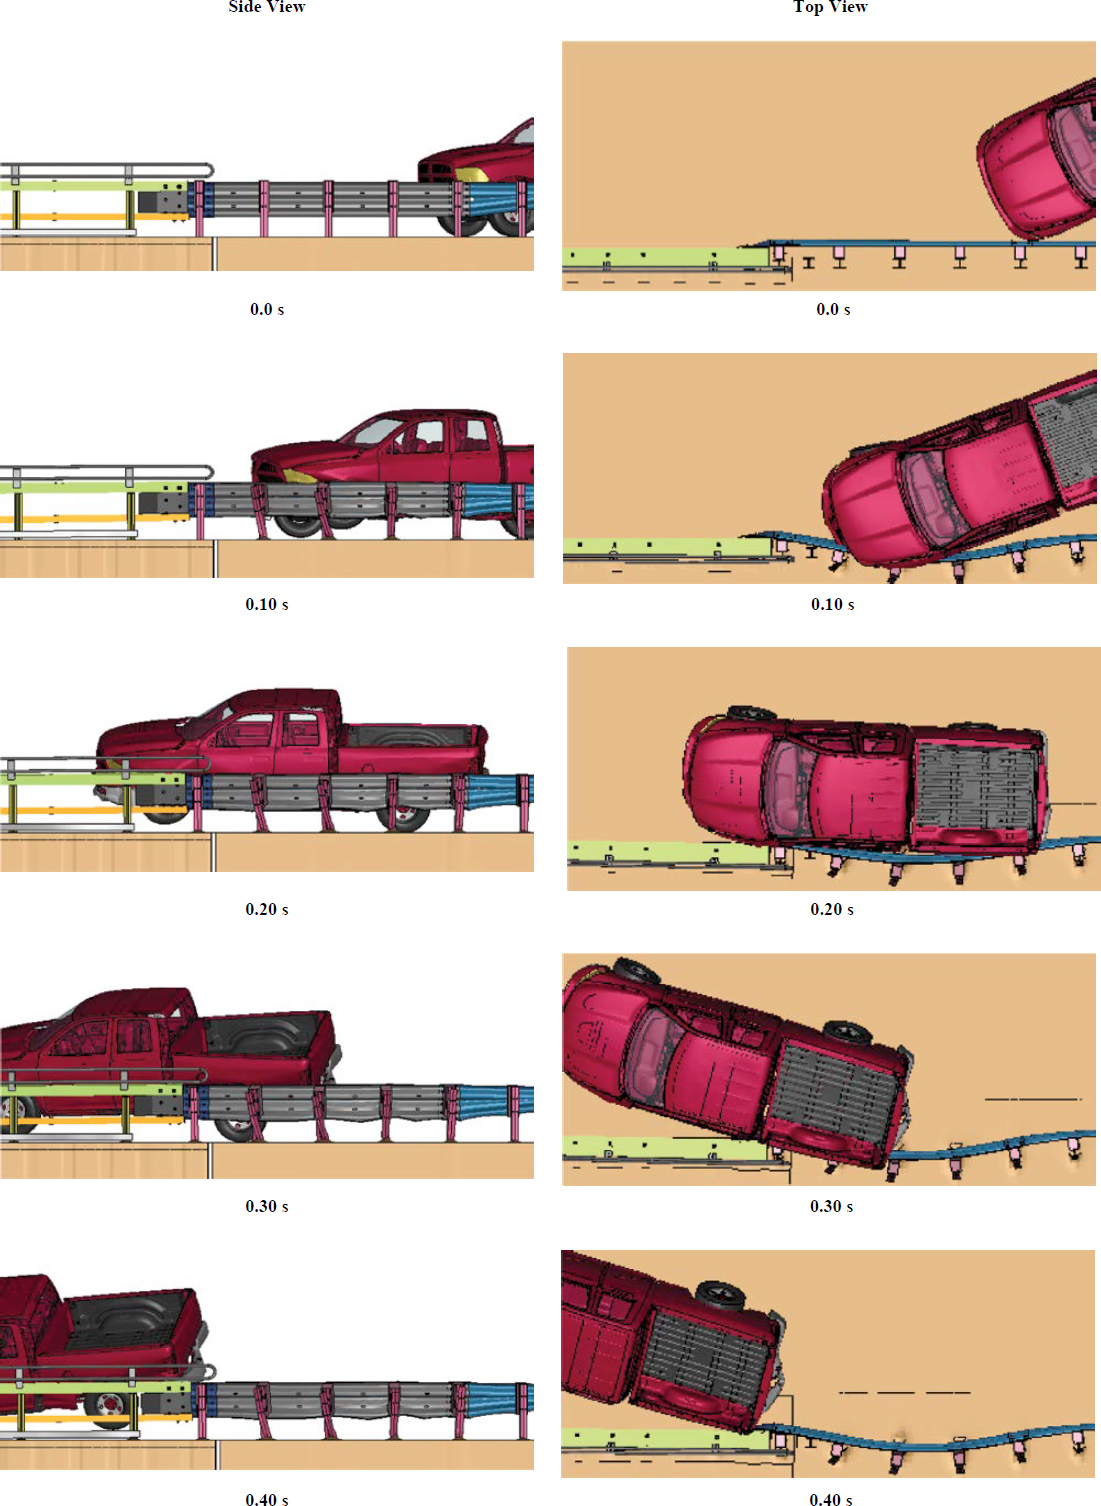
Table 81. Summary table of MASH Test 3-21 Thrie beam transition CIP analysis.
| Variable | Measurement | Variable | Measurement | Variable | Measurement |
|---|---|---|---|---|---|
| Case 1: 1100C—2 ft upstream of fourth transition post | Case 2: 1100C—fourth transition post | Case 3: 1100C—1 ft downstream of fourth transition post | |||
| Deflection (in.) | Deflection (in.) | Deflection (in.) | |||
| Dynamic | 19.3 | Dynamic | 20.4 | Dynamic | 19.1 |
| Permanent | 16.6 | Permanent | 17.6 | Permanent | 16.6 |
| OIV (ft/s) | OIV (ft/s) | OIV (ft/s) | |||
| X | 5.7 | X | 6.1 | X | 5.3 |
| Y | 7.0 | Y | 6.9 | Y | 7.1 |
| Stability (deg) | Stability (deg) | Stability (deg) | |||
| Roll | 33.6 | Roll | 25.0 | Roll | 36.4 |
| Pitch | 6.9 | Pitch | 7.4 | Pitch | 5.8 |
| Yaw | 42.7 | Yaw | 35.4 | Yaw | 42.1 |
| Ridedown acceleration (g) | Ridedown acceleration (g) | Ridedown acceleration (g) | |||
| X | 5.9 | X | 8.7 | X | 7.4 |
| Y | 11.0 | Y | 8.0 | Y | 11.6 |


