Development of a MASH Barrier to Shield Pedestrians, Bicyclists, and Other Vulnerable Users from Motor Vehicles (2024)
Chapter: 5 Finite Element Computer Modeling and Calibration

CHAPTER 5
Finite Element Computer Modeling and Calibration
This chapter discusses the finite element (FE) modeling aspect of this project. As discussed earlier, calibration of the new developed model was required to verify whether the system would behave realistically. Before using LS-PrePost to develop the FE model, the researchers needed to calibrate the model and confirm that the modeling techniques, contacts, material cards, and other information to be used in the final model would give realistic results and replicate the interaction between the systems and vehicles. To do this, they compared the results obtained from the calibration models with actual crash tests done in the past. This chapter discusses the calibration simulations and results obtained. Calibration tests were performed to determine the behavior of the steel HSS, steel connections, and concrete mow strip to be used in the new developed model. This chapter is broadly divided into three parts: (a) calibration of the HSS model, (b) mow strip calibration, and (c) the multifunctional barrier model and validation.
Calibration of the HSS Model
The LS-DYNA FE software package was used to simulate the behavior of vehicular impacts with a steel median barrier system. LS-DYNA is an all-purpose, explicit FE analysis code. It is extensively used to simulate the nonlinear, dynamic response of three-dimensional problems and to capture the intricate interactions of a vehicle with a Triborough Bridge and Tunnel Authority (TBTA) steel bridge rail system. LS-DYNA is also capable of producing dynamic load time history responses for any impact. Before modeling the actual system, the researchers used an earlier study by TTI to calibrate the LS-DYNA FE analysis model (N. M. Sheikh, W. L. Menges, and D. L. Kuhn, “MASH TL-5 Testing and Evaluation of the TBTA Bridge Rail, No. 603911-1,” unpublished report, TTI, 2017; see also 32). LS-DYNA was used to perform critical impact simulations that used the developed sign support system and available vehicle models.
Finite Element Computer Models for HSS Calibration
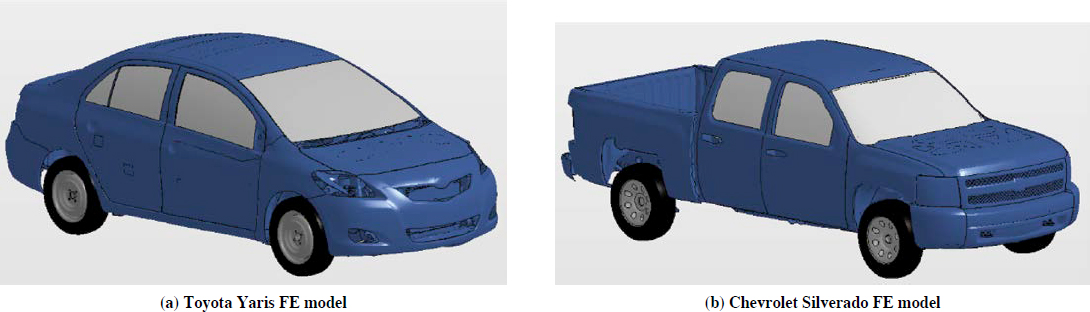
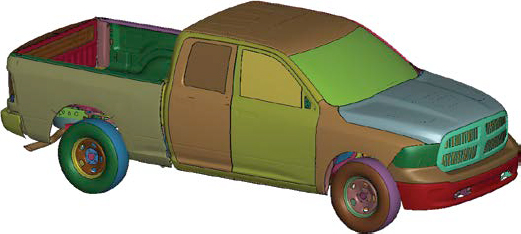
Figure 44 illustrates the available FE vehicle models. These models include (a) the Toyota Yaris model, representing a 2,420-lb (1100C) MASH small car test vehicle and (b) the Chevrolet Silverado model, representing a 5,000-lb (2270P) MASH pickup truck test vehicle.
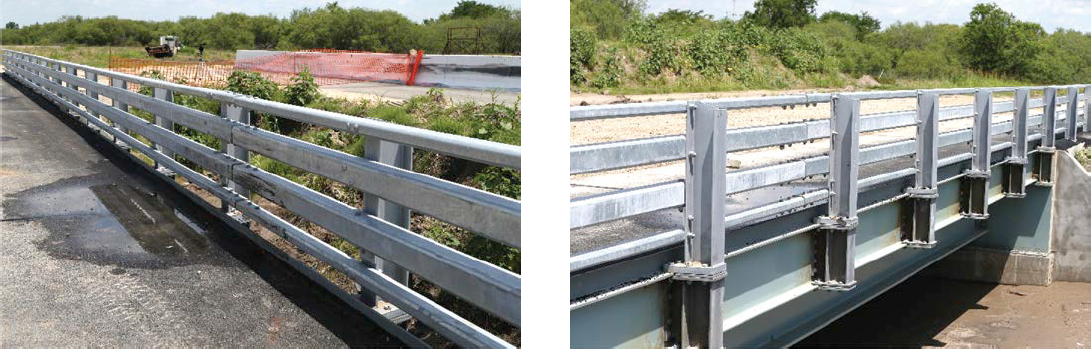
The researchers used a TBTA steel bridge rail tested for HNTB New York Engineering and Architecture, P.C., under the aforementioned TTI project for calibration of the LS-DYNA FE model (N. M. Sheikh, W. L. Menges, and D. L. Kuhn, “MASH TL-5 Testing and Evaluation of the TBTA Bridge Rail, No. 603911-1,” unpublished report, TTI, 2017; see also 32). Figure 45 illustrates the actual constructed TBTA bridge rail. In the TBTA project, MASH Tests 5-10 and 5-11 were conducted on the TBTA steel bridge rail system because of the high volume of freight traffic on the bridge where it would be located. The tests were only used to calibrate the FE models. To calibrate
the results of the developed model in LS-DYNA, vehicle impact behavior and stability as well as occupant risk factors upon vehicle impact were compared.
The Test Risk Assessment Program (TRAP) was used to evaluate vehicle stability, occupant risk, and structural adequacy. Vehicle angular velocities, also known as roll, pitch, and yaw angles, were used to evaluate vehicle stability. MASH specifies that the maximum roll and pitch angles should not exceed 75 deg. Occupant risk describes the risk of hazard to occupants. It was evaluated on the basis of the data collected by the accelerometer located at the center of gravity (CG) in the vehicle. Two factors were mainly analyzed in preliminary simulations on the basis of the acceleration data: occupant impact velocity (OIV) and occupant ridedown acceleration (ORA). OIV and ORA are, respectively, the changes in velocity that the hypothetical occupant feels at impact and the acceleration from the collision just after impact. MASH requires the OIV to be lower than 40 ft/s and the ORA to be less than 20.49 g (acceleration due to gravity) in the longitudinal and lateral directions.
A 2010 Kia Rio passenger car and 2010 Dodge Ram 1500 pickup truck were used in the full-scale crash tests. The actual impact speed and angle for both the tests were 62 mi/h and 25 deg, respectively.
LS-PrePost was used to develop a TBTA steel bridge rail. A steel bridge rail was developed with multiple different material and section properties. W-sections were modeled with MAT024 (Piecewise Linear Plasticity) to define the material properties of the steel posts. MAT024 was also used to define the material properties of the base plates and both HSS sections. Constrained
Nodal Rigid Body (CNRB) connections were used to connect the base plates to the W-section and the HSS sections to the W-sections. Figure 46 shows the LS-DYNA model of the TBTA steel bridge rail system used for calibration.
MASH Test 5-10 Calibration (Test 603911-1)
The researchers used a validated Toyota Yaris FE model to represent the test vehicle. The weight of the Toyota Yaris model was similar to that of the Kia Rio used in the actual crash test. The test vehicle’s actual impact speed and angle orientation were implemented in the computer simulation. Figure 47 shows sequential photos of the simulated impact event and compares frames from the actual full-scale crash test with the calibrated computer model’s simulation of the impact. Table 36 summarizes occupant risk, vehicle stability information, and system deflection values from the comparison between the actual crash test and the simulated impact event.
MASH Test 5-11 Calibration (Test 603911-2): Passenger-Side Impact
The researchers used a validated Chevrolet Silverado FE model to represent the test vehicle. The weight of the Silverado model was similar to that of the Dodge Ram used in the actual crash test. The test vehicle’s actual impact speed and angle orientation were implemented in the computer
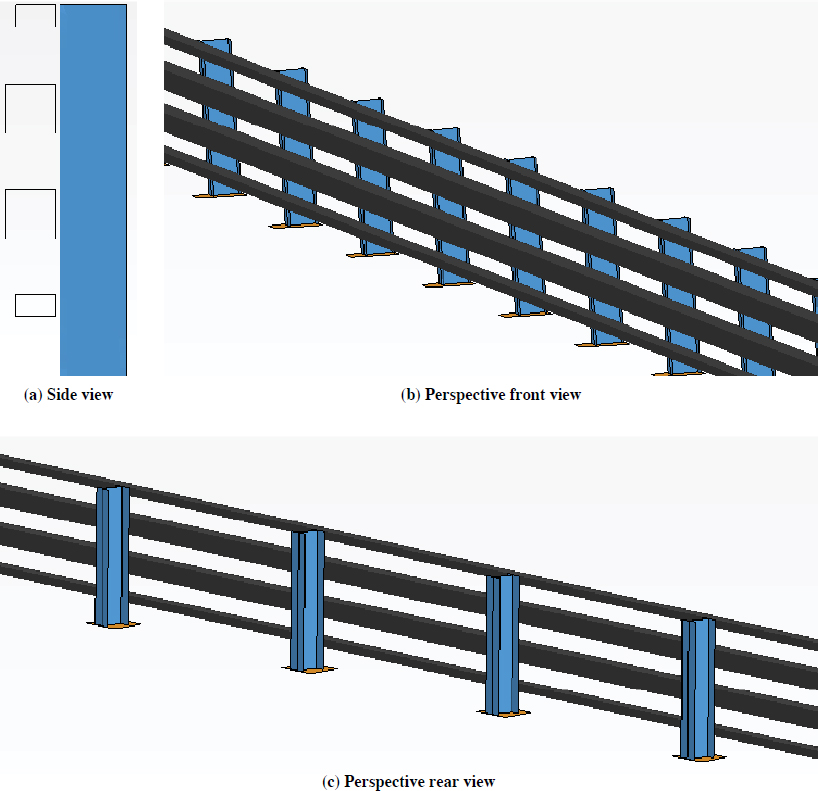

Table 36. Comparison of test results (occupant risk factors) from full-scale crash test (Test 5-10) and FE impact simulation.
| Occupant Risk Factor | Actual Crash Test | FE Simulation |
|---|---|---|
| Impact velocity (ft/s) | ||
| X | 22.0 | 20.59 |
| Y | 34.8 | −30.43 |
| Ridedown acceleration (g) | ||
| X | 4.1 | −4.3 |
| Y | 10.9 | 21.9 |
| THIV (km/h) 44.8 42.7 | ||
| PHD (g) | 10.9 | 21.9 |
| ASI | 2.82 | 2.6 |
| Maximum 0.050-s average (g) | ||
| X | −13.1 | −13.3 |
| Y | 21.2 | 20.2 |
| Vertical | 3.2 | 4.8 |
| Maximum angle (deg) | ||
| Roll | 9 | 11.5 |
| Pitch | 8 | 2.2 |
| Yaw | 74 | 35.7 |
Note: THIV = theoretical head impact velocity; PHD = peak head deceleration; ASI = acceleration severity index.
simulation. Figure 48 compares frames from the actual full-scale crash test and the calibrated computer model’s simulation of the impact. Table 37 summarizes occupant risk, vehicle stability information, and system deflection values from the comparison between the actual crash test and the simulated impact event.
Conclusion
A comparison of LS-DYNA simulation results and actual crash test values revealed that the computer models (system and vehicle) could be considered calibrated. The results from the simulated impact events closely matched those from the actual crash test events. The ridedown acceleration value was slightly over predicted in the computer model as compared with the result obtained through the full-scale crash test. Generally, however, the FE model closely replicated the testing outcomes in terms of vehicle stability and general behavior during the impact event.
Validation of the Mow Strip Model
The LS-DYNA FE software package was used to simulate the behavior of vehicular impacts with a steel barrier system embedded in a mow strip and soil. As noted previously, LS-DYNA is an all-purpose, explicit FE analysis code. It is extensively used to simulate the nonlinear, dynamic response of three-dimensional problems and to capture the intricate interactions of a vehicle with a steel guardrail system. LS-DYNA is also capable of producing dynamic load-time history responses for any impact. Before modeling the actual system, the researchers used the earlier study by TTI to calibrate the LS-DYNA FE analysis model (N. M. Sheikh, W. L. Menges, and D. L. Kuhn,
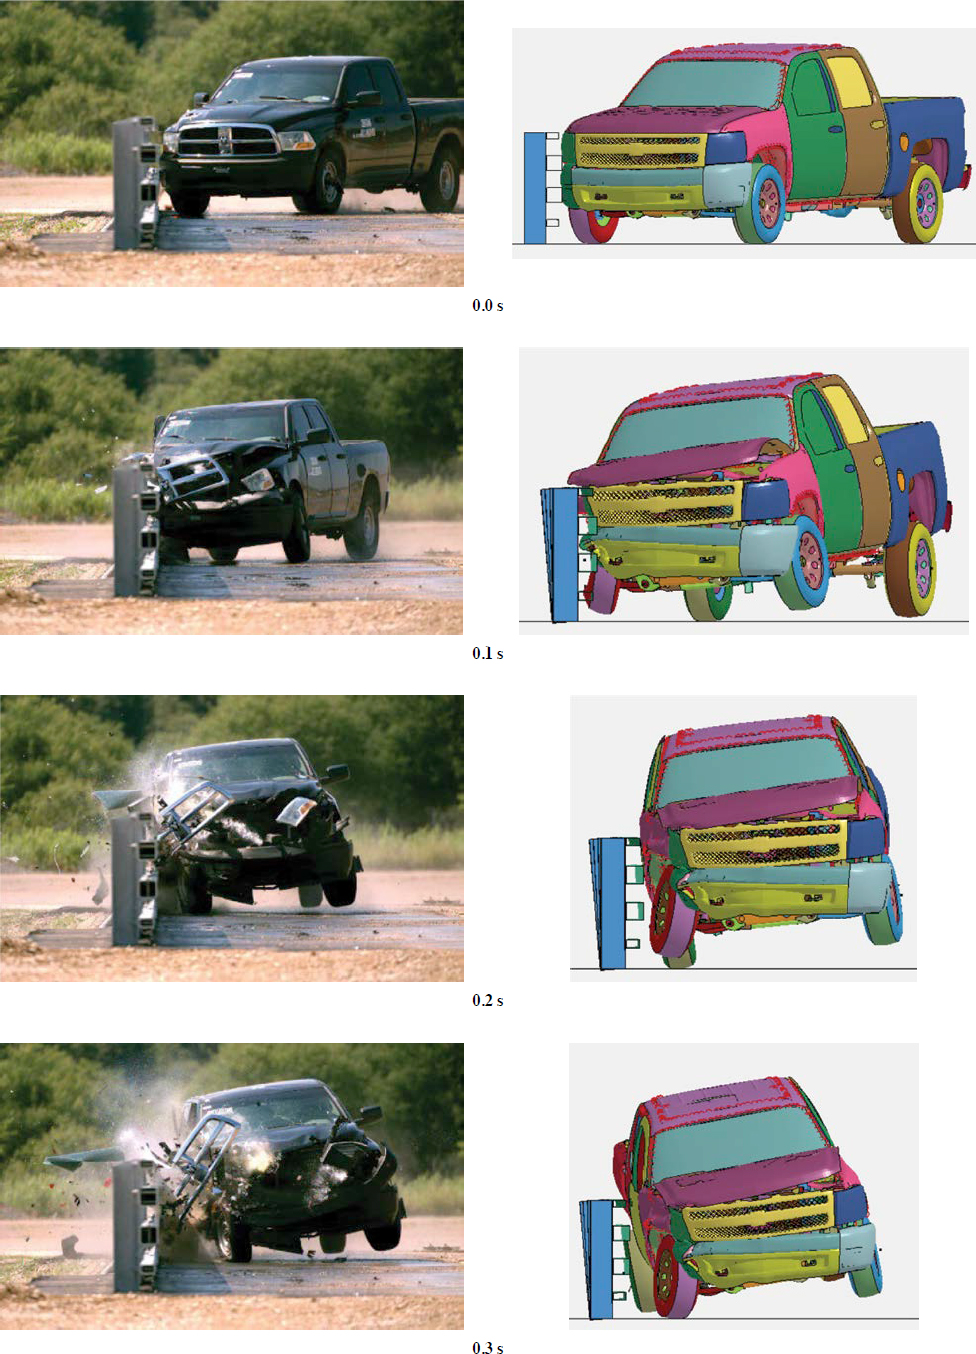
Table 37. Comparison of test results (occupant risk factors) from full-scale crash test (Test 5-11) and FE impact simulation on the passenger side.
| Occupant Risk Factor | Actual Crash Test | FE Simulation |
|---|---|---|
| Impact velocity (ft/s) | ||
| X | 17.4 | 28.2 |
| Y | 28.5 | −28.2 |
| Ridedown acceleration (g) | ||
| X | 6.0 | −15.9 |
| Y | 10.7 | 14.7 |
| THIV (km/h) | 44.8 | 37.1 |
| PHD (g) | 10.9 | 10.8 |
| ASI | 2.82 | 1.92 |
| Max 0.050-s average (g) | ||
| X | −8.5 | −13.3 |
| Y | −15.2 | 14.2 |
| Vertical | 2.8 | 3.8 |
| Maximum angle (deg) | ||
| Roll | 10 | 11.3 |
| Pitch | 4 | 16.9 |
| Yaw | 43 | 30.3 |
“MASH TL-5 Testing and Evaluation of the TBTA Bridge Rail, No. 603911-1,” unpublished report, TTI, 2017; see also 32). LS-DYNA was used to perform critical impact simulations that used the developed system and available vehicle models.
MASH Test 5-11 Calibration (Test 603911-2): Driver Side Impact
For more accurate calibration, the researchers also validated the driver side of the pickup truck for MASH Test 5-11. The test vehicle’s actual impact speed and angle orientation were implemented in the computer simulation. Figure 49 compares frames from the actual full-scale crash test and the calibrated computer model’s simulation of the impact. Table 38 summarizes occupant risk, vehicle stability information, and system deflection values from the comparison between the actual crash test and the simulated impact event.
Finite Element Mow Strip Model
Figure 50 illustrates the available FE vehicle model, a 2018 Dodge Ram model representing a 5,000-lb (2270P) MASH pickup truck test vehicle.
The researchers used a 31-in. W-beam guardrail system with steel posts in a concrete mow strip, as tested by TTI (28) to calibrate the LS-DYNA FE analysis model. The researchers at TTI conducted MASH Tests 5-10 and 5-11 on this guardrail system, which was used to calibrate the results of the developed system in LS-DYNA by comparing vehicle impact behavior and stability as well as occupant risks and performance upon vehicle impact.
TRAP was used to evaluate vehicle stability, occupant risk, and structural adequacy. Vehicle angular velocities, also known as roll, pitch, and yaw angles, were used to evaluate vehicle stability. MASH specifies that the maximum roll and pitch angles should not exceed 75 deg. Occupant risk describes the risk of hazard to occupants. It was evaluated on the basis of the data collected by the

Table 38. Comparison of test results (occupant risk factors) from full-scale crash test (Test 5-11) and FE impact simulation on the driver side.
| Occupant Risk Factor | Actual Crash Test | FE Simulation |
|---|---|---|
| Impact velocity (ft/s) | ||
| X | 17.4 | 21.648 |
| Y | 28.5 | 29.192 |
| Ridedown acceleration (g) | ||
| X | 6.0 | −5.7 |
| Y | 10.7 | −16.9 |
| THIV (km/h) | 44.8 | 37.1 |
| PHD (g) | 10.9 | 10.8 |
| ASI | 2.82 | 1.92 |
| Max 0.050-s average (g) | ||
| X | −8.5 | −11.6 |
| Y | −15.2 | −15 |
| Vertical | 2.8 | 2.9 |
| Maximum angle (deg) | ||
| Roll | 10 | −12.8 |
| Pitch | 4 | 9 |
| Yaw | 43 | 31.5 |
accelerometer located at the CG in the vehicle. Two factors were mainly analyzed in preliminary simulations through the acceleration data: OIV and ORA. OIV and ORA are, respectively, the change in velocity that the hypothetical occupant feels at impact and the acceleration from the collision just after impact. MASH requires the OIV to be lower than 40 ft/s and ORA to be less than 20.49 g in the longitudinal and lateral directions.
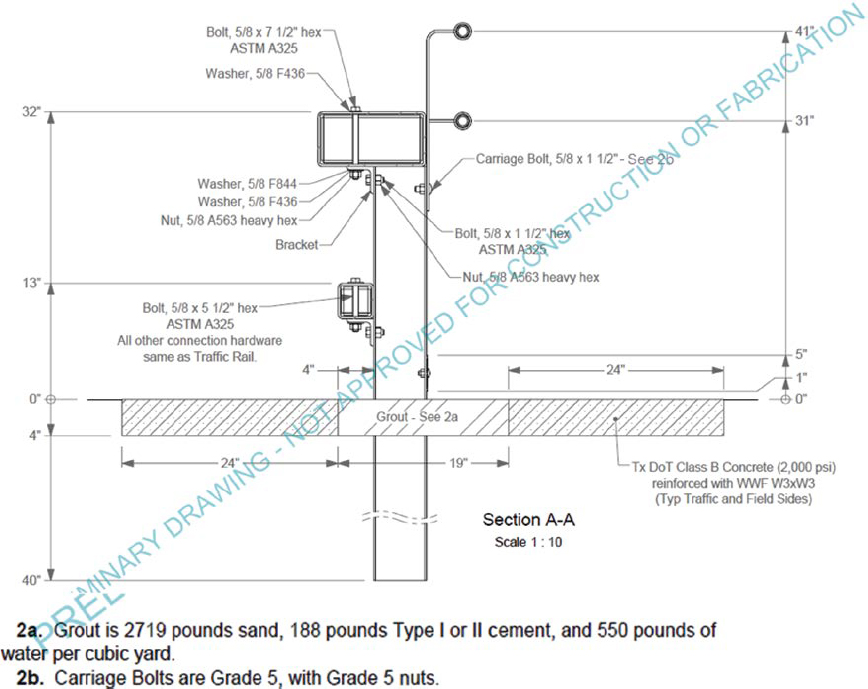
The test article developed by Sheikh et al. (28) consisted of a 31-in. W-beam guardrail with steel posts. The guardrail system was installed with 26 posts, with 16 posts in the concrete mow strip. Figure 51 is a drawing of the actual installation.
A standard 12-gauge W-beam rail was provided. The top of the W-beam was 31 in. above the ground, and the posts were spaced at 6 ft 3 in. A 10-in. bolt was used to attach 8-in. wood (timber) blockouts to the posts to keep the rail and blockout attached to the posts. Guardrail posts with section W6 × 8.5 ASTM A36 structural steel were used. The embedment of the posts was 40 in. deep in the soil.
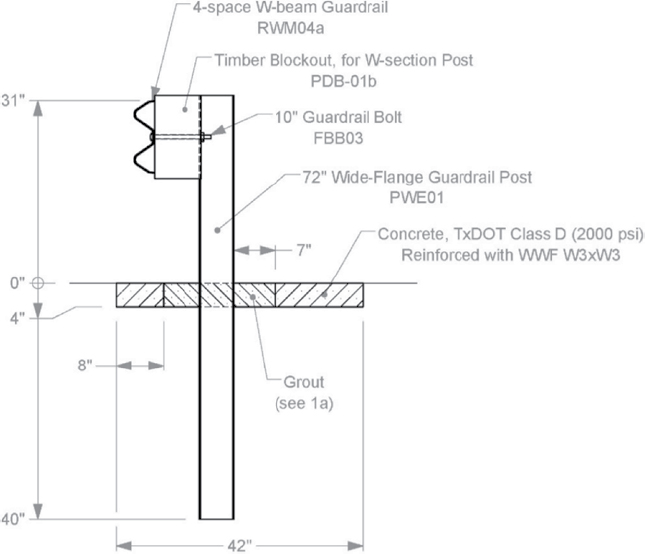
The concrete mow strip was 100 ft long, 42 in. wide, and 4 in. thick. Each post had a 19-in. square leave-out. Leave-outs were allocated 8 in. from the traffic-side edge of the strip. Posts were installed with a back face edge distance of 7 in. from the leave-outs. After installation of the posts and strip, the 4-in. deep leave-outs were filled with low-strength grout.
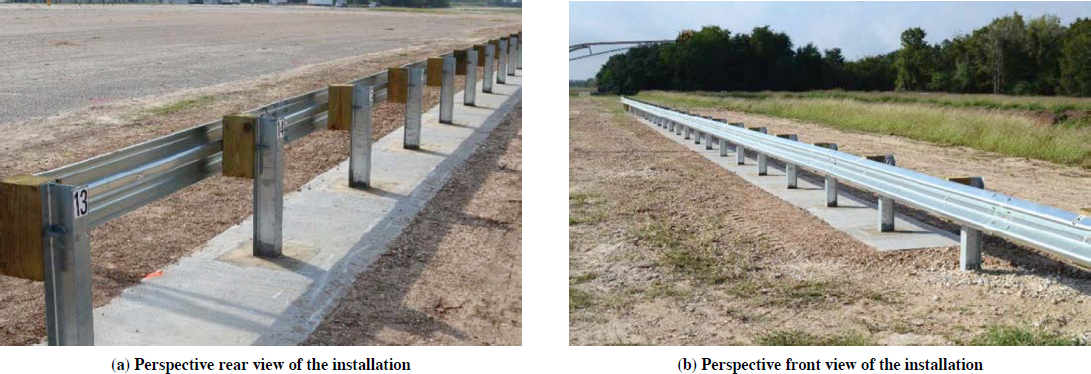
The material properties of the concrete and grout were assessed before the test. The specified concrete strength of the mow strip was 3 ksi. The grout strength was 150 psi on the date of the first test. Figure 52 provides the installation pictures before the test was performed.
The FE model was developed by replicating the test installation used in the study by Sheikh et al. (28). The spacing and dimensions of the posts were kept the same as those in the actual installation. The section property assigned in the software keywords was used to replicate the dimensions
of the actual test article. Thus, FE steel posts with section properties of W6 × 8.5 steel were used with 40 in. of embedment in soil. Further, the dimensions of the grout around the post were kept approximately the same as those of the actual installation. The depth of the concrete mow strip was kept at 4 in. The 8-in. wood blockout was also used with the same section properties. A W-beam rail was used with a 12-gauge steel section property with splices in the middle of the two posts.
The steel posts, W-beam rail, and bolt exteriors were provided with shell elements. The blockout, soil, grout, and mow strip concrete layer were provided with solid elements. CNRB elements were used for the bolts keeping the rail and blockout attached to posts. Discrete mass elements were used at the ends of the longitudinal rail to provide a simulated end terminal effect in an effort to restrain the free movement of the ends. The bolt center was provided with beam element with nodes to tie the constrained nodes to the center of the bolt axis.
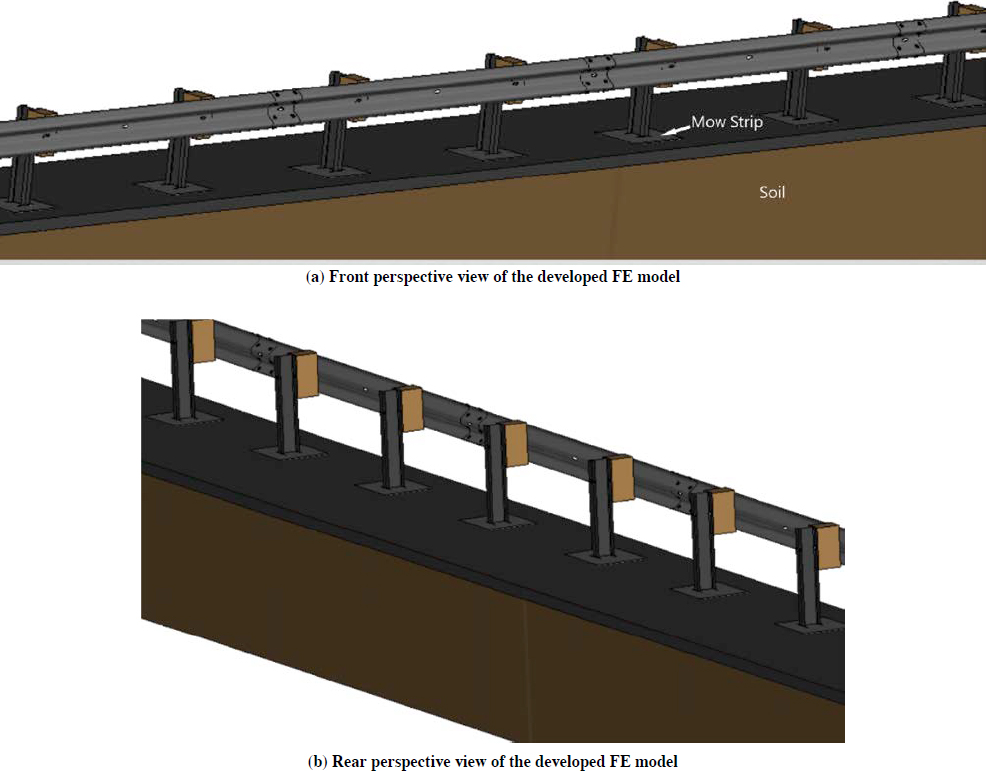
Material properties of the model were provided on the basis of the anticipated behavior of the model compared with the actual testing. A material property representing linear plasticity was used for steel bolts, W-beam, and steel posts. For the concrete mow strip, rigid body elements were used. Springs or discrete mass elements were used instead of an anchorage system at the ends of the rail. Soil, wood block out, and concrete for the grout leave-outs near the posts were used with their corresponding material properties. Figure 53 shows the perspective views of the developed model in LS-PrePost.
MASH Test 3-11 Calibration
The researchers used a validated 2018 Dodge Ram FE model to represent the test vehicle. The weight of the Dodge Ram model was similar to that of the crash-tested Dodge Ram. The test vehicle’s actual impact speed and angle orientation were implemented in the computer simulation. Figure 54 provides some frames from the results of the predictive impact simulation. Materials such as MAT_072, MAT_084, MAT_159, MAT_272, and MAT_273 were considered to determine the material properties of the grout and mow strip concrete.
After performing several simulations with the material combinations mentioned above, the researchers changed the material properties of the grout and mow strip on the basis of the results obtained. Several errors were obtained due to the constraints of the material card used in the model, so the material properties had to be altered to eliminate the errors. After eliminating the errors, the researchers verified whether the behavior of the soil, mow strip, and grout was realistic and if it could be compared with the actual crash test.
The latest results were obtained by using the MAT_025 Geologic Cap Model for the grout and MAT_159 Continuous Surface Cap Model (CSCM) Concrete for the mow strip. The impact location, speed, and angle were kept the same as for the actual test. Figure 55 and Figure 56 show sequential images comparing the actual crash test and simulation results for the grout/mow strip calibration model. These figures show that the behavior of the FE model was similar to the actual

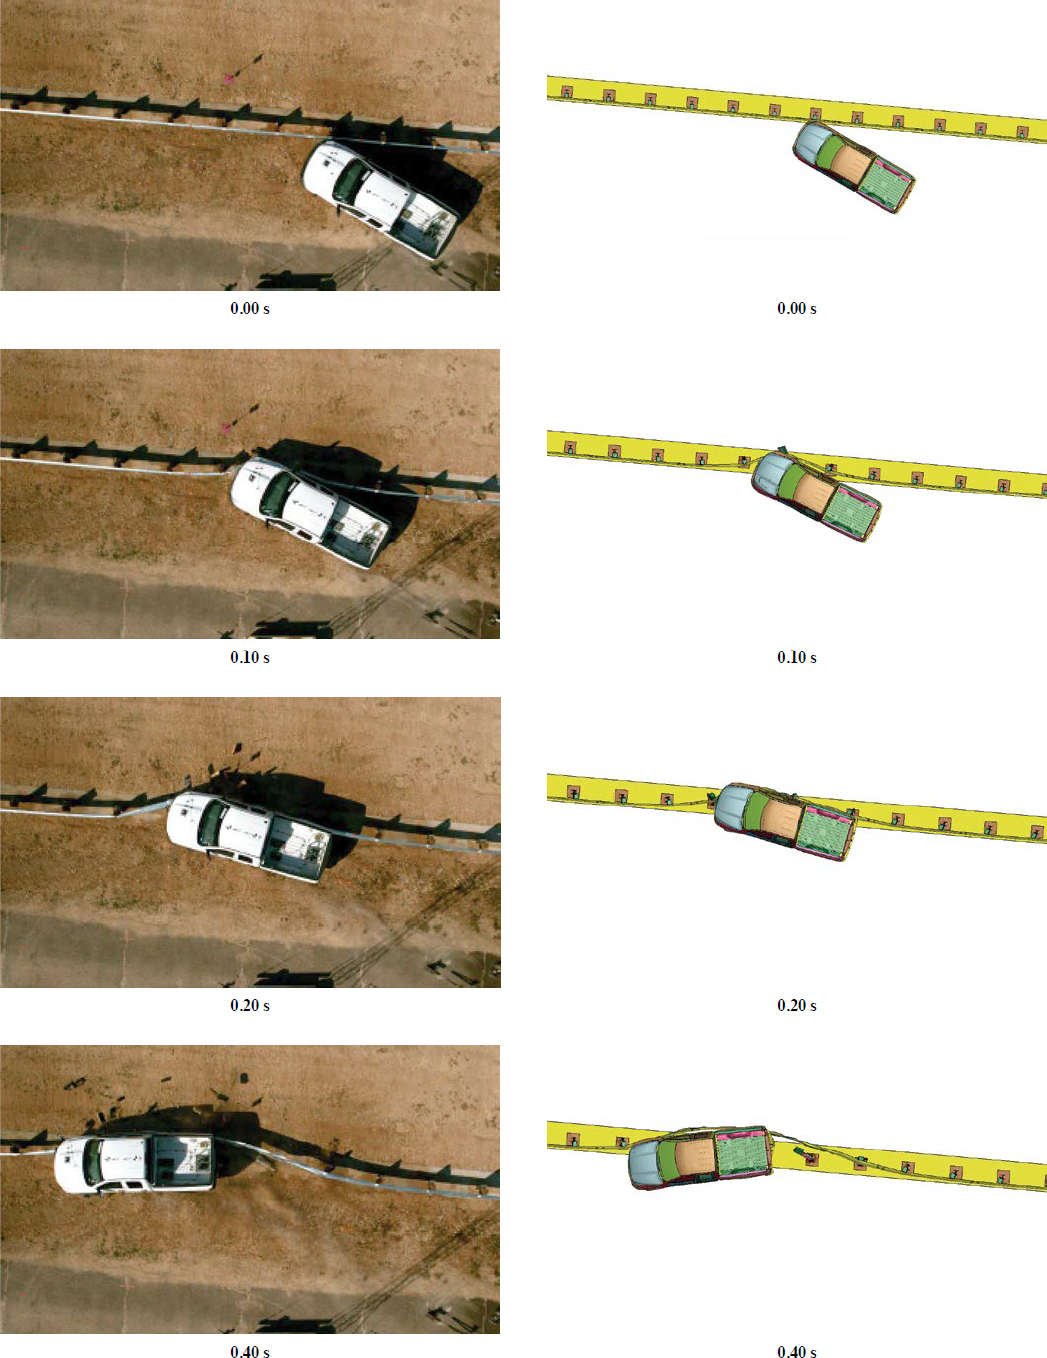
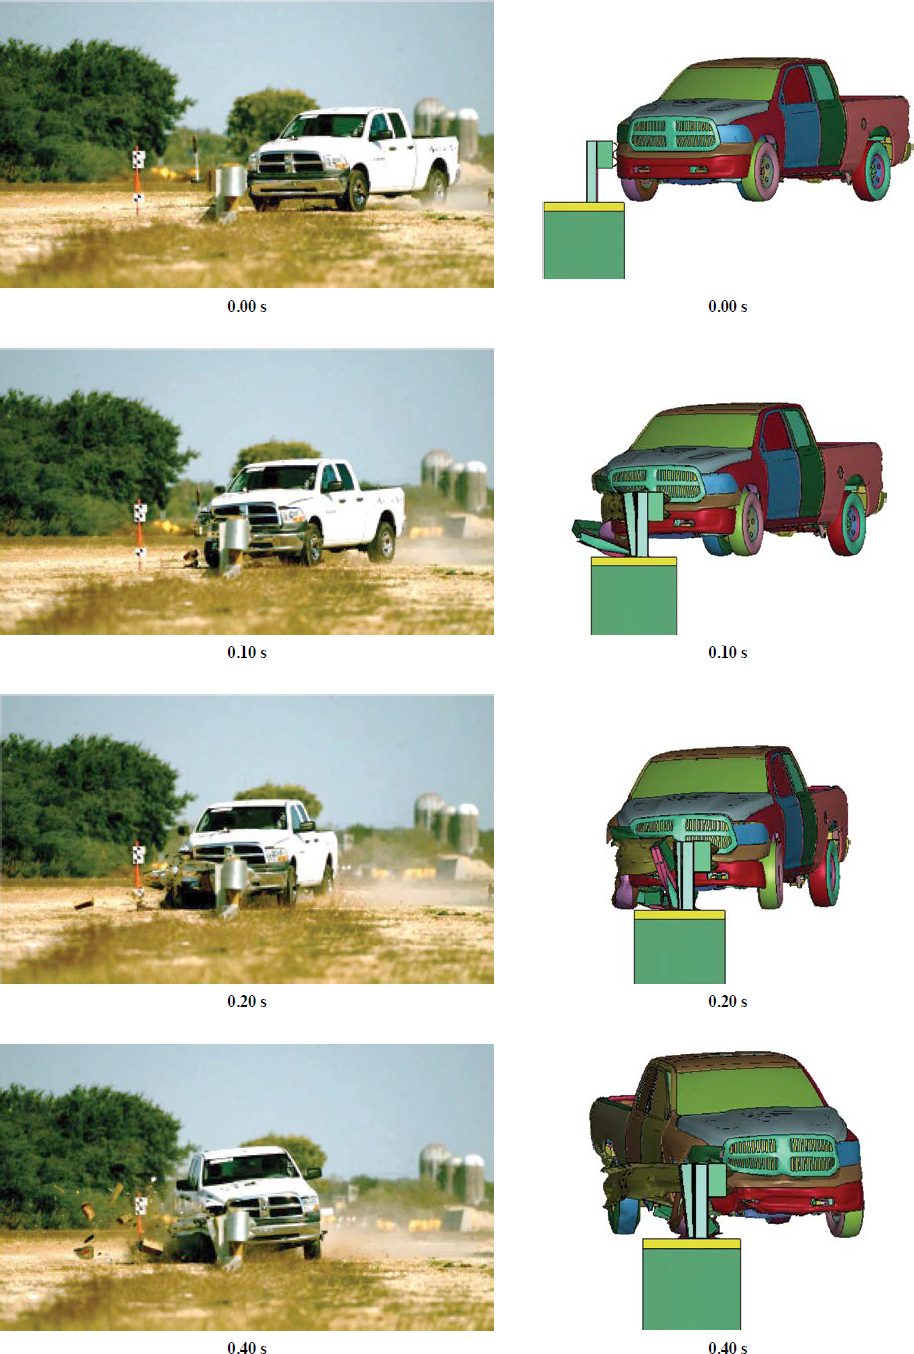
Table 39. Comparison of TRAP values for actual crash test and FE simulation results.
| Occupant Risk Factor | Actual Crash Test | FE Simulation |
|---|---|---|
| Impact velocity (ft/s) | ||
| X | 15.4 | 17.71 |
| Y | 14.4 | 14.4 |
| Ridedown acceleration (g) | ||
| X | 7.0 | 11.2 |
| Y | 7.3 | 10.6 |
| Maximum angle (deg) | ||
| Roll | 16 | 4.1 |
| Pitch | 4 | 2.6 |
| Yaw | 40 | 41.1 |
crash test results for most of the crash time period. Table 39 presents the comparison of the TRAP values obtained for the purpose of determining the occupant risk factors after the impact. As shown in the comparison, the values are close, with no significant difference in the TRAP values.
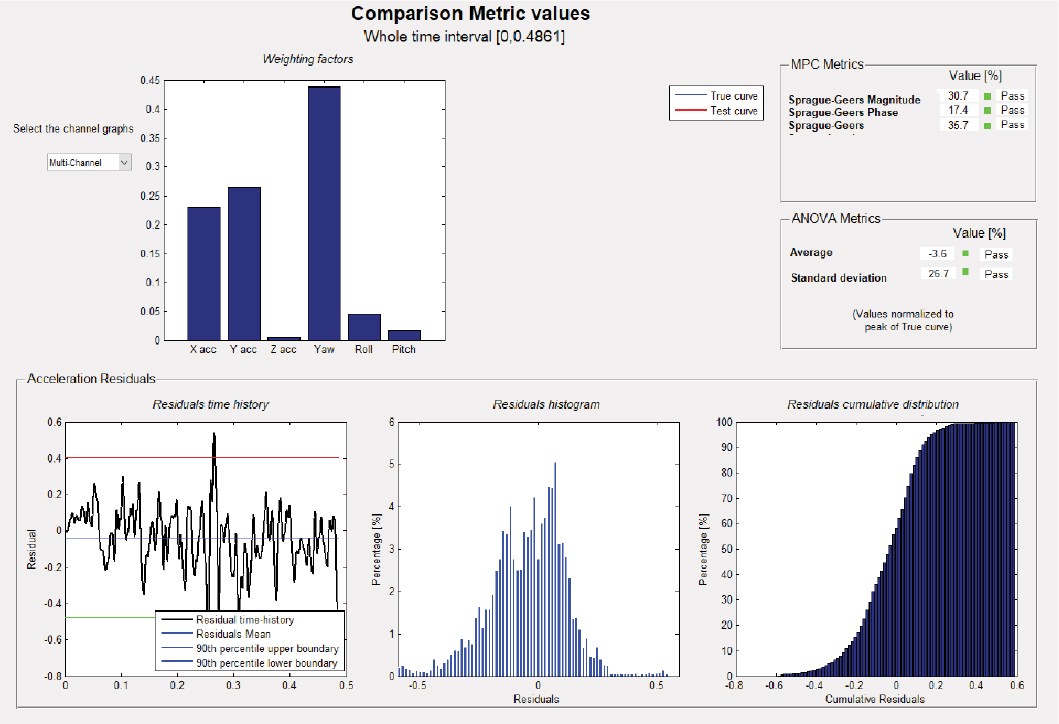
After calibration of the mow strip model, TTI researchers tried to validate the model with the Roadside Safety Verification and Validation Program (RSVVP) MATLAB compiler. For this, the acceleration and angular displacement values were obtained from the simulation through postprocessing and compared with the data available from the actual crash test. All such data were imported into the compiler, and the metrics evaluation was obtained after the curves were filtered. This evaluation tried to determine several parameters that could judge the similarity between the true crash and the simulation tests. An image from the RSVVP test results is shown in Figure 57. In the figure, all the evaluation parameters indicate a pass for the comparison; therefore, the model was considered near to being validated. Furthermore, the maximum dynamic deflection values for true test and simulation were also similar, at 50.6 in. and 47 in., respectively. Thus, the soil model used for the calibration was used in developing the multifunctional barrier model after the proposed design was incorporated. The barrier design is discussed in the next section and includes drawings, modifications in the design, and FE simulation results.
Validation of the Multifunctional Barrier Model
The TTI researchers used LS-PrePost software to develop the FE model for the proposed MASH multifunctional barrier. The purpose of developing this model was to obtain a preliminary simulation result without calibration. Figure 58 shows the proposed model drawing used for preliminary purposes. Figure 59 provides a detailed drawing of different components of the proposed system. The drawings were only used for the FE model and were modified for the actual test installation later.
Finite Element Multifunctional Barrier Model
This section discusses the calibration of the multifunctional barrier model. Although researchers calibrated each component of the system model, as explained in previous sections, the entire barrier model needed to be calibrated after all components of the system were combined. As shown in Figures 58 and 59, the proposed barrier consists of a mow strip with grout along with steel posts.
The HSS rails connected to the posts are attached with brackets. The two handrails attached to the post have bolted connections. A cane detection rail is attached to the bottom of the post near the mow strip level.
To prepare the FE model of the system in LS-PrePost, researchers obtained different components from the respective calibration models and combined the files to prepare the final model. The HSS rails were obtained from the HSS calibration model, and the mow strip with soil was obtained from the mow strip calibration model. Additional parts of the barrier system, such as handrails and cane detection, were modeled separately.
Section properties of the model were based on the thickness and length of different components of the system shown in the drawing. The material properties of A36 steel were used with all the components of the system except the soil and mow strip. Instead of modeling a terminal, the researchers used springs and discrete mass elements at the ends of the rail. Soil and grout were modeled with Material ID 025—MAT_GEOLOGIC_CAP_MODEL, while mow strip concrete was modeled with the material properties of a concrete.
The connections of the different components of the system were based on calibration experience with HSS rails and mow strips. CNRB was used for the connection between the HSS traffic rail and rub rail with posts. Spot-welds were used for the connection of the internal joints between all rail sections. Similarly, spot-welds were used for the connections between the handrails and
the posts and between the cane detection system and the posts. No brackets were used in the FE model, since the connections were made with CNRB and spot-welds.
The mow strip had the dimensions of depth and leave-outs, as per the calibration model. This included the depth of concrete and grout in the strip at 4 in. thick. The properties of the soil and mow strip with grout were kept the same as those of the calibration model. Figure 60 and Figure 61 show the FE model prepared in LS-PrePost.
MASH Test 3-11 Calibration
The researchers calibrated the FE model of the multifunctional rail length of need (LON) system against full-scale crash testing to validate the chosen properties and modeling techniques. Specifically, the calibration was conducted to achieve similar lateral deformation of the LON system during the impact by the pickup truck, which reflects system stiffness. Calibration of system stiffness was needed to anticipate potential vehicle pocketing/snagging behavior during the impact event against the transition system.
Figure 62 and Figure 63 compare actual MASH Test 3-11 test frames and results with the FE simulation outcome (top view and front view, respectively). This comparison indicates that the FE model acceptably predicts the general system behavior and vehicle interaction during the impact event.

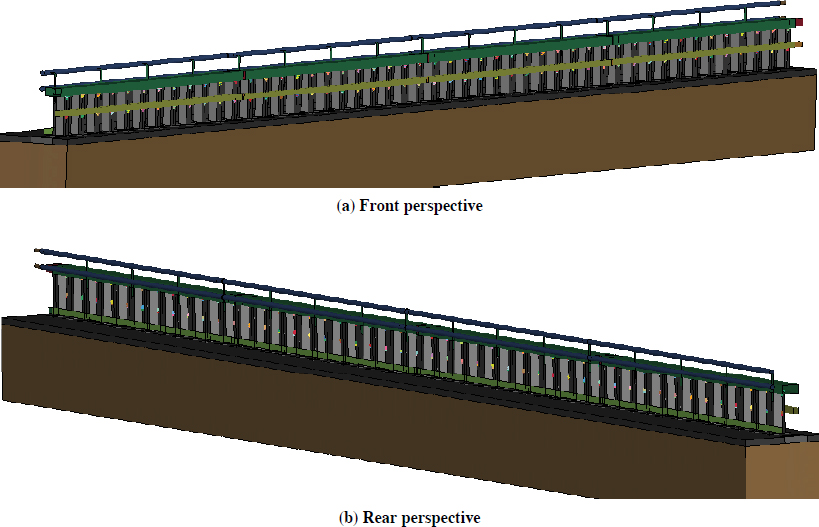

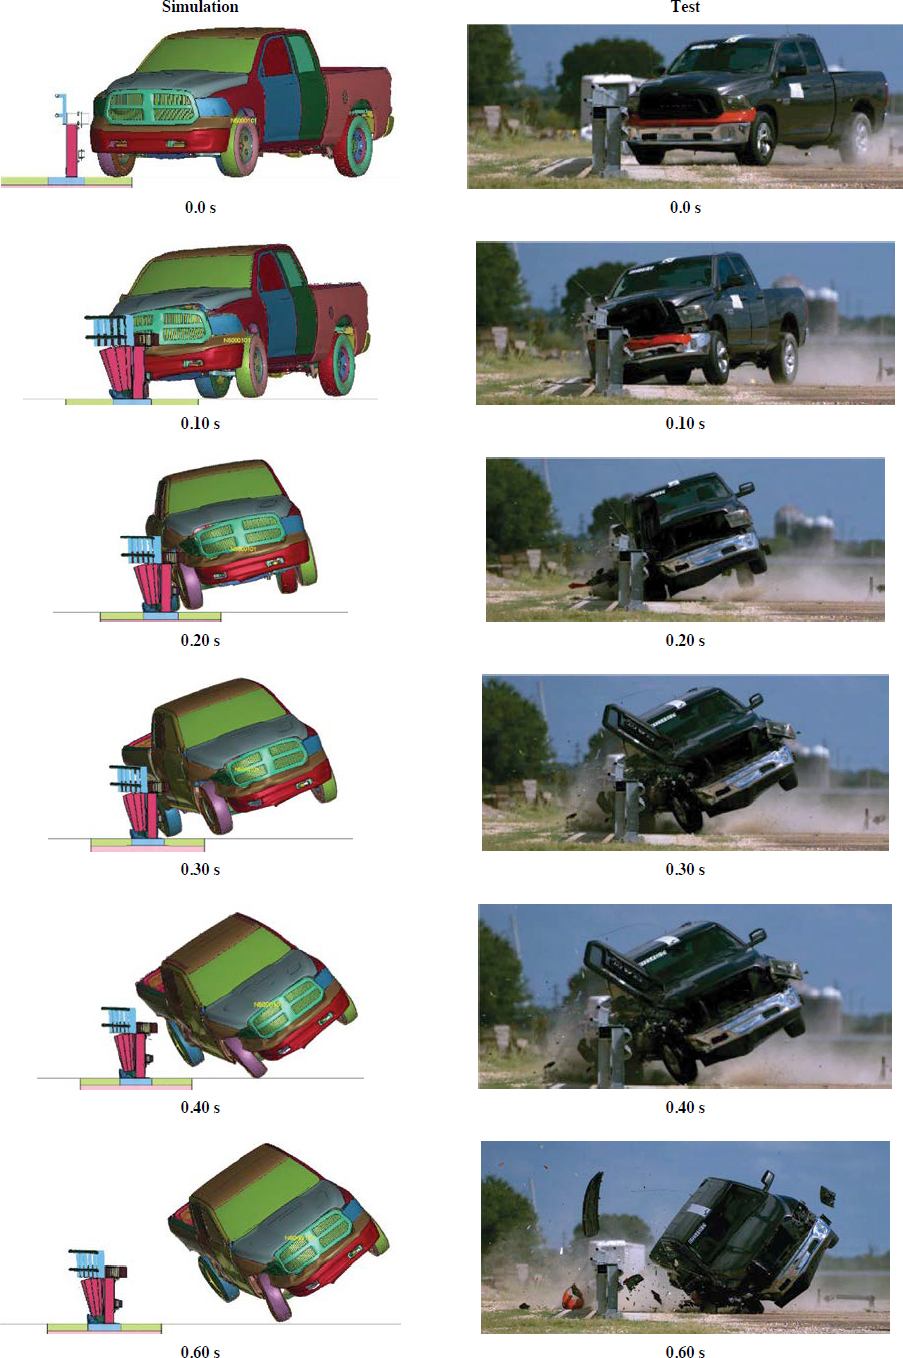
Table 40 shows the comparison of occupant risk factors associated with the crash test and the FE simulation. The FE model appeared to underpredict the maximum vehicle roll angle during the impact event, which was a finding that needed consideration when the simulations for the transition impact behavior were being revised. At the same time, the computer model seemed to overpredict the dynamic lateral deflection of a few inches.
On the basis of the results, the FE model of the LON multifunctional barrier was considered calibrated for the purpose of the transition investigation. This model was utilized in conjunction with the newly developed transition model design to conduct predictive simulations for system crashworthiness. The calibration of the LON model aided in the investigation of vehicles’ snagging or pocketing potential due to differences in stiffness between the LON and the transition component.
Table 40. Occupant risk factors comparison of crash test and FE simulation results under MASH Test 3-11.
| Occupant Risk Factor | Actual Crash Test | FE Simulation |
|---|---|---|
| Impact point (ft) | ||
| Upstream of Post 17 | 1.6 | 1.6 |
| Upstream of splice | 4.4 | 4.4 |
| OIV (ft/s) | ||
| X | 14.0 | 14.3 |
| Y | 22.9 | 22.8 |
| Ridedown acceleration (g) | ||
| X | 5.6 | 4.6 |
| Y | 9.6 | 13.5 |
| Maximum angle (deg) | ||
| Roll | 46.3 | 27.4 |
| Pitch | 7.0 | 4.0 |
| Yaw | 38.7 | 41.9 |
| Maximum deflection (in.) | ||
| Dynamic | 16.0 | 21.3 |
| Permanent | 9.6 | 14.6 |


