Development of a MASH Barrier to Shield Pedestrians, Bicyclists, and Other Vulnerable Users from Motor Vehicles (2024)
Chapter: 10 MASH Test 3-10 (Crash Test 612541-01-2)

CHAPTER 10
MASH Test 3-10 (Crash Test 612541-01-2)
Test Designation and Actual Impact Conditions
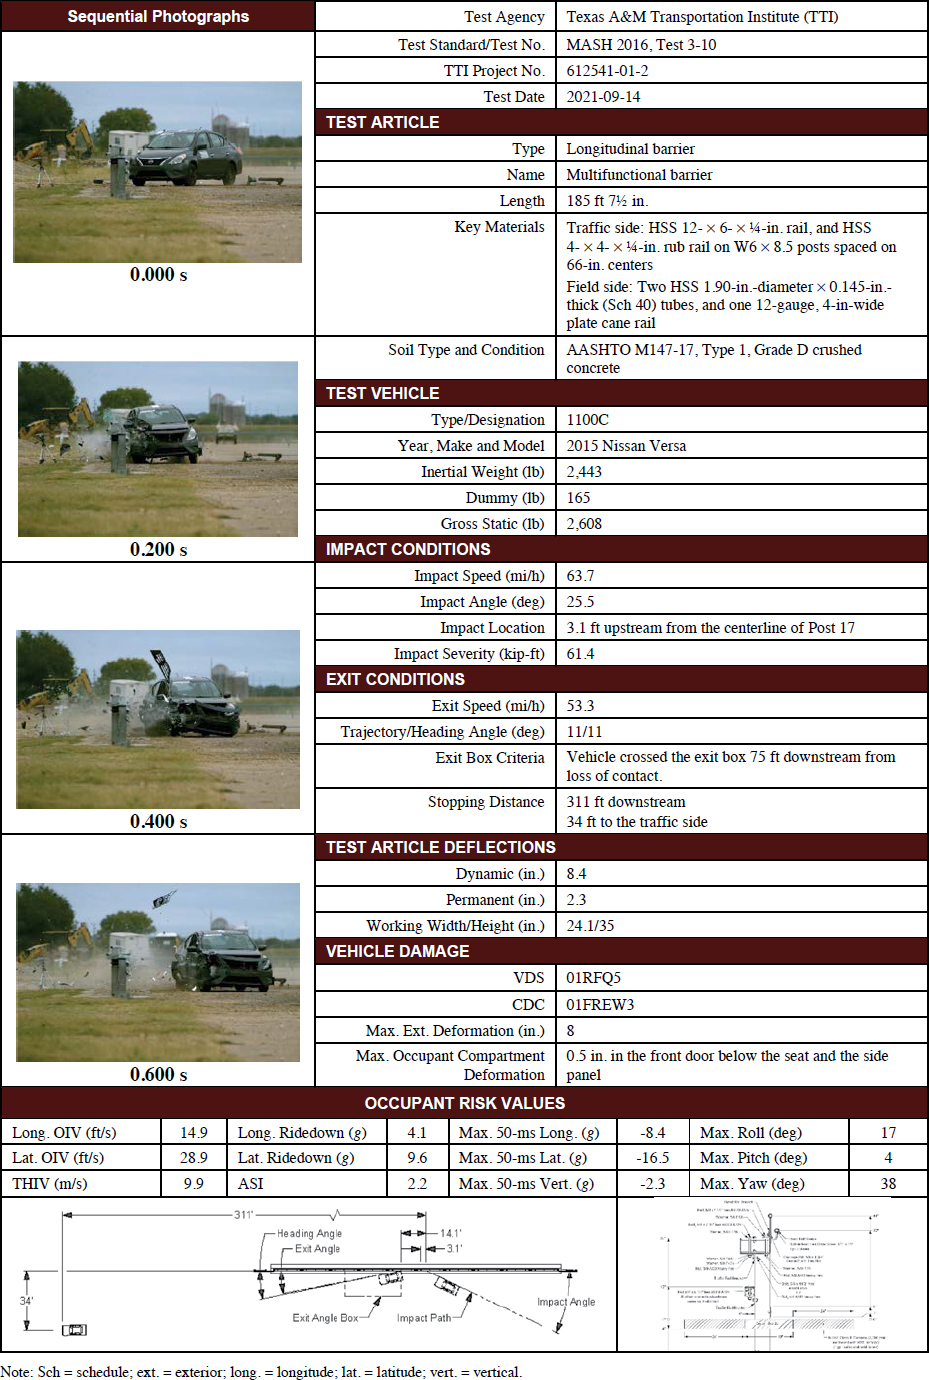
The impact conditions and exit parameters for MASH Test 3-10 (Crash Test 612541-01-2) are reported in Table 52 and Table 53, respectively. Figure 76 and Figure 77 depict the target impact setup.
Weather Conditions
Table 54 provides the weather conditions for Crash Test 612541-01-2.
Table 52. Impact conditions for MASH Test 3-10 (Crash Test 612541-01-2).
| Test Parameter | Specification | Tolerance | Measured |
|---|---|---|---|
| Impact speed (mi/h) | 62 | ±2.5 | 63.7 |
| Impact angle (deg) | 25 | ±1.5 | 25.5 |
| Impact severity (kip-ft) | 51 | ≥51 | 61.4 |
| Impact location [distance (ft) upstream of centerline of Post 17] | 2.85 | ±1 | 3.1 |
Table 53. Exit parameters for MASH Test 3-10 (Crash Test 612541-01-2).
| Exit Parameter | Measured |
|---|---|
| Speed (mi/h) | 53.3 |
| Trajectory (deg) | 11 |
| Heading (deg) | 11 |
| Brakes applied post impact (s) | 2.1 |
| Vehicle at rest position | 311 ft downstream of impact point |
| 34 ft to the traffic side | |
| 2 deg left | |
| Comments |
Vehicle remained upright and stable.
Vehicle crossed the exit boxa at 75 ft downstream from loss of contact and satisfied the exit box criteria described in MASH. |
aNot less than 32.8 ft downstream from loss of contact for cars and pickups is optimal.
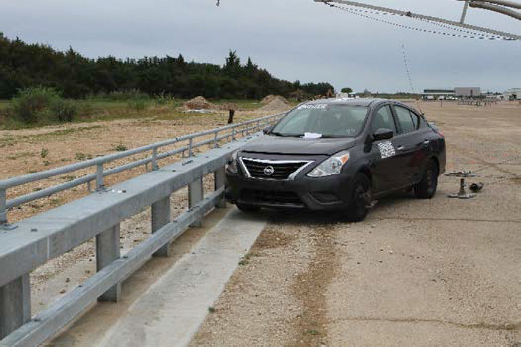
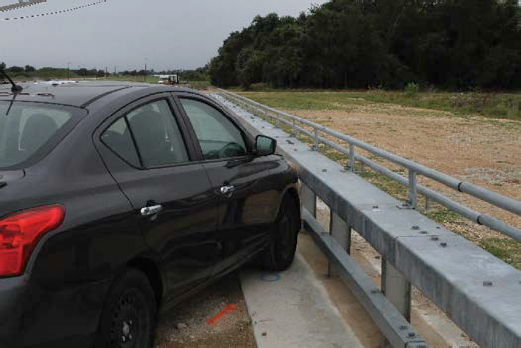
Table 54. Weather conditions for Crash Test 612541-01-2 (2021-09-14, AM).
| Condition | Measurement |
|---|---|
| Wind speed (mi/h) | 12 |
| Wind direction (deg) | 47 |
| Temperature (°F) | 75 |
| Relative humidity (%) | 88 |
| Vehicle traveling (deg) | 195 |
Test Vehicle
Figure 78 and Figure 79 show the 2015 Nissan Versa used for the crash test. Table 55 shows the vehicle measurements. Table C.1 in Appendix C, Section C.1, gives additional dimensions and information about the vehicle.
Test Description
Table 56 lists events that occurred during Crash Test 612541-01-2. Figures C.1 and C.2 in Appendix C, Section C.2, present sequential photographs during the test.
Damage to Test Installation
The rails were scuffed at the location of the impact and downstream of the impact. Maximum permanent deflection was 2.3 in. at the joint between Posts 17 and 18. The soil was disturbed at Post 1, there was significant grout damage between Posts 17 and 18, and there was slight separation between the grout and concrete on the traffic and field sides from Posts 14 to 21.

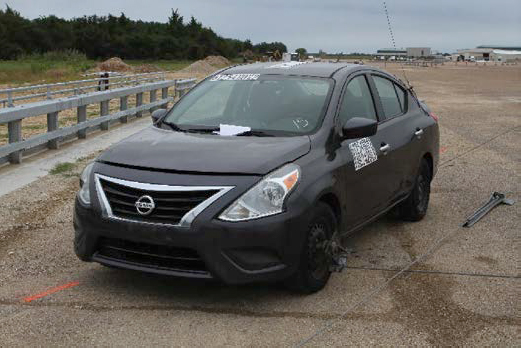
Table 55. Vehicle measurements for Crash Test 612541-01-2.
| Test Parameter | MASH | Allowed Tolerance | Measured |
|---|---|---|---|
| Dummy (if applicable)a (lb) | 165 | N/A | 165 |
| Inertial weight (lb) | 2,420 | ±55 | 2,443 |
| Gross statica (lb) | 2,585 | ±55 | 2,608 |
| Wheelbase (in.) | 98 | ±5 | 102.4 |
| Front overhang (in.) | 35 | ±4 | 32.5 |
| Overall length (in.) | 169 | ±8 | 175.4 |
| Overall width (in.) | 65 | ±3 | 66.7 |
| Hood height (in.) | 28 | ±4 | 30.5 |
| Track widthb (in.) | 59 | ±2 | 58.4 |
| CG aft of front axlec (in.) | 39 | ±4 | 41.1 |
| CG above groundc,d (in.) | N/A | N/A | N/A |
aIf a dummy is used, the gross static vehicle mass includes the mass of the dummy.
bAverage of front and rear axles.
cFor test inertial mass.
d2270P vehicle must meet minimum CG height requirement.
Table 56. Events during Crash Test 612541-01-2.
| Time (s) | Event |
|---|---|
| 0.0000 | Vehicle impacted the installation. |
| 0.0130 | Vehicle began to redirect. |
| 0.0263 | Post 17 began to move toward field side due to contact with front bumper. |
| 0.1530 | Vehicle was parallel with installation. |
| 0.1650 | Rail began to move back toward field side due to rear bumper contact. |
| 0.2920 | Vehicle exited the installation at 53.3 mi/h with a heading of 11 deg and trajectory of 11 deg. |
Table 57 presents the data on the post displacement and lean. Table 58 describes the deflection and working width of the multifunctional barrier. Figure 80 and Figure 81 show the damage to the multifunctional barrier.
Damage to Test Vehicle
Figure 82 and Figure 83 show the damage sustained by the vehicle. Figure 84 and Figure 85 show the interior of the vehicle after the test. Table 59 and Table 60 provide details on the occupant compartment deformation and exterior vehicle damage, respectively. Tables C.2 and C.3 in Appendix C, Section C.1, provide exterior crush and occupant compartment measurements, respectively.
Table 57. Post displacement details for multifunctional barrier for Crash Test 612541-01-2.
| Post | Soil Gap (in.) | Lean from Vertical Toward Field Side (deg) | |
|---|---|---|---|
| Traffic Side | Field Side | ||
| 16 | ¼ | ½ | 2 |
| 17 | ¼ | 1¼ | 9 |
| 18 | ½ | 1¼ | 8 |
| 19 | ¼ | ⅜ | 7 |
Table 58. Deflection and working width of the multifunctional barrier for Crash Test 612541-01-2.
| Test Parameter | Measured |
|---|---|
| Permanent deflection/location (in.) | 2.3 toward field side, at the joint between Posts 17 and 18 |
| Dynamic deflection (in.) | 8.4 toward field side |
| Working widtha and height (in.) | 24.1 at a height of 35 in. |
aPer MASH, “The working width is the maximum dynamic lateral position of any major part of the system or vehicle. These measurements are all relative to the preimpact traffic face of the test article.” In other words, the working width is the total barrier width plus the maximum dynamic intrusion of any portion of the barrier or test vehicle past the field side edge of the barrier.

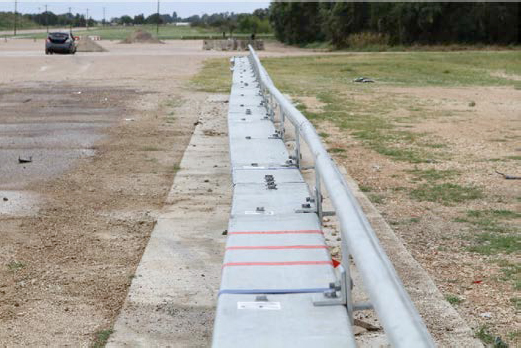
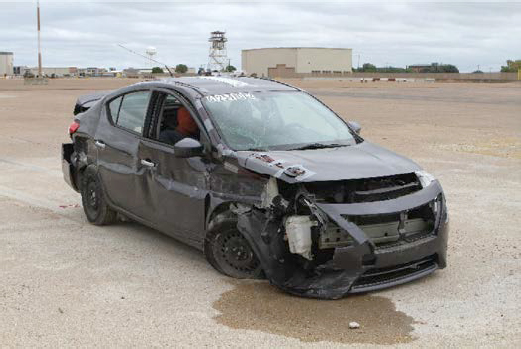
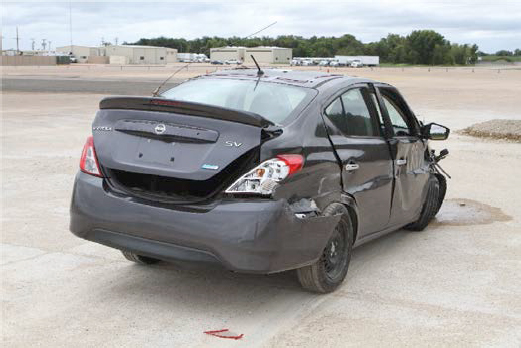
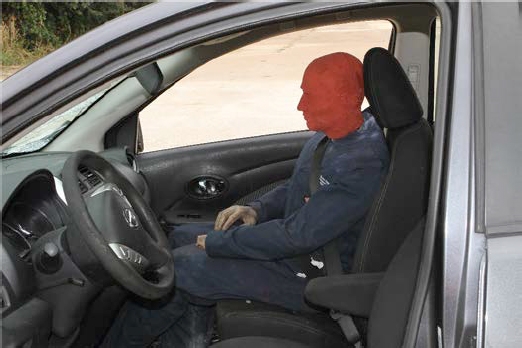
Table 59. Occupant compartment deformation in Crash Test 612541-01-2.
| Test Parameter | Specification (in.) | Measured (in.) |
|---|---|---|
| Roof | ≤4.0 | 0 |
| Windshield | ≤3.0 | 0 |
| A and B pillars | ≤5.0 overall, ≤3.0 lateral | 0 |
| Foot well/toe pan | ≤9.0 | 0 |
| Floor pan/transmission tunnel | ≤12.0 | 0 |
| Side front panel | ≤12.0 | 0.5 |
| Front door (above seat) | ≤9.0 | 0 |
| Front door (below seat) | ≤12.0 | 0.5 |
Table 60. Exterior vehicle damage in Crash Test 612541-01-2.
| Part of Vehicle | Damage |
|---|---|
| Side windows | Right front side window shattered. The cause was torsion of the vehicle body due to impact with rail. |
| Maximum exterior deformation | 8 in. in the front plane at bumper height |
| VDS | 01RFQ5 |
| CDC | 01FREW3 |
| Fuel tank damage | None |
| Description of damage to vehicle | The front bumper hood and grill, right headlight and quarter fender, right front tire and rim, right front strut, windshield (crack caused by torsion of vehicle body due to impact with rail), right front door and glass, right front floor pan, right rear door, right rear quarter fender, right taillight, and rear bumper were damaged. |
Note: VDS = vehicle damage scale; CDC = collision deformation classification.
Occupant Risk Factors
Data from the accelerometers were digitized for evaluation of occupant risk; the results are shown in Table 61. Figure C.3 in Appendix C, Section C.3, shows the vehicle angular displacements, and Figures C.4 through C.6 in Appendix C, Section C.4, show acceleration versus time traces.
Test Summary
Figure 86 summarizes the results of MASH Crash Test 612541-01-2.
Table 61. Occupant risk factors for Crash Test 612541-01-2.
| Test Parameter | MASHa | Measured | Time (s) |
|---|---|---|---|
| OIV (ft/s) | |||
| X | ≤40.0 30.0 |
14.9 | 0.0794 on right side of interior |
| Y | ≤40.0 30.0 |
28.9 | 0.0794 on right side of interior |
| Ridedown (g) | |||
| X | ≤20.49 15.0 |
4.1 | 0.0960–0.1060 |
| Y | ≤20.49 15.0 |
9.6 | 0.0980–0.1080 |
| THIV (m/s) | N/A | 9.9 | 0.0779 on right side of interior |
| ASI | N/A | 2.2 | 0.0460–0.0960 |
| Max. 0.050-s average (g) | |||
| X | N/A | –8.4 | 0.0134–0.0634 |
| Y | N/A | –16.5 | 0.0268–0.0768 |
| Vertical | N/A | –2.3 | 0.0331–0.0831 |
| Roll (deg) | ≤75 | 17 | 2.0000 |
| Pitch (deg) | ≤75 | 4 | 0.3106 |
| Yaw (deg) | N/A | 38 | 0.4486 |
aValues in italics are the preferred MASH values.