Development of a MASH Barrier to Shield Pedestrians, Bicyclists, and Other Vulnerable Users from Motor Vehicles (2024)
Chapter: 17 MASH Test 3-21 (Crash Test 612541-01-3)

CHAPTER 17
MASH Test 3-21 (Crash Test 612541-01-3)
Test Designation and Actual Impact Conditions
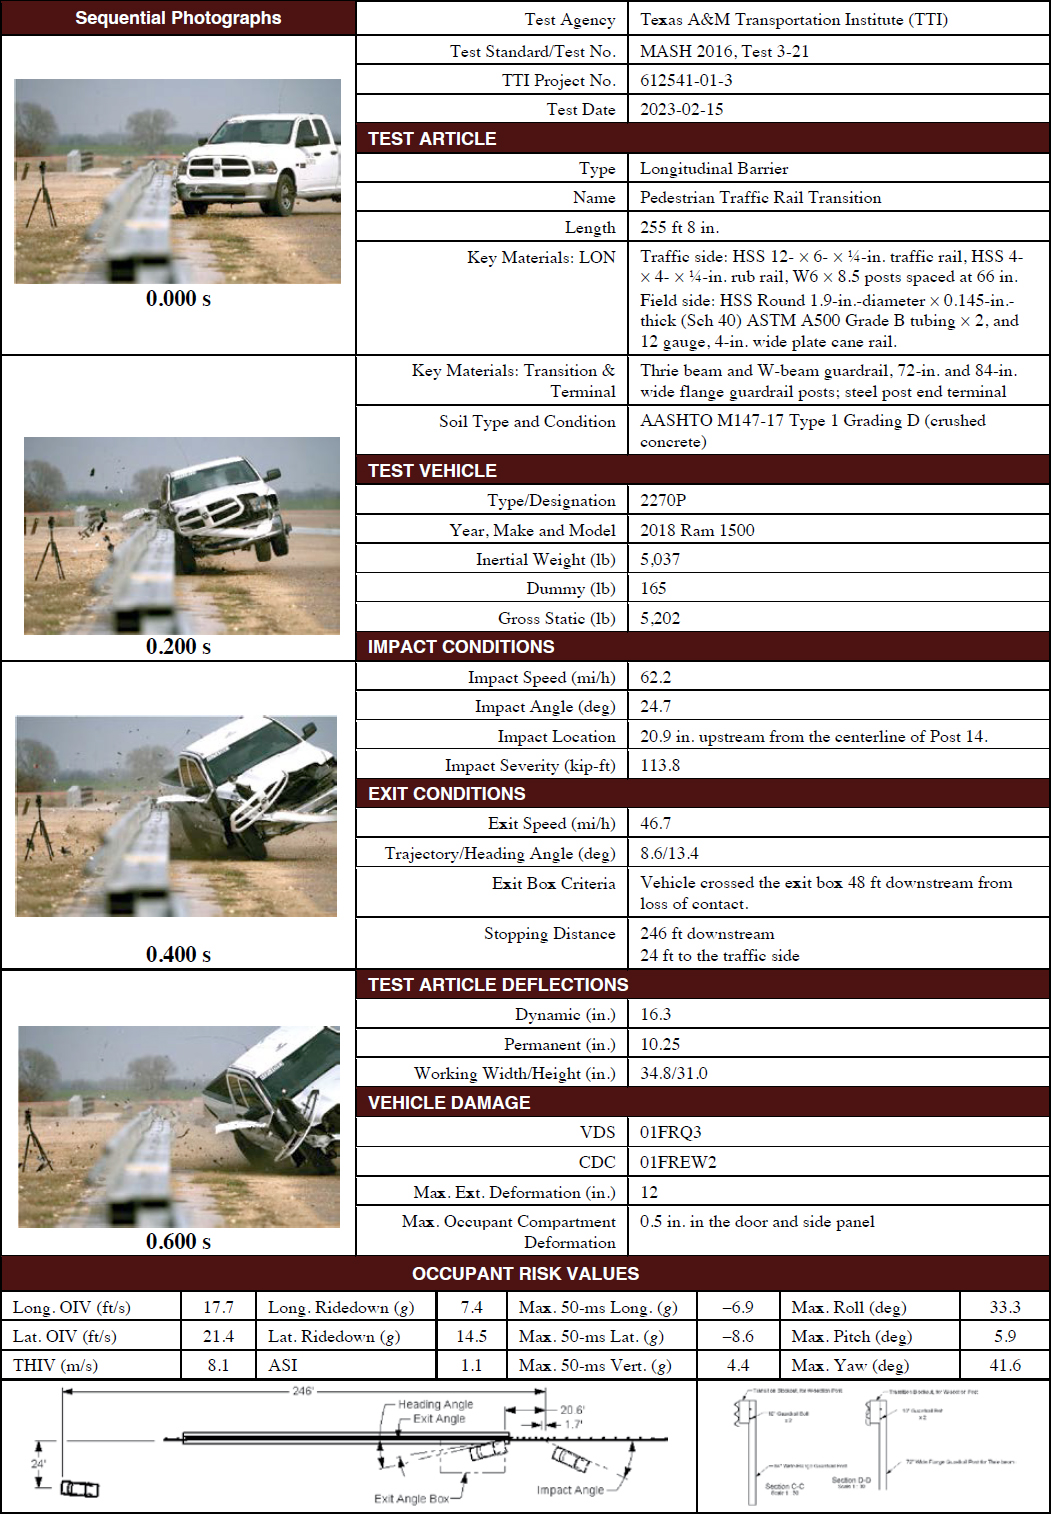
The MASH impact conditions and exit parameters for Crash Test 612541-01-3 are given in Table 95 and Table 96, respectively. Figure 147 and Figure 148 depict the setup of the target impact.
Weather Conditions
Table 97 provides the weather conditions for Crash Test 612541-01-3.
Table 95. Impact conditions for MASH Test 3-21 (Crash Test 612541-01-3).
| Test Parameter | Specification | Tolerance | Measured |
|---|---|---|---|
| Impact speed (mi/h) | 62 | ±2.5 | 62.2 |
| Impact angle (deg) | 25 | ±1.5 | 24.7 |
| Impact severity (kip-ft) | 106 | ≥106 | 113.8 |
| Impact location [distance (in.) upstream of centerline of Post 14] | 24 | ±12 | 20.9 |
Table 96. Exit parameters for MASH Test 3-21 (Crash Test 612541-01-3).
| Exit Parameter | Measured |
|---|---|
| Speed (mi/h) | 46.7 |
| Trajectory (deg) | 8.6 |
| Heading (deg) | 13.4 |
| Brakes applied post impact (s) | 3.5 |
| Vehicle at rest position | 246 ft downstream of impact point |
| 24 ft to the traffic side | |
| 5 deg right | |
| Comments | Vehicle remained upright and stable. Vehicle crossed the exit boxa 48 ft downstream from loss of contact and satisfied the exit box criteria described in MASH. |
a Not less than 32.8 ft downstream from loss of contact for cars and pickups is optimal.
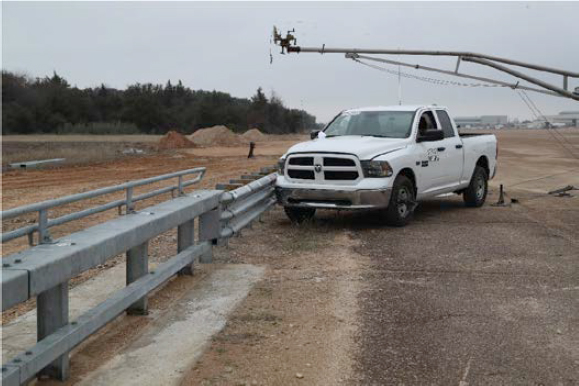
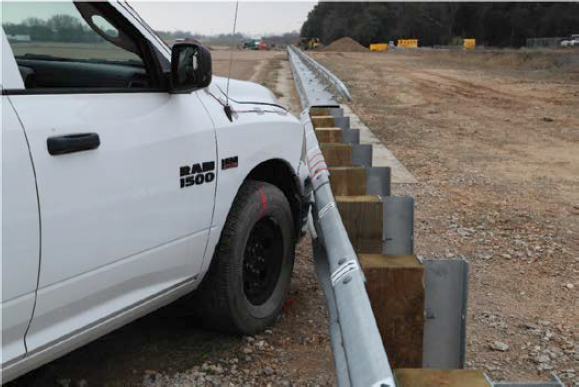
Table 97. Weather conditions for Crash Test 612541-01-3 (2023-02-15, AM).
| Condition | Measurement |
|---|---|
| Wind speed (mi/h) | 11 |
| Wind direction (deg) | 182 |
| Temperature (°F) | 72 |
| Relative humidity (%) | 91 |
| Vehicle traveling (deg) | 195 |
Test Vehicle
Figure 149 and Figure 150 show the 2018 Ram 1500 used for the crash test. Table 98 shows the vehicle measurements. Figure H.1 in Appendix H, Section H.1, gives additional dimensions and information about the vehicle.
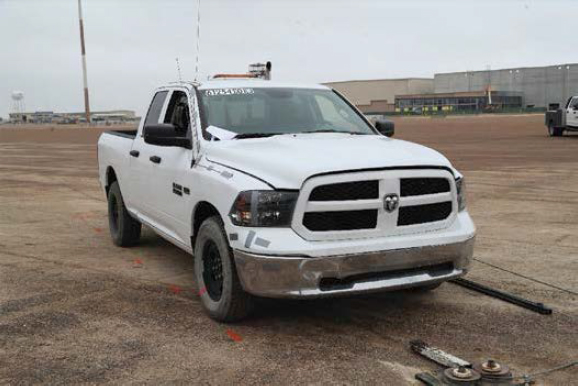
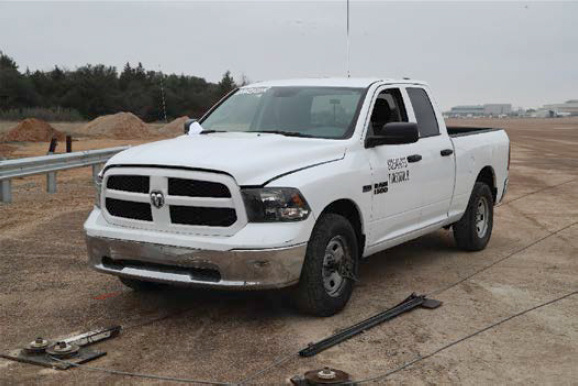
Table 98. Vehicle measurements for Crash Test 612541-01-3.
| Test Parameter | MASH | Allowed Tolerance | Measured |
|---|---|---|---|
| Dummy (if applicable)a (lb) | 165 | N/A | 165 |
| Inertial weight (lb) | 5,000 | ±110 | 5,037 |
| Gross statica (lb) | 5,165 | ±110 | 5,202 |
| Wheelbase (in.) | 148 | ±12 | 140.5 |
| Front overhang (in.) | 39 | ±3 | 40 |
| Overall length (in.) | 237 | ±13 | 227.5 |
| Overall width (in.) | 78 | ±2 | 78.5 |
| Hood height (in.) | 43 | ±4 | 46.0 |
| Track widthb (in.) | 67 | ±1.5 | 68.25 |
| CG aft of front axlec (in.) | 63 | ±4 | 60.6 |
| CG above groundc,d (in.) | 28 | ≥28 | 28.4 |
a If a dummy is used, the gross static vehicle mass includes the mass of the dummy.
b Average of front and rear axles.
c For test inertial mass.
d 2270P vehicle must meet minimum CG height requirement.
Test Description
Table 99 lists events that occurred during Crash Test 612541-01-3. Figures H.4, H.5, and H.6 in Appendix H, Section H.2, present sequential photographs from the test.
Damage to Test Installation
The rail was scuffed and deformed at impact, and the grout separated from the traffic side of the concrete slab at Posts 18 and 19. The grout was also cracked and broken up around Post 18. Table 100 reports the post displacement and lean of the installation, and Table 101 describes the deflection and working width of the multifunctional barrier transition. Figure 151 and Figure 152 show the damage to the multifunctional barrier transition.
Damage to Test Vehicle
Figure 153 and Figure 154 show the damage sustained by the vehicle. Figure 155 and Figure 156 show the interior of the test vehicle. Table 102 and Table 103 provide details on the occupant compartment deformation and exterior vehicle damage. Figures H.2 and H.3 in Appendix H.1 provide exterior crush and occupant compartment measurements.
Table 99. Events during Crash Test 612541-01-3.
| Time (s) | Events |
|---|---|
| 0 | Vehicle impacted the installation. |
| 0.014 | Posts 13 and 14 began to lean toward field side. |
| 0.021 | Posts 12, 15, and 16 began to lean toward field side. |
| 0.033 | Vehicle began to redirect. |
| 0.036 | Post 17 began to lean toward field side. |
| 0.101 | Front driver’s side tire began to leave pavement. |
| 0.115 | Front right fender contacted rail. |
| 0.186 | Vehicle was parallel with installation. |
| 0.675 | Vehicle lost contact with the rail traveling 46.7 mi/h, at a trajectory and heading of 8.6 and 13.4 deg, respectively. |
Table 100. Post displacement details for multifunctional barrier transition for Crash Test 612541-01-3.
| Post | Soil Gp (in.) | Lean from Vertical Toward Field Side (deg) | |
|---|---|---|---|
| Traffic Side | Field Side | ||
| 9–11 | Soil disturbed | — | |
| 12 | 1 | — | 1.5 |
| 13 | 2½ | ½ | 7 |
| 14 | 4¾ | ¾ | 12 |
| 15 | Soil filled back in | 15 | |
| 16 | Soil filled back in | 13 | |
| 17 | Soil filled back in | 6 | |
| 18 | ¾ | ½ | 1.5 |
| 19 | ¼ | ⅛ | — |
Table 101. Deflection and working width of the multifunctional barrier transition for Crash Test 612541-01-3.
| Test Parameter | Measured |
|---|---|
| Permanent deflection/location (in.) | 10.25 toward field side, at the centerline of Post 15 |
| Dynamic deflection (in.) | 16.3 toward field side, between Posts 15 and 16 |
| Working widtha and height (in.) | 34.8 at a height of 31.0 at the top field side of Post 15 |
a Per MASH, “The working width is the maximum dynamic lateral position of any major part of the system or vehicle. These measurements are all relative to the pre-impact traffic face of the test article.” In other words, the working width is the total barrier width plus the maximum dynamic intrusion of any portion of the barrier or test vehicle past the field side edge of the barrier.
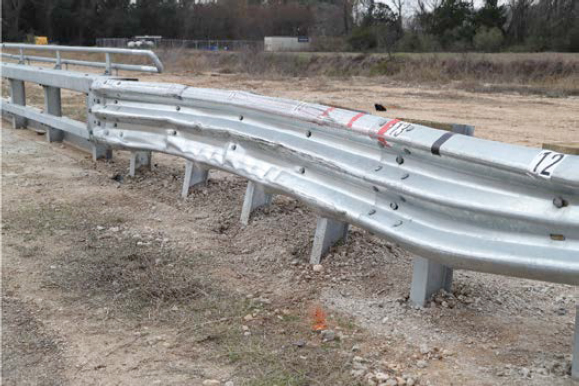
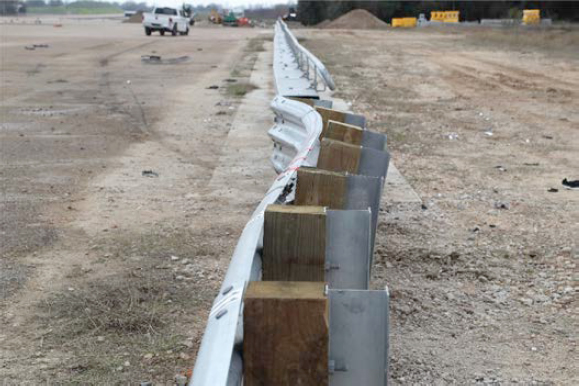
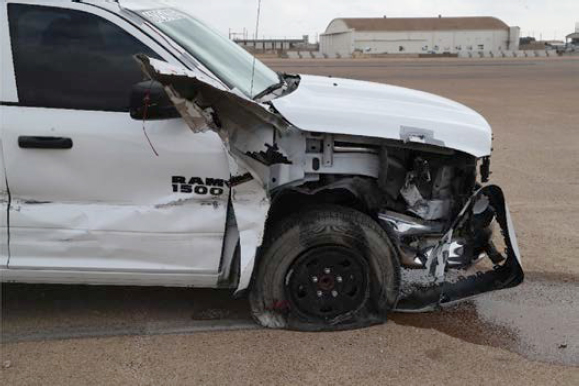
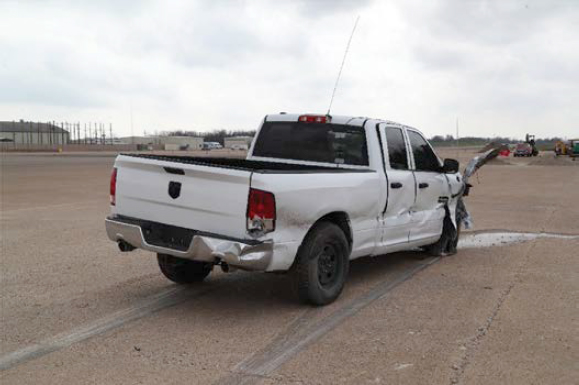
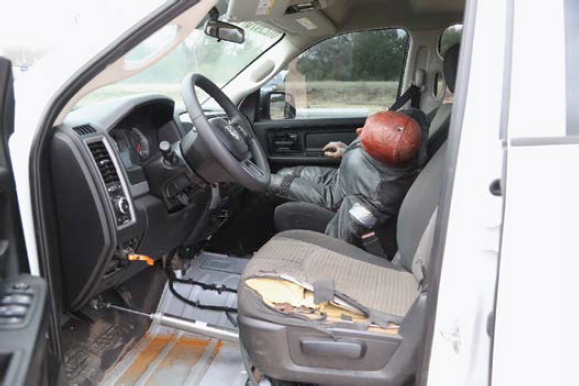

Table 102. Occupant compartment deformation for Crash Test 612541-01-3.
| Test Parameter | Specification (in.) | Measured (in.) |
|---|---|---|
| Roof | ≤4.0 | 0.0 |
| Windshield | ≤3.0 | 0.0 |
| A and B pillars | ≤5.0 overall. ≤3.0 lateral | 0.0 |
| Foot well/toe pan | ≤9.0 | 0.0 |
| Floor pan/transmission tunnel | ≤12.0 | 0.0 |
| Side front panel | ≤12.0 | 0.5 |
| Front door (above seat) | ≤9.0 | 0.5 |
| Front door (below seat) | ≤12.0 | 0.0 |
Table 103. Exterior vehicle damage for Crash Test 612541-01-3.
| Part of Vehicle | Damage |
|---|---|
| Side windows | Side windows remained intact |
| Maximum exterior deformation | 12 in. in the front plane at the right front corner at bumper height |
| VDS | 01FRQ3 |
| CDC | 01FREW2 |
| Fuel tank damage | None |
| Description of damage to vehicle | The front bumper, hood, grill, right front fender, right headlight, right front tire and rim, right frame rail, radiator, support, windshield (caused by torsion of body from impact), right front door, right rear door, right cab corner, right rear quarter fender, right taillight, and rear bumper were damaged. The windshield had small cracks on the lower right side, the right front door had a 2-in. gap at the top, and the right rear door had a 1.5-in. gap at the top. |
Occupant Risk Factors
Data from the accelerometers were digitized for evaluation of occupant risk, and the results are shown in Table 104. Figure H.7 in Appendix H, Section H.3, shows the vehicle angular displacements, and Figures H.8 through H.10 in Appendix H, Section H.4, show acceleration versus time traces.
Test Summary
Figure 157 summarizes the results of MASH Crash Test 612541-01-3.
Table 104. Occupant risk factors for Crash Test 612541-01-3.
| Test Parameter | MASHa | Measured | Time (s) |
|---|---|---|---|
| OIV (ft/s) | |||
| X | ≤40.0 30.0 |
17.7 | 0.1153 on right side of interior |
| Y | ≤40.0 30.0 |
21.4 | 0.1153 on right side of interior |
| Ridedown (g) | |||
| X | ≤20.49 15.0 |
7.4 | 0.1308–0.1408 |
| Y | ≤20.49 15.0 |
14.5 | 0.2068–0.2168 |
| THIV (m/s) | N/A | 8.1 | 0.1115 on right side of interior |
| ASI | N/A | 1.1 | 0.0681–0.1181 |
| Max. 0.050-s average (g) | |||
| X | N/A | –6.9 | 0.0638–0.1138 |
| Y | N/A | –8.6 | 0.0451–0.0951 |
| Vertical | N/A | 4.4 | 0.2550–0.3050 |
| Roll (deg) | ≤75 | 33.3 | 0.6062 |
| Pitch (deg) | ≤75 | 5.9 | 0.5627 |
| Yaw (deg) | N/A | 41.6 | 0.7953 |
a Values in italics are the preferred MASH values.