Development of a MASH Barrier to Shield Pedestrians, Bicyclists, and Other Vulnerable Users from Motor Vehicles (2024)
Chapter: 12 Finite Element Analysis for Preliminary Transition Designs Utilizing W-Beam and Rub Rail

CHAPTER 12
Finite Element Analysis for Preliminary Transition Designs Utilizing W-Beam and Rub Rail
In the previous chapters, a multifunctional barrier system was designed and verified to use in a variety of contexts, such as where ROW constraints reduce lateral offset between a roadway and a shared-use path. To limit separation of the multiuse path and roadway traffic, it is also likely that the barrier needs to be terminated in the clear zone, particularly at crossroads and intersections. Therefore, it is necessary to connect the barrier to a crashworthy terminal.
This chapter presents the preliminary transition design options, which used W-beam. Computer simulations helped determine the crashworthiness of the proposed design and served as a design aid, as needed.
Predictive Finite Element Analysis of Crashworthiness of the Preliminary W-Beam Transition System
MASH recommends two tests to evaluate transitions to TL-3:
- MASH Test Designation 3-20: A 2,425-lb vehicle impacting the CIP of the LON of the barrier at a nominal impact speed and angle of 62 mi/h and 25 deg, respectively. This test investigates a barrier’s ability to successfully contain and redirect a small passenger vehicle.
- MASH Test Designation 3-21: A 5,000-lb pickup truck impacting the CIP of the LON of the barrier at a nominal impact speed and angle of 62 mi/h and 25 deg, respectively. This test investigates a barrier’s ability to successfully contain and redirect light trucks and sport utility vehicles.
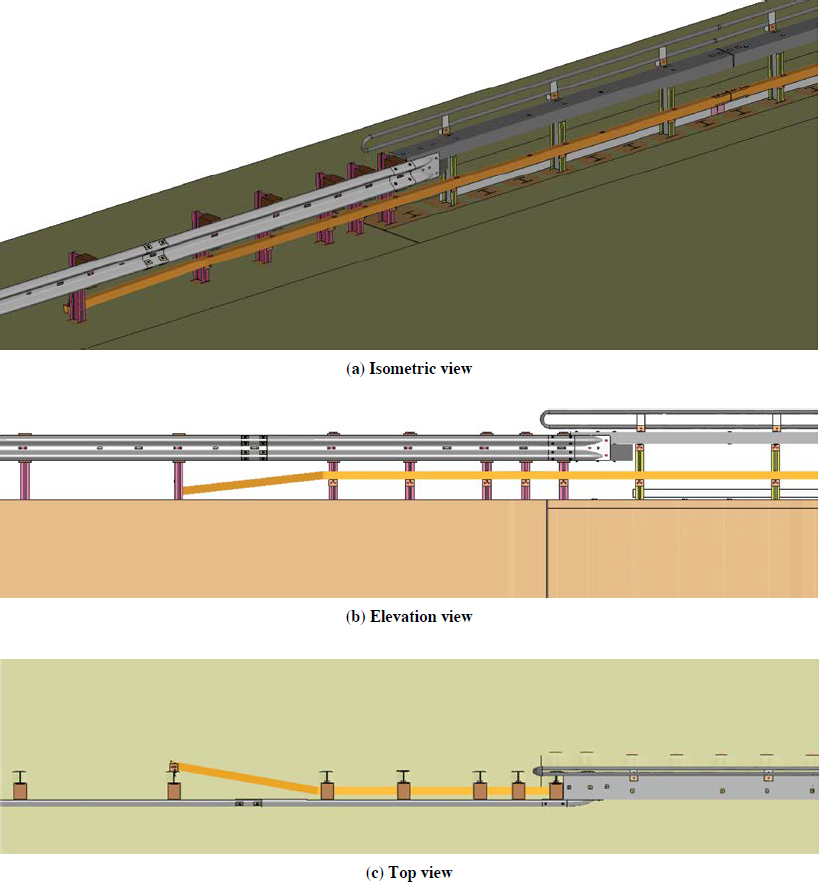
The multifunctional barrier would be connected to the 50-ft-long W-beam guardrail and nonproprietary terminal via a W-beam transition component. The proposed preliminary design of the transition system included a W-beam segment directly attached to a properly positioned spacer through a W-beam terminal connector. The proposed transition length was 6.25 ft and was supported by a standard W6 × 8.5 × 72-in. steel post with half post spacing (37.5 in.).
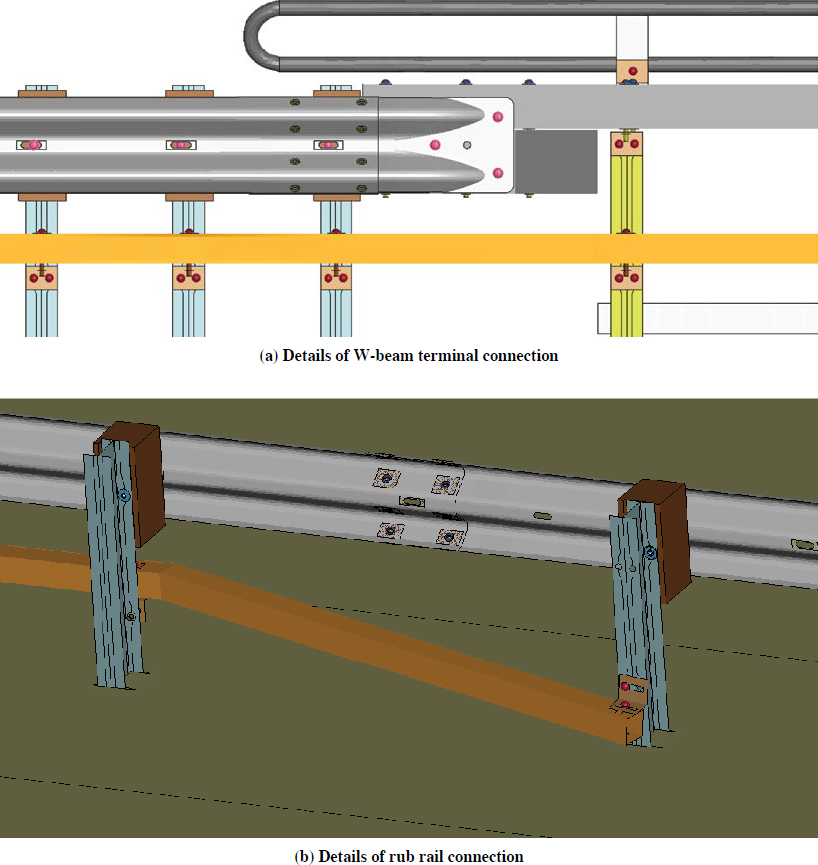
The cane rail terminated behind the last post of the multifunctional barrier LON, while the traffic rail, handrail, and rub rail of the multifunctional barrier LON extend past the LON’s last post. The rub rail (HSS 4 × 4 × ¼ × 30 in.) was flared behind the second post of the proposed transition to limit potential for snagging of the impacting vehicle. A terminal handrail component is suggested to connect the two hand railings of the system’s LON.
The W-beam transition was connected to the traffic rail and a spacer (HSS 12 × 8 × ¼ × 30 in.) through a terminal connector. The spacer was connected to the traffic rail through three ¾- × 16-in. hex A449 bolts.
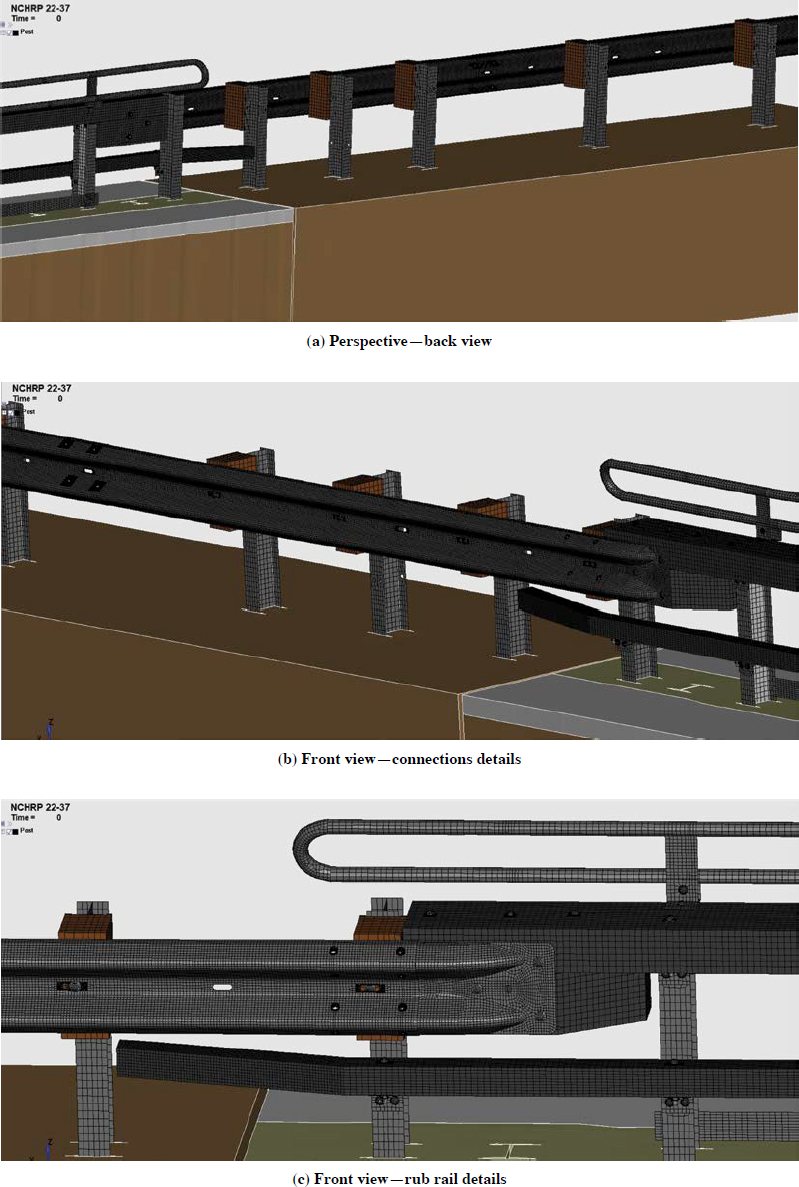
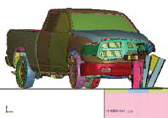
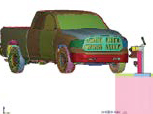
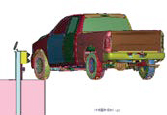
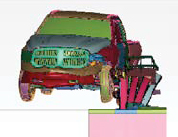
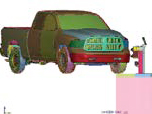
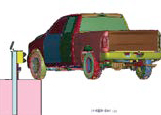
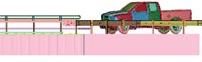
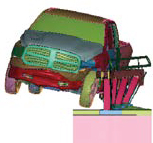
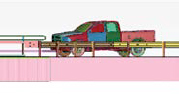
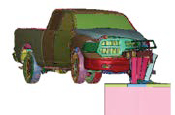
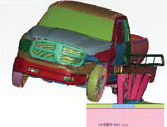
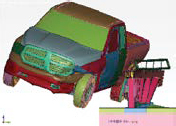
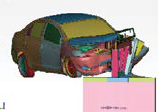
Figure 98 and Figure 99 provide a general overview, as well as specific details of the FE model of the proposed transition. The overall modeling technique and material/contact properties were similar to those utilized and described in the discussion of the multifunctional barrier LON in Chapter 6.
MASH Test 3-21: Predictive Investigation of Crashworthiness of Transition
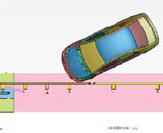
The research team conducted simulations to replicate the impact of the pickup truck vehicle (2270P) at various locations of the proposed transition design. MASH recommends performing a parametric investigation of the critical location of impact to identify the system CIP, which is the impact point that maximizes the risk of failure of the system’s crashworthiness. The following impact points were considered in the investigation of the system’s crashworthiness during the 2270P impact (Figure 100):
- Case 1: Impact location = 2 ft upstream of the fourth transition post.
- Case 2: Impact location = at the fourth transition post.
- Case 3: Impact location = 2 ft downstream of the fourth transition post.
- Case 4: Impact location = 2 ft upstream of the second transition post.

The selection of impact points was based on previous experience with transition design and testing, with the objective of maximizing the potential for vehicle instability and pocketing on the multifunctional barrier end (near the transition connection).
Case 1: Impact Location 2 ft Upstream of Fourth Transition Post
Table 72 summarizes the results from the predictive impact simulation of MASH Test 3-21 when the impact location was 2 ft upstream of the fourth post of the transition rail (counting the transition posts from the system connection to the multifunctional LON barrier system). The results from this predictive impact simulation indicate that the pickup truck was contained and redirected while maintaining vehicle stability throughout the impact event. The occupant risk factors (OIV and ORA) were all within MASH limits. According to these predicted results, the conducted simulation indicated that the transition design system was likely to perform acceptably per MASH Test 3-21 and evaluation criteria when the system was impacted 2 ft upstream of the fourth transition post.
Case 2: Impact Location at Fourth Transition Post
Table 73 summarizes the results from the predictive impact simulation of MASH Test 3-21 when the impact location was at the fourth post of the transition rail (counting the transition posts from the system connection to the multifunctional LON barrier system). The results from this predictive impact simulation indicated that the pickup truck was contained and redirected while maintaining vehicle stability throughout the impact event. The occupant risk factors (OIV and ORA) were all within MASH limits. According to these predicted results, the conducted simulation indicated that the transition design system was likely to perform acceptably per MASH Test 3-21 and evaluation criteria when impacted at the fourth transition post.
Table 72. Predictive impact simulation of MASH Test 3-21: Case 1—impact location 2 ft upstream of fourth transition post.
| Impact Location Views | |||||
|---|---|---|---|---|---|
 |
 |
 |
 |
||
| Top View | Front View | Back View | Side View | ||
| Simulation Frames | |||||
 |
 |
 |
 |
||
| 0.1 s | 0.2 s | 0.3 s | 0.4 s | ||
|
General Information Test Agency: Texas A&M Transportation Institute Test No. MASH 3-21 Test Article Type: Transition to Pedestrian Rail Name: Barrier to Shield Pedestrians, Bicyclists and Other Vulnerable Users from Motor Vehicle Test Vehicle Type/Designation: 2270P Make and Model: Dodge Ram Curb: 5,000 lb |
Impact Conditions Speed: 62 mi/h Angle: 25 deg Location/Orientation: 2 ft upstream of fourth transition post Occupant Risk Values Longitudinal (X) OIV: 22.9 ft/s Lateral (Y) OIV: 18.3 ft/s Longitudinal (X) ORA: 8.1 g Lateral (Y) ORA: 7.3 g |
Vehicle Stability Maximum Roll Angle: 4.2 deg Maximum Pitch Angle: 5.6 deg Maximum Yaw Angle: 33.5 deg Rail Displacement Maximum: 31.5 in. Permanent: 27.8 in. |
|||
Case 3: Impact Location 2 ft Downstream of Fourth Transition Post
Table 74 summarizes the results from the predictive impact simulation of MASH Test 3-21 when the impact location was 2 ft downstream of the fourth post of the transition rail (counting the transition posts from the system connection to the multifunctional LON barrier system). The results from this predictive impact simulation indicated that the pickup truck was contained and redirected while maintaining vehicle stability throughout the impact event. The occupant risk factors (OIV and ORA) were all within MASH limits. According to these predicted results, the conducted simulation indicated that the transition design system was likely to perform acceptably per MASH Test 3-21 and evaluation criteria when impacted 2 ft downstream of the fourth transition post.
Case 4: Impact Location 2 ft Upstream of Second Transition Post
Table 75 summarizes the results from the predictive impact simulation of MASH Test 3-21 when the impact location was 2 ft upstream of the second post of the transition rail (counting the transition posts from the system connection to the multifunctional LON barrier system). The results from this predictive impact simulation indicated that the pickup truck was contained and redirected while maintaining vehicle stability throughout the impact event. The occupant risk factors (OIV and ORA) were all within MASH limits. According to these predicted results, the conducted simulation indicated that the transition design system was likely to perform
Table 73. Predictive impact simulation of MASH Test 3-21: Case 2—impact location at the fourth transition post.
| Impact Location Views | |||||
|---|---|---|---|---|---|
 |
 |
 |
 |
||
| Top View | Front View | Back View | Side View | ||
| Simulation Frames | |||||
 |
 |
 |
 |
||
| 0.1 s | 0.2 s | 0.3 s | 0.4 s | ||
|
General Information Test Agency: Texas A&M Transportation Institute Test No. MASH 3-21 Test Article Type: Transition to Pedestrian Rail Name: Barrier to Shield Pedestrians, Bicyclists and Other Vulnerable Users from Motor Vehicles Test Vehicle Type/Designation: 2270P Make and Model: Dodge Ram Curb: 5,000 lb |
Impact Conditions Speed: 62 mi/h Angle: 25 deg Location/Orientation: At fourth transition post Occupant Risk Values Longitudinal (X) OIV: 19.4 ft/s Lateral (Y) OIV: 18.1 ft/s Longitudinal (X) ORA: 7.7 g Lateral (Y) ORA: 9.9 g |
Vehicle Stability Maximum Roll Angle: 10.2 deg Maximum Pitch Angle: 5.6 deg Maximum Yaw Angle: 40.9 deg Rail Displacement Maximum: 30.6 in. Permanent: 25.7 in. |
|||
acceptably per MASH Test 3-21 and evaluation criteria when impacted 2 ft upstream of the second transition post.
Conclusion
Table 76 provides a comprehensive summary of the results of the 2270P predictive simulation. The conducted simulations seem to indicate that the design of the transition system is likely to perform acceptably per MASH Test 3-21 and evaluation criteria. Case 1 recorded the largest dynamic lateral deflection of the transition system upon impact, which could be an indication of a greater potential for pocketing and snagging on the end of the multifunctional barrier.
MASH Test 3-20: Predictive Investigation of Crashworthiness of Transition
The research team conducted a parametric investigation of the potential CIP for the passenger car vehicle (1100C), similar to the investigation conducted for the pickup truck. Only one of the conducted cases is reported here, however, since the simulation results predicted the potential for the transition system to perform unacceptably per MASH Test 3-20 and evaluation criteria.
Figure 101 presents sequential screenshots from the results of the predictive impact simulation of MASH Test 3-20 when the impact location was 1.5 ft upstream of the fourth post of the
Table 74. Predictive impact simulation of MASH Test 3-21: Case 3—impact location 2 ft downstream of fourth transition post.
| Impact Location Views | |||||
|---|---|---|---|---|---|
 |
 |
 |
 |
||
| Top View | Front View | Back View | Side View | ||
| Simulation Frames | |||||
 |
 |
 |
 |
||
| 0.1 s | 0.2 s | 0.3 s | 0.4 s | ||
|
General Information Test Agency: Texas A&M Transportation Institute Test No. MASH 3-21 Test Article Type: Transition to Pedestrian Rail Name: Barrier to Shield Pedestrians, Bicyclists and Other Vulnerable Users from Motor Vehicles Test Vehicle Type/Designation: 2270P Make and Model: Dodge Ram Curb: 5,000 lb |
Impact Conditions Speed: 62 mi/h Angle: 25 deg Location/Orientation: 2 ft downstream of the fourth transition post Occupant Risk Values Longitudinal (X) OIV: 19.3 ft/s Lateral (Y) OIV: 18.2 ft/s Longitudinal (X) ORA: 6.9 g Lateral (Y) ORA: 10.0 g |
Vehicle Stability Maximum Roll Angle: 18.2 deg Maximum Pitch Angle: 4.9 deg Maximum Yaw Angle: 40.5 deg Rail Displacement Maximum: 29.1 in. Permanent: 23.5 in. |
|||
transition rail (counting the transition posts from the system connection to the multifunctional LON barrier system).
Table 77 summarizes the results of the predictive impact simulation of MASH Test 3-20 when the impact location was 1.5 ft upstream of the fourth post of the transition rail. The results from this predictive impact simulation indicate high values for occupant risk factors. Specifically, the predicted OIV in the longitudinal direction was 42.4 ft/s, which is higher than the maximum value allowed by MASH of 40 ft/sec.
The high (and unacceptable) occupant risk value seems to originate from snagging of the passenger car and the post/rub rail system. The simulation frames indicate that the vehicle tire underrides the W-beam system and fully engages the impacted transition posts. The transition post immediately adjacent to the end of the rub rail seems to be constrained from deflecting longitudinally by the presence of the rub rail itself. The limitation of the post movement results in high-impact velocity for the impacting passenger car. The passenger car, in fact, is not efficiently redirected upon impact, as desired.
These predicted results from the conducted simulation indicate that the transition design system would likely not perform per MASH Test 3-20 and evaluation criteria when impacted at 1.5 ft upstream of the fourth transition post. Design modifications are required to address the potential for snagging and pocketing of the passenger car vehicle during the impact event.
Table 75. Predictive impact simulation of MASH Test 3-21: Case 4—impact location 2 ft upstream of second transition post.
| Impact Location Views | |||||
|---|---|---|---|---|---|
 |
 |
 |
 |
||
| Top View | Front View | Back View | Side View | ||
| Simulation Frames | |||||
 |
 |
 |
 |
||
| 0.1 s | 0.2 s | 0.3 s | 0.4 s | ||
|
General Information Test Agency: Texas A&M Transportation Institute Test No. MASH 3-21 Test Article Type: Transition to Pedestrian Rail Name: Barrier to Shield Pedestrians, Bicyclists and Other Vulnerable Users from Motor Vehicles Test Vehicle Type/Designation: 2270P Make and Model: Dodge Ram Curb: 5,000 lb |
Impact Conditions Speed: 62 mi/h Angle: 25 deg Location/Orientation: 2 ft upstream of second transition post Occupant Risk Values Longitudinal (X) OIV: 16.1 ft/s Lateral (Y) OIV: 19.1 ft/s Longitudinal (X) ORA: 6.3 g Lateral (Y) ORA: 9.7 g |
Vehicle Stability Maximum Roll Angle: 23.7 deg Maximum Pitch Angle: 5.8 deg Maximum Yaw Angle: 38.5 deg Rail Displacement Maximum: 24.1 in. Permanent: 23.5 in. |
|||
Table 76. Summary table of MASH Test 3-21 CIP analysis.
| Variable | Measurement | Variable | Measurement |
|---|---|---|---|
| Case 1: 2270P—2 ft upstream of fourth transition post | Case 3: 2270P—2 ft downstream of fourth transition post | ||
| Deflection (in.) | Deflection (in.) | ||
| Dynamic | 32.5 | Dynamic | 29.1 |
| Permanent | 28.0 | Permanent | 23.5 |
| OIV (ft/s) | OIV (ft/s) | ||
| X | 22.9 | X | 19.3 |
| Y | 18.3 | Y | 18.2 |
| Stability (deg) | Stability (deg) | ||
| Roll | 4.2 | Roll | 18.2 |
| Pitch | 5.6 | Pitch | 4.9 |
| Yaw | 33.5 | Yaw | 40.5 |
| Ridedown acceleration (g) | Ridedown acceleration (g) | ||
| X | 8.1 | X | 6.9 |
| Y | 7.3 | Y | 10 |
| Case 2: 2270P—at fourth transition post | Case 4: 2270P—2 ft upstream of second transition post | ||
| Deflection (in.) | Deflection (in.) | ||
| Dynamic | 30.6 | Dynamic | 24.5 |
| Permanent | 25.7 | Permanent | 19.7 |
| OIV (ft/s) | OIV (ft/s) | ||
| X | 19.4 | X | 16.1 |
| Y | 18.1 | Y | 19.1 |
| Stability (deg) | Stability (deg) | ||
| Roll | 10.2 | Roll | 23.7 |
| Pitch | 5.6 | Pitch | 5.8 |
| Yaw | 40.9 | Yaw | 38.5 |
| Ridedown acceleration (g) | Ridedown acceleration (g) | ||
| X | 7.7 | X | 6.3 |
| Y | 9.9 | Y | 9.7 |

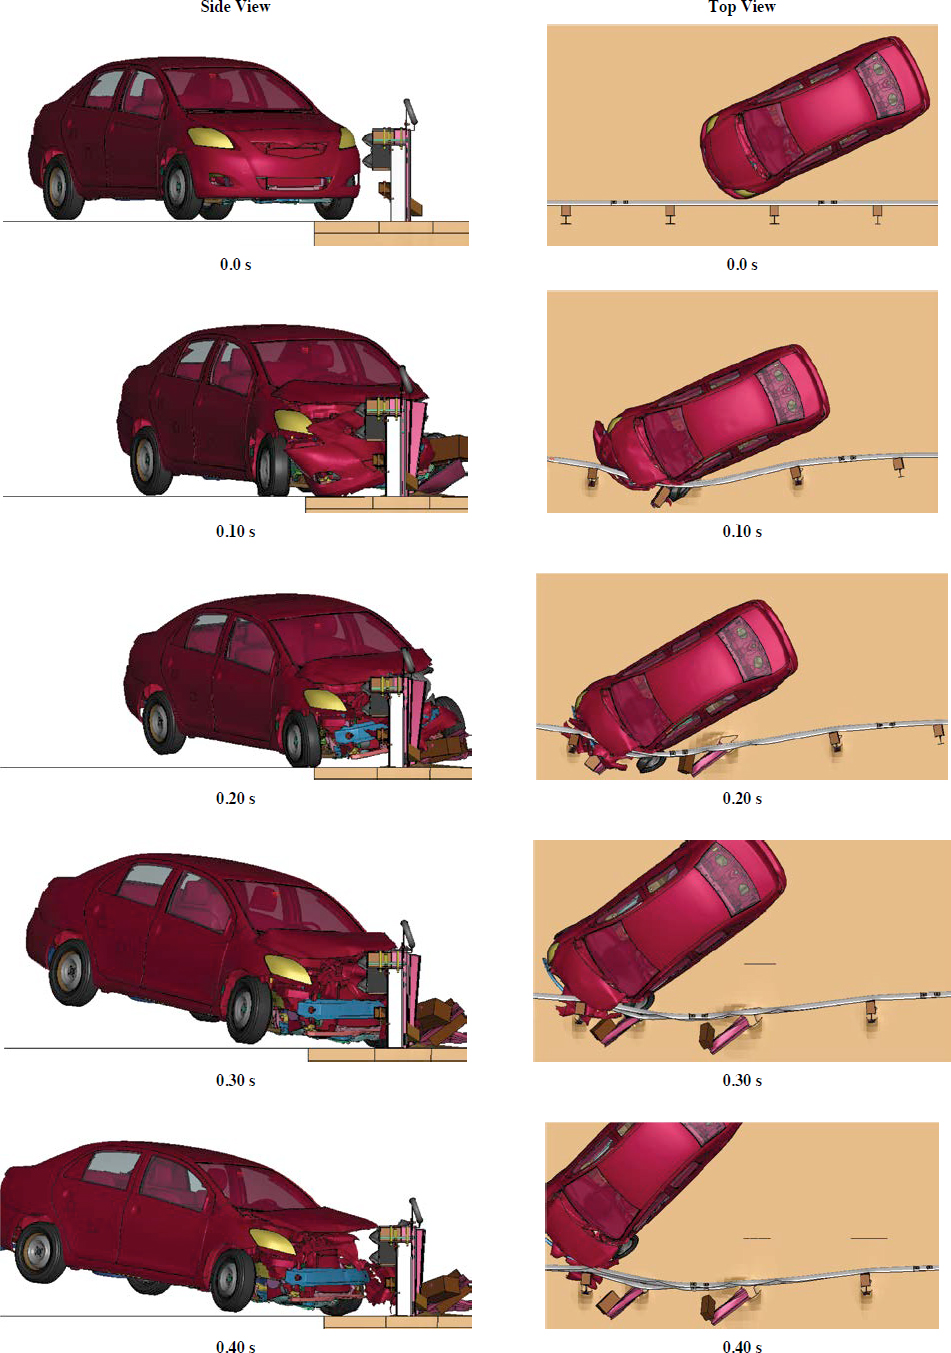
Table 77. Predictive impact simulation of MASH Test 3-20: Impact location 1.5 ft upstream of fourth transition post.
| Impact Location Views | |||||
|---|---|---|---|---|---|
 |
 |
 |
 |
||
| Top View | Front View | Back View | Side View | ||
| Simulation Frames | |||||
 |
 |
 |
 |
||
| 0.00 s | 0.1 s | 0.2 s | 0.5 s | ||
|
General Information Test Agency: Texas A&M Transportation Institute Test No. MASH 3-20 Test Article Type: Transition to Pedestrian Rail Name: Barrier to Shield Pedestrians, Bicyclists and Other Vulnerable Users from Motor Vehicles Test Vehicle Type/Designation: 1100C Make and Model: Toyota Yaris Curb: 2,443 lb |
Impact Conditions Speed: 62 mi/h Angle: 25 deg Location/Orientation: 1.5 ft upstream of fourth transition post Occupant Risk Values Longitudinal (X) OIV: 42.4 ft/s Lateral (Y) OIV: 18.9 ft/s Longitudinal (X) ORA: 18.4 g Lateral (Y) ORA: 12.4 g |
Vehicle Stability Maximum Roll Angle: 8.4 deg Maximum Pitch Angle: 3.1 deg Maximum Yaw Angle: 27.0 deg Rail Displacement Maximum: 22.8 in. Permanent: 16.1 in. |
|||
Predictive Finite Element Analysis of Crashworthiness of the Modified W-Beam Transition Design with Extended Rub Rail
Following an initial discussion with the project panel members, the project team members prioritized the continued investigation of a W-beam transition with added rub rail. This section provides the details for the transition system with extended rub rail and computer simulation results. The computer simulations helped determine the crashworthiness of the proposed design.
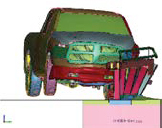
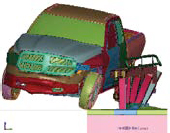
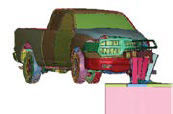
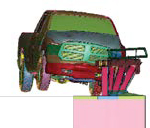
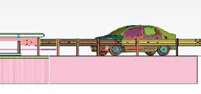
Figure 102 shows the general overview of the FE model of the proposed extended rub rail design. The multifunctional barrier would be connected to the 50-ft-long W-beam guardrail and nonproprietary terminal via a W-beam transition component. Figure 103 provides specific details of the FE model of the proposed transition. The proposed design of the transition system included a W-beam segment directly attached to the traffic rail and a spacer (HSS 12 × 8 × ¼ × 30 in.) through a W-beam terminal connector. The spacer was connected to the traffic rail through three ¾- × 16-in. hex A449 bolts (see Figure 103a).
The cane rail was terminated behind the last post of the multifunctional LON barrier, while the traffic rail, handrail, and rub rail of the multifunctional LON barrier were extended past the LON’s last post (see Figure 102b and Figure 103a). A terminal handrail component is suggested to connect the two handrails of the system’s LON.
As shown in Figure 102c, the rub rail (HSS 4 × 4 × ¼ × 30 in.) was flared behind the first post of the second W-beam of the proposed transition to limit the potential for snagging of the impacting vehicle. The end of the rub rail was connected to the post to eliminate the potential issues caused by the relatively long hanging rub rail (Figure 103b).
The proposed transition length was 6.25 ft and was supported by five standard W6 × 8.5 × 72-in. steel posts with two 9.375-in. spacings and two quarter (18.75 in.) spacings. The overall modeling technique and material/contact properties were similar to those utilized and described in the discussion of the multifunctional barrier LON in Chapter 6.
The full MASH TL-3 matrix includes two tests: MASH Test 3-20 (passenger car, 62-mi/h nominal speed and 25-deg nominal orientation angle) and MASH Test 3-21 (pickup truck, 62-mi/h nominal speed and 25-deg nominal orientation angle). The research team conducted simulations to replicate the impact of the passenger car vehicle (1100C) at various locations of the proposed transition design, since the passenger car showed more critical behavior than the pickup truck (2270P), as addressed in the previous section.
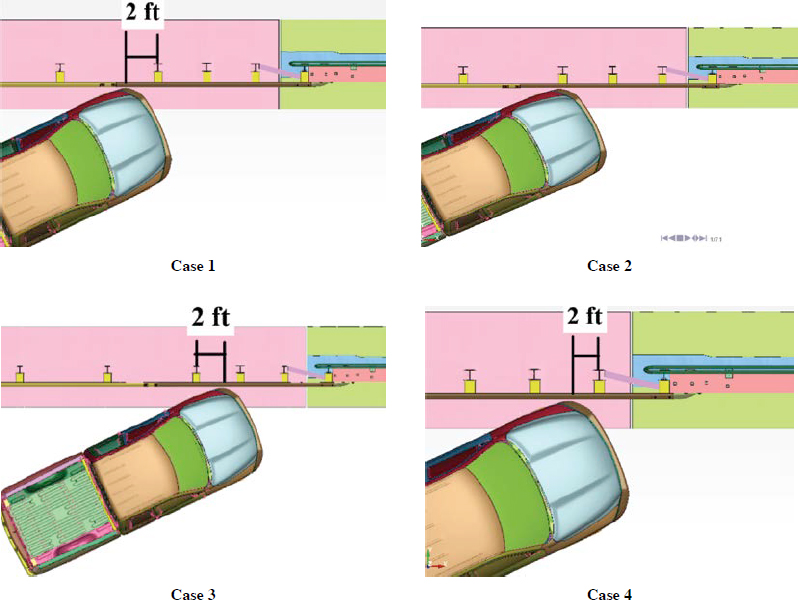
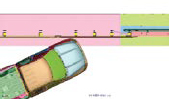
MASH recommends performing a parametric investigation of the critical location of impact to identify the system CIP, which is the impact point that maximizes the risk of failure of the system’s crashworthiness. The following impact points were considered in the investigation of the system’s crashworthiness during the 1100C impact (Figure 104):
- Case 1: Impact location = 1 ft upstream of fifth transition post.
- Case 2: Impact location = 1 ft downstream of fifth transition post.
- Case 3: Impact location = 3 ft upstream of fifth transition post.
- Case 4: Impact location = 7 ft upstream of sixth transition post (end of rub rail).
- Case 5: Impact location = 4 ft upstream of sixth transition post (end of rub rail).
The selection of impact points was based on previous transition design and testing experience. Cases 1 through 3 were selected to maximize the potential for vehicle instability and pocketing on the end of the multifunctional barrier (at the downstream transition location, i.e., near the transition connection with the multifunctional LON barrier system). Cases 4 and 5 were selected

to maximize the interaction between the end of the rub rail and the vehicle at the upstream location (i.e., near the transition connection with the W-beam guardrail LON).
According to the computational investigation of downstream impact points (Cases 1, 2, and 3), the passenger car was successfully contained and redirected. Moreover, the occupant risk factors met the MASH TL-3 evaluation criteria.
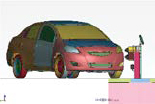
Simulations for Cases 4 and 5 were conducted to investigate the interaction between the end of the rub rail and the vehicle. While the results of Case 4 met the MASH TL-3 evaluation criteria, the OIV in Case 5 was 45.9 ft/s, which exceeded the maximum MASH TL-3 limit of 40 ft/s. Figure 105 shows sequential images of the impact simulation in Case 5. Table 78 shows the occupant risk factors that were determined with TRAP.
Closer analysis of the Case 5 simulation results found little interaction between the impacting passenger car and the end of the rub rail, and vehicle deceleration that led to the high OIV were attributed to wheel-post snagging. Absent additional constraints on the post, a guardrail post would not typically be expected to generate wheel snagging forces that result in unacceptable OIV. It was, therefore, theorized that these unacceptably high post snagging forces could be attributable to limitations in the vehicle suspension model and absence of applicable suspension failure modes. Another computer simulation (Case 6) was conducted to further investigate the behavior of the FE vehicle model. In this simulation, the rub rail was removed from the transition system to create a configuration that should behave similarly to a conventional MGS with 8-in. offset blocks. The same impact point used in Case 5 (i.e., 4 ft upstream of sixth transition post) was used in this new simulation. Table 79 lists the occupant risk factors computed from the simulation results, and Figure 106 shows the sequential images from this Case 6 simulation.
Since the system for Case 6 did not have a rub rail at the impact point and was essentially a W-beam guardrail section with standard 6-ft 3-in. post spacing, the results of the simulation were expected to be similar to those of a previous MASH Test 3-10 conducted on an MGS with 8-in. offset blocks (33). However, as shown in Figure 106, the vehicular behavior and occupant risk indices were more similar to those of Case 5 on the upstream end of the transition and rub rail rather than to the MASH TL-3 compliant guardrail system. The degree of snagging on the posts was excessive. In fact, the OIV was slightly higher in Case 6 without the rub rail (48.2 ft/s)
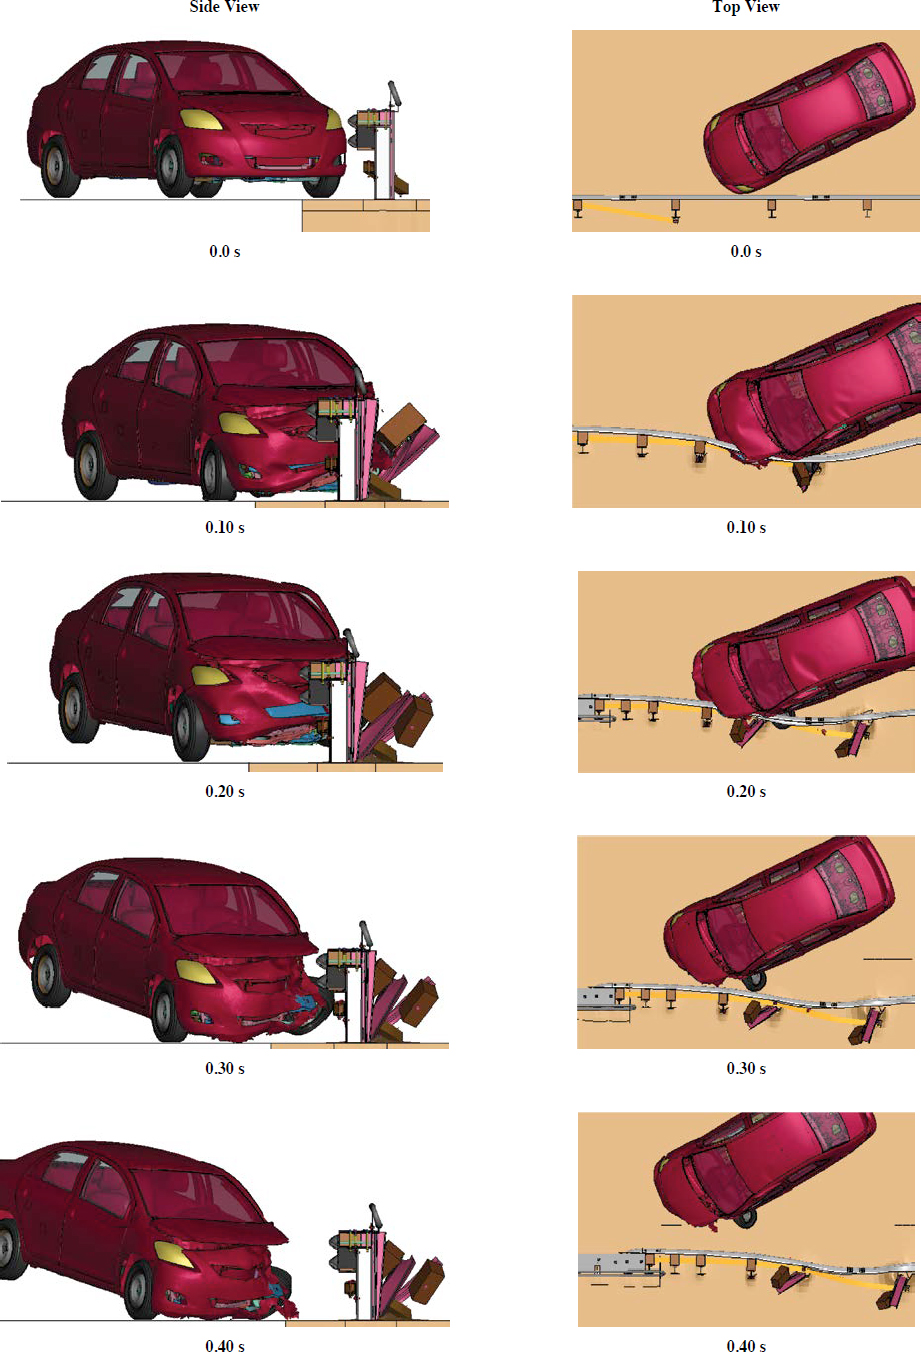
Table 78. Occupant risk factors for Case 5 (TRAP results).
| Variable | Value |
|---|---|
| Impact velocity (ft/s) | |
| X | 45.9 |
| Y | −20.3 |
| Ridedown acceleration (g) | |
| X | −15.6 |
| Y | 11.1 |
| Maximum angle (deg) | |
| Roll | 12.5 |
| Pitch | 10.3 |
| Yaw | −15.6 |
than in Case 5 with the rub rail (45.9 ft/s). It became apparent that the high OIV values computed for Case 5 were related to limitations in the vehicle model suspension that created wheel contact forces that were likely not realistic or reflective of the behavior of the transition system. However, the available project resources were insufficient to conduct the further investigations that would be necessary to validate changes to the vehicle model and further evaluate the performance of the W-beam transition with rub rail. Without this further evaluation, it is difficult to provide any professional opinion on the upstream transition.
Therefore, the research team decided to further evaluate the Thrie beam transition system as an alternative option because the project budget included only two transition crash tests for the downstream end. Whereas the W-beam transition with rub rail would require additional testing on the upstream end for a total of four crash tests (two on the downstream end and two on the upstream end), the Thrie beam transition could be evaluated with two tests on the downstream end, since the MASH compliance of the upstream end of the Thrie beam transition had already been established through a professional opinion developed under the Roadside Safety Pooled Fund program (34).
Table 79. Occupant risk factors for Case 6 (TRAP results).
| Variable | Value |
|---|---|
| Impact velocity (ft/s) | |
| X | 48.2 |
| Y | −16.4 |
| Ridedown acceleration (g) | |
| X | −16.5 |
| Y | 6.6 |
| Maximum angle (deg) | |
| Roll | 12.0 |
| Pitch | 10.2 |
| Yaw | −34.6 |