Development of a MASH Barrier to Shield Pedestrians, Bicyclists, and Other Vulnerable Users from Motor Vehicles (2024)
Chapter: 6 Finite Element Analysis for Barrier System Design Option

CHAPTER 6
Finite Element Analysis for Barrier System Design Option
This chapter provides details about the FE model developed to address the modifications discussed in the previous chapter. The overall modeling technique was the same as discussed in Chapter 5. Some changes were incorporated to optimize the model and make it more realistic. The CNRB connections between the posts and the rails were replaced with a bolted connection along with brackets. The details for the bolts and brackets were obtained from the drawings. The handrail was connected with the traffic rail via spot-weld connection. The cane rail with splice was attached to the posts with CNRBs.
Other modifications in the FE model design were as follows:
- Post spacing was increased to 22 in., 44 in., and 66 in.
- For the 22-in. post spacing options, the angle brackets used to connect the rails to the posts were at each post for the lower rub rail.
- The spliced box sections for both the rails were replaced with simple plate splices with a thickness of 0.5 in.
- The rub rail thickness was increased from ⅛ in. to ¼ in. after several preliminary simulations indicated vehicle instability issues due to a light rub rail section.
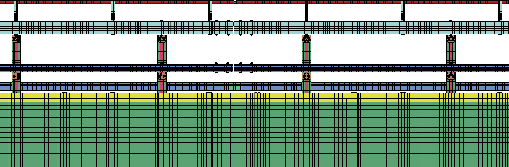
Figure 64 shows the updated FE model with the latest modifications for 22-in. post spacing. The model has a different handrail design than shown in the figure, however, as the handrail design was modified after preliminary simulations to further optimize it from the perspective of cost, fabrication, installation, and transportation. The researchers anticipated that such minor changes in the design would not interfere with the crashworthiness of the system. The remaining parts of the modeled design stayed the same as the final proposed options. Thus, the researchers anticipated that MASH test results would not be affected by the minor changes to the handrail design. Also, the new handrail design protrudes less outside the plane of vertical posts, which makes it more conservative with regard to deflection as compared with the simulation model. This chapter discusses the predictive simulations for MASH Tests 3-10 and 3-11 and presents the results.
Predictive Simulations with LS-DYNA for MASH Test 3-11 on Developed Barrier Models
Simulations with the available pickup truck model were performed on the developed barrier with the different post spacing under consideration (22 in. and 44 in.).
Simulations with 22-in. Post Spacing
To parametrically evaluate the barrier system, simulations with different impact points were performed. As discussed, MASH requires that full-scale crash tests be conducted at the critical

impact point (CIP) to maximize the potential that the crashworthiness of the system will fail. To determine the CIP for the system, different impact points are considered to evaluate the system within the range of tolerances. Simulations with a truck impacting at 2.3 ft, 4.3 ft, and 6.3 ft upstream of the splice were performed to parametrically evaluate the system. The distance of 4.3 ft corresponds to the CIP distance in MASH for Test 3-11 with the pickup truck for rigid barriers. Since the multifunction barrier is not rigid, the impact location was varied ±2 ft from this point to determine the appropriate CIP for the barrier. The results are shown in Figure 65. The postprocessing results for each simulation conducted are summarized in Table 41.
The results showed that all simulations satisfied the MASH limits for crashworthiness. Note that the MASH limit for stability (75 deg) is only applicable to roll and pitch. The TTI researchers
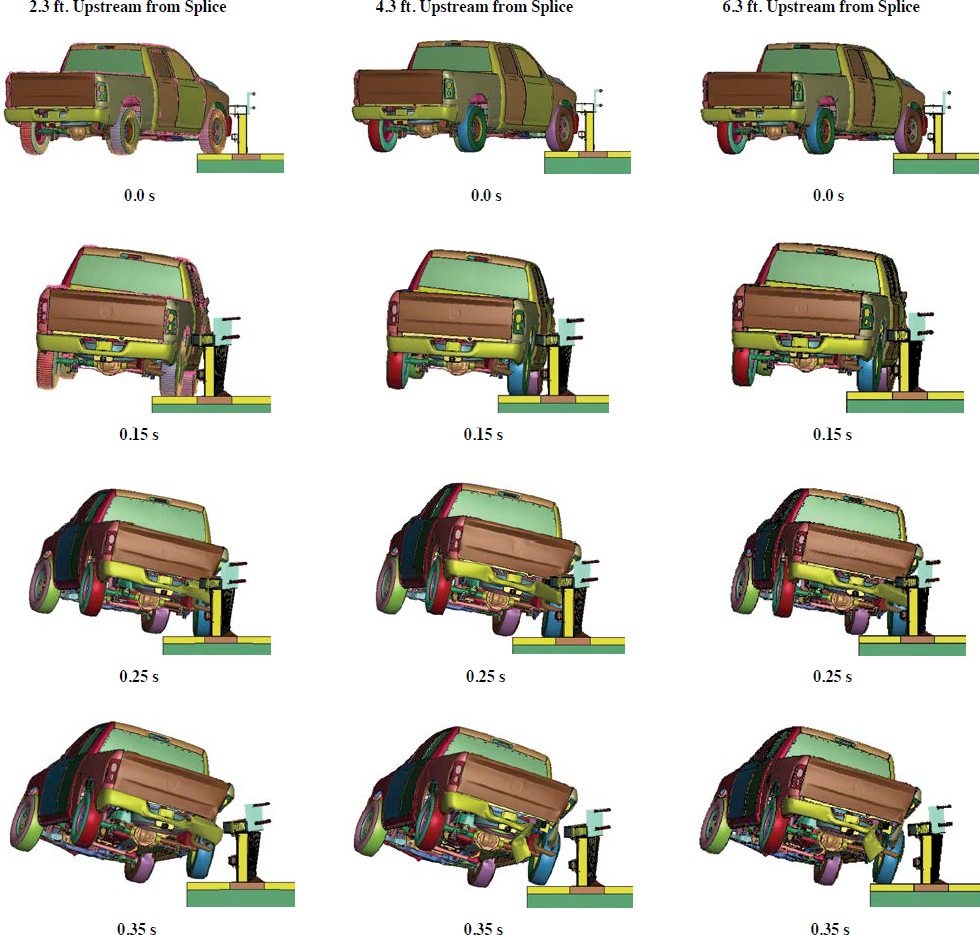
Table 41. Summary table of MASH Test 3-11 CIP analysis (22 in.).
| Variable | Measurement | MASH Limits |
|---|---|---|
| 2.3 ft Upstream from Splice | ||
| Deflection (in.) | ||
| Handrail | 11.11 | N/A |
| Traffic rail | 10.71 | N/A |
| Rub rail | 7.44 | N/A |
| OIV (ft/s) | ||
| X | 7.22 | 40 |
| Y | 32.5 | 40 |
| Stability (deg) | ||
| Roll | 14.7 | 75 |
| Pitch | 11.3 | 75 |
| Yaw | 46.5 | — |
| Ridedown acceleration (g) | ||
| X | 5.0 | 20.49 |
| Y | 15.5 | 20.49 |
| 4.3 ft Upstream from Splice | ||
| Deflection (in.) | ||
| Handrail | 10.67 | N/A |
| Traffic rail | 10.32 | N/A |
| Rub rail | 7.6 | N/A |
| OIV (ft/s) | ||
| X | 5.91 | 40 |
| Y | 30.51 | 40 |
| Stability (deg) | ||
| Roll | 14 | 75 |
| Pitch | 11.4 | 75 |
| Yaw | 57.5 | — |
| Ridedown acceleration (g) | ||
| X | 5.4 | 20.49 |
| Y | 15.5 | 20.49 |
| 6.3 ft Upstream from Splice | ||
| Deflection (in.) | ||
| Handrail | 9.65 | N/A |
| Traffic rail | 9.33 | N/A |
| Rub rail | 6.5 | N/A |
| OIV (ft/s) | ||
| X | 4.6 | 40 |
| Y | 30.18 | 40 |
| Stability (deg) | ||
| Roll | 13.8 | 75 |
| Pitch | 16.2 | 75 |
| Yaw | 110.8 | — |
| Ridedown acceleration (g) | ||
| X | 7.4 | 20.49 |
| Y | 15 | 20.49 |
suggested the CIP for the pickup truck impacting the system be at 6.3 ft upstream of the splice of the rails for Test 3-11 (22 in.) after the deflection results, occupant risk results, and overall stability of the pickup truck in the predictive crash test simulations were compared.
Simulations with 44-in. Post Spacing (with Smaller Rub Rail)
To parametrically evaluate the barrier system, simulations with different impact points were performed. Simulations with the truck impacting at 2.3 ft, 4.3 ft, and 6.3 ft upstream from the splice were performed.
The 44-in. option was simulated with the same size rub rail as the 22-in. option. However, preliminary simulations suggested the pickup truck rolling over in one of the CIP evaluation crash tests. Thus, researchers modified the bottom rub rail with a larger size to reduce tire interaction and prevent a higher roll angle of the truck. Simulation with the truck rollover is shown in Figure 66. The postprocessing results for each simulation conducted are summarized in Table 42.
Since preliminary simulations suggested the pickup truck rolling over in one of the CIP evaluation crash tests, researchers modified the bottom rub rail with a larger size to reduce tire interaction and prevent a higher roll angle of the truck. Even though the simulation results satisfied the MASH criteria for two of the impact points, one point failed the evaluation tests and, thus, per the MASH CIP recommendation, that would be the critical location for testing. The maximum dynamic deflection of 17 in. was obtained at the impact location of 2.3 ft upstream from the splice. This was higher than the preferred limit of 12 in. (1 ft). The permanent deflection in the same case was 12.3 in., which was close to the preferred limit of 12 in. (1 ft).
Simulations with 44-in. Post Spacing with Modification (Larger Rub Rail)
As discussed in the previous section, the preliminary simulations suggested the pickup truck rolling over in one of the CIP evaluation crash tests. Thus, the researchers had to modify the bottom rub rail with a larger size to reduce tire interaction and prevent a higher roll angle of the truck. The results for the larger rub rail model with the truck impacting at 2.3 ft, 4.3 ft, and 6.3 ft upstream from the splice are shown in Figure 67. The postprocessing results for each simulation conducted are shown in Table 43.
Results show that all simulations satisfied the MASH limits for crashworthiness. Note that the MASH limit for stability (75 deg) is only applicable to roll and pitch. The maximum dynamic deflection of 16.6 in. was obtained at the impact location of 2.3 ft upstream from the splice. This was smaller than the desired deflection limit of 24 in. (2 ft) proposed by project panel members in the kickoff meeting, and it was higher than the preferred limit of 12 in. (1 ft). The permanent deflection in the same case was 12.1 in., which was very close to the preferred limit of 12 in. (1 ft). On the basis of the simulation results, the TTI researchers suggested the CIP for the pickup impacting the system at 4.3 ft upstream of the splice of the rails for Test 3-11 (44 in.) after the occupant risk results, deflection values, and overall stability of the truck in the crash test simulations were compared.
Predictive Simulations with LS-DYNA for MASH Test 3-10 on Developed Barrier Models
Simulations with the available passenger car model were performed on the developed barrier with different post spacings under consideration (22 in. and 44 in.).
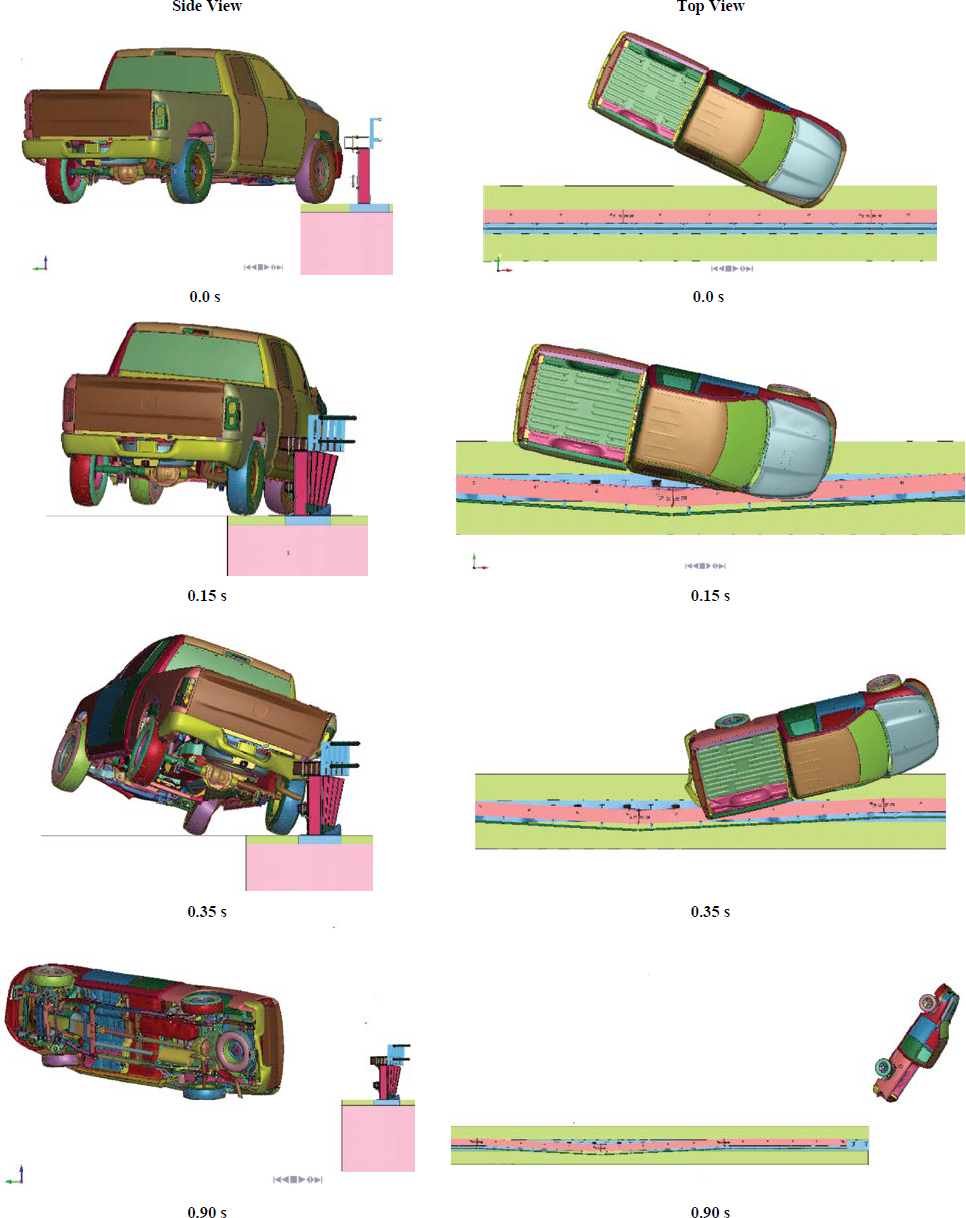
Table 42. Summary table of MASH Test 3-11 CIP analysis (44 in. with smaller rub rail).
| Variable | Measurement | MASH Limits |
|---|---|---|
| 2.3 ft Upstream from Splice | ||
| Maximum deflectiona (in.) | ||
| Handrail | 17.0 | N/A |
| (12.3) | ||
| Traffic rail | 16.2 | N/A |
| (11.9) | ||
| Rub rail | 9.9 | N/A |
| (7.7) | ||
| OIV (ft/s) | ||
| X | 20.0 | 40 |
| Y | 24.9 | 40 |
| Stability (deg) | ||
| Roll | 14.4 | 75 |
| Pitch | 3.2 | 75 |
| Yaw | 47.8 | — |
| Ridedown acceleration (g) | ||
| X | 6.8 | 20.49 |
| Y | 12.0 | 20.49 |
| 4.3 ft Upstream from Splice | ||
| Maximum deflectiona (in.) | ||
| Handrail | 15.9 | N/A |
| (11.5) | ||
| Traffic rail | 15.2 | N/A |
| (11.2) | ||
| Rub rail | 11.2 | N/A |
| (7.9) | ||
| OIV (ft/s) | ||
| X | 21.6 | 40 |
| Y | 24.6 | 40 |
| Stability (deg) | ||
| Roll | 80.4 | 75 |
| (over limit) | ||
| Pitch | 8.2 | 75 |
| Yaw | 79.8 | — |
| Ridedown acceleration (g) | ||
| X | 17.6 | 20.49 |
| Y | 10.7 | 20.49 |
| 6.3 ft Upstream from Splice | ||
| Maximum deflectiona (in.) | ||
| Handrail | 15.2 | N/A |
| (11.1) | ||
| Traffic rail | 14.4 | N/A |
| (10.9) | ||
| Rub rail | 9.6 | N/A |
| (7.0) | ||
| Variable | Measurement | MASH Limits |
|---|---|---|
| OIV (ft/s) | ||
| X | 16.7 | 40 |
| Y | 21.7 | 40 |
| Stability (deg) | ||
| Roll | 26.4 | 75 |
| Pitch | 6.4 | 75 |
| Yaw | 98.9 | — |
| Ridedown acceleration (g) | ||
| X | 7.4 | 20.49 |
| Y | 12.6 | 20.49 |
aPermanent deflection is given in parentheses.
Simulations with 22-in. Post Spacing
To parametrically evaluate the barrier system, simulations with different impact points were performed. Simulations with the car impacting at 1.6 ft, 3.6 ft, and 5.6 ft upstream from the splice were performed. The distance of 3.6 ft corresponds to the CIP distance in MASH for Test 3-10 with the passenger car for rigid barriers. Since the multifunction barrier is not rigid, the impact location was varied ±2 ft from this point to determine the appropriate CIP for the barrier. The results are shown in Figure 68. The postprocessing results for each simulation are summarized in Table 44.
The results show that all simulations satisfied the MASH limits for crashworthiness. On the basis of the simulation results, the TTI researchers suggested the CIP for the car impacting the system at 3.6 ft upstream of the splice of the rails for Test 3-10 (22 in.) after the occupant risk results and overall stability of the car in the crash test simulations were compared.
Simulations with 44-in. Post Spacing
To parametrically evaluate the barrier system, simulations with different impact points were performed. Simulations with the car impacting at 1.6 ft, 3.6 ft, and 5.6 ft upstream from the splice were performed. The results are shown in Figure 69. The postprocessing results for each simulation conducted are summarized in Table 45.
The results show that all simulations satisfied the MASH limits for system crashworthiness. On the basis of the simulation results, the researchers suggested the CIP for the car impacting the system at 3.6 ft upstream of the splice of the rails for Test 3-10 (44 in.). The test article included a larger rub rail in the design for the 44-in. post spacing because the 44-in. post spacing with a small rub rail failed Test 3-11.
Predictive Simulations for MASH Tests 3-10 and 3-11 on Barrier Models with 66-in. Post Spacing
Considering the results obtained from the tests of 22-in. and 44-in. post spacing, the researchers saw the opportunity to increase the post spacing and further optimize the design. For this purpose, the post spacing was increased to 66 in., and simulations were conducted to check the MASH limits along with maximum deflection requirements. This option would reduce the number of posts and connections, making the system much more cost effective as compared with previous options.
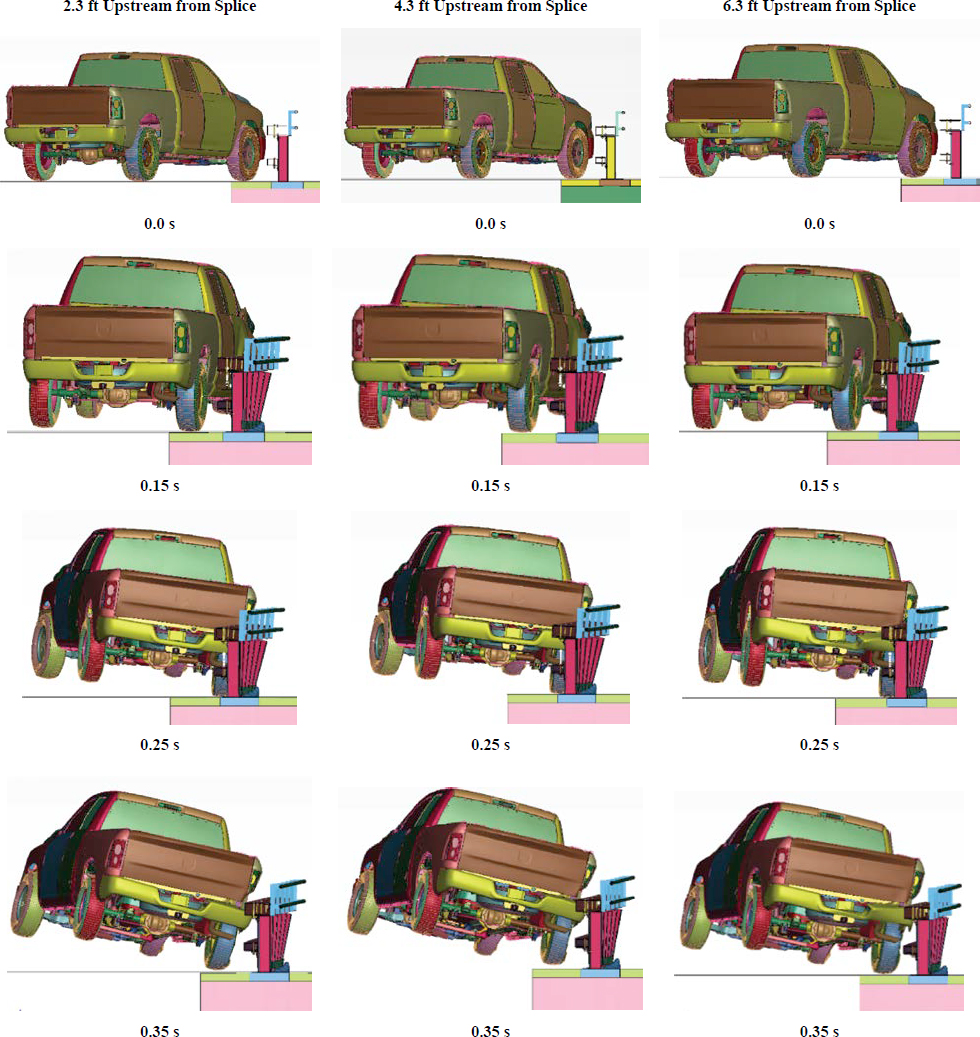
Table 43. Summary table of MASH Test 3-11 CIP analysis (44 in. with larger rub rail).
| Variable | Measurement | MASH Limits |
|---|---|---|
| 2.3 ft Upstream from Splice | ||
| Maximum deflectiona (in.) | ||
| Handrail | 16.6 | N/A |
| (12.1) | ||
| Traffic rail | 15.4 | N/A |
| (11.7) | ||
| Rub rail | 10.4 | N/A |
| (7.9) | ||
| Variable | Measurement | MASH Limits |
|---|---|---|
| OIV (ft/s) | ||
| X | 20.0 | 40 |
| Y | 24.9 | 40 |
| Stability (deg) | ||
| Roll | 27.6 | 75 |
| Pitch | 4.6 | 75 |
| Yaw | 81.1 | — |
| Ridedown acceleration (g) | ||
| X | 7.0 | 20.49 |
| Y | 11.4 | 20.49 |
| 4.3 ft Upstream from Splice | ||
| Maximum deflectiona (in.) | ||
| Handrail | 16.1 | N/A |
| (11.4) | ||
| Traffic rail | 15.3 | N/A |
| (11.1) | ||
| Rub rail | 10.1 | N/A |
| (7.5) | ||
| OIV (ft/s) | ||
| X | 19.4 | 40 |
| Y | 23.3 | 40 |
| Stability (deg) | ||
| Roll | 30.6 | 75 |
| Pitch | 4.5 | 75 |
| Yaw | 93.7 | — |
| Ridedown acceleration (g) | ||
| X | 5.0 | 20.49 |
| Y | 15.5 | 20.49 |
| 6.3 ft Upstream from Splice | ||
| Maximum deflectiona (in.) | ||
| Handrail | 15.0 | N/A |
| (10.5) | ||
| Traffic rail | 14.4 | N/A |
| (10.4) | ||
| Rub rail | 9.4 | N/A |
| (6.9) | ||
| OIV (ft/s) | ||
| X | 17.7 | 40 |
| Y | 21.7 | 40 |
| Stability (deg) | ||
| Roll | 27.4 | 75 |
| Pitch | 5.4 | 75 |
| Yaw | 104.9 | — |
| Ridedown acceleration (g) | ||
| X | 6.6 | 20.49 |
| Y | 13.6 | 20.49 |
aPermanent deflection is given in parentheses.
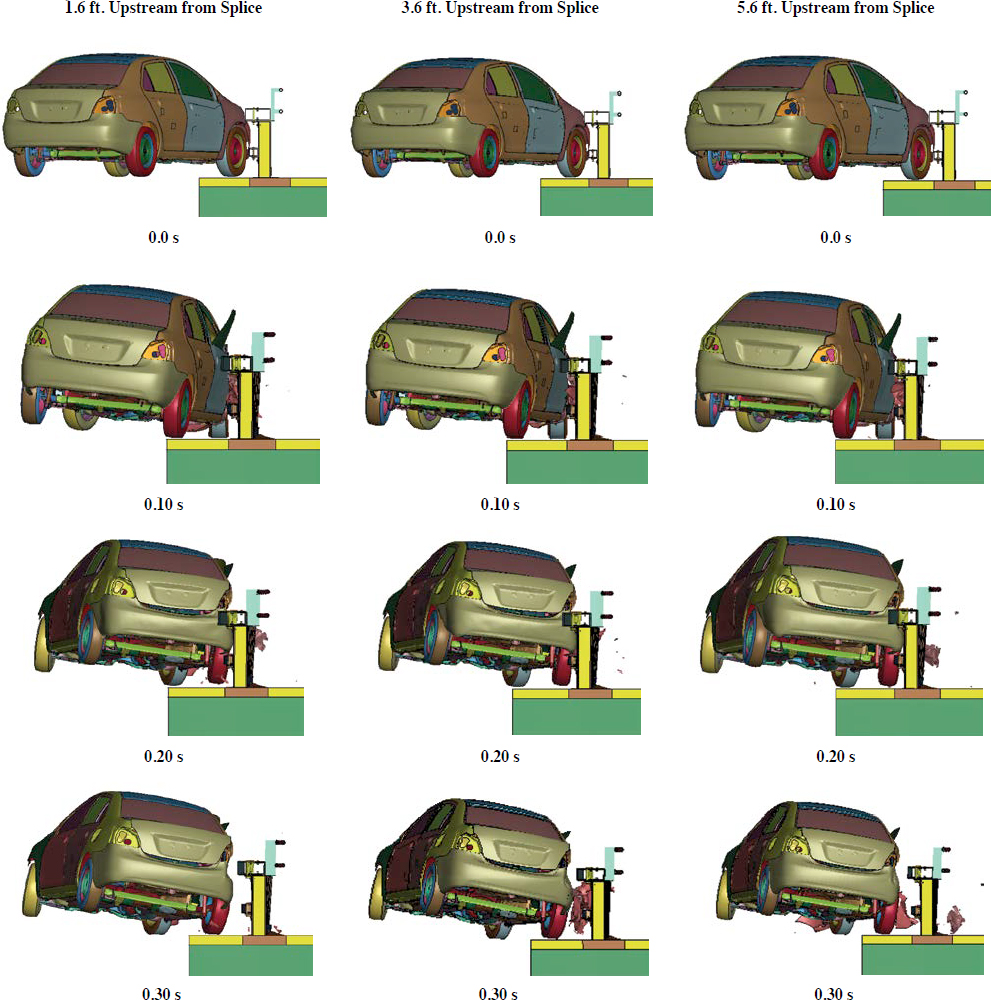
Table 44. Summary Table of MASH Test 3-10 CIP Analysis (22 in.).
| Variable | Measurement | MASH Limits |
|---|---|---|
| 1.6 ft Upstream from Splice | ||
| Deflection (in.) | ||
| Handrail | 5.32 | N/A |
| Traffic rail | 5.08 | N/A |
| Rub rail | 3.98 | N/A |
| OIV (ft/s) | ||
| X | 23.62 | 40 |
| Y | 32.15 | 40 |
| Stability (deg) | ||
| Roll | 9.9 | 75 |
| Pitch | 2.2 | 75 |
| Yaw | 39.4 | — |
| Ridedown acceleration (g) | ||
| X | 10.6 | 20.49 |
| Y | 9.6 | 20.49 |
| 3.6 ft Upstream from Splice | ||
| Deflection (in.) | ||
| Handrail | 4.84 | N/A |
| Traffic rail | 4.69 | N/A |
| Rub rail | 3.67 | N/A |
| OIV (ft/s) | ||
| X | 23.29 | 40 |
| Y | 32.15 | 40 |
| Stability (deg) | ||
| Roll | 10.7 | 75 |
| Pitch | 1.8 | 75 |
| Yaw | 38.8 | — |
| Ridedown acceleration (g) | ||
| X | 10.2 | 20.49 |
| Y | 9.5 | 20.49 |
| 5.6 ft Upstream from Splice | ||
| Deflection (in.) | ||
| Handrail | 4.53 | N/A |
| Traffic rail | 4.25 | N/A |
| Rub rail | 2.96 | N/A |
| OIV (ft/s) | ||
| X | 22.96 | 40 |
| Y | 32.15 | 40 |
| Stability (deg) | ||
| Roll | 9.3 | 75 |
| Pitch | 1.8 | 75 |
| Yaw | 36 | — |
| Ridedown acceleration (g) | ||
| X | 7.4 | 20.49 |
| Y | 9.9 | 20.49 |
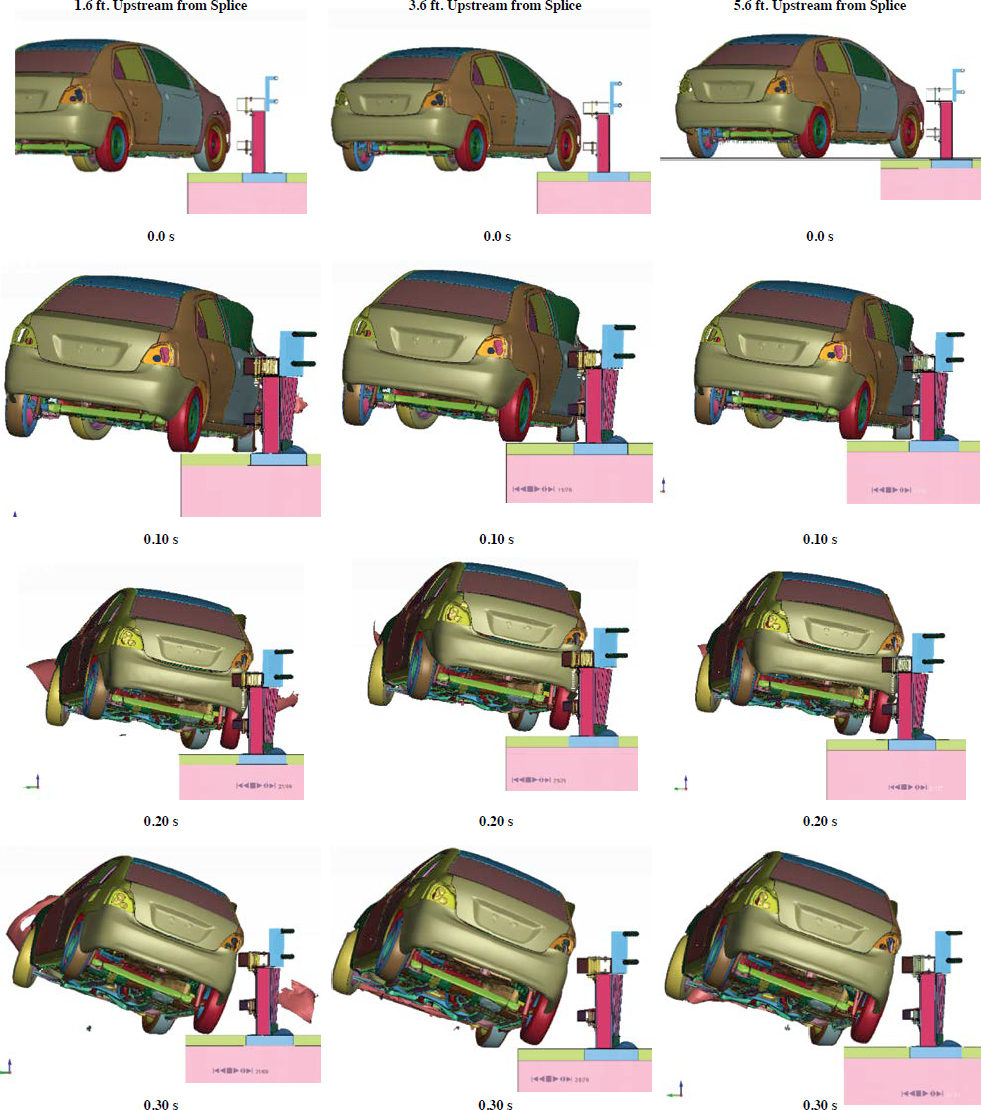
Table 45. Summary table of MASH Test 3-10 CIP analysis (44 in.).
| Variable | Measurement | MASH Limits |
|---|---|---|
| 1.6 ft Upstream from Splice | ||
| Maximum deflectiona (in.) | ||
| Handrail | 7.6 | N/A |
| (4.5) | ||
| Traffic rail | 7.2 | N/A |
| (4.3) | ||
| Rub rail | 5.2 | N/A |
| (3.0) | ||
| OIV (ft/s) | ||
| X | 19.0 | 40 |
| Y | 27.2 | 40 |
| Stability (deg) | ||
| Roll | 24.9 | 75 |
| Pitch | 2.4 | 75 |
| Yaw | 34 | — |
| Ridedown acceleration (g) | ||
| X | 6.6 | 20.49 |
| Y | 12.3 | 20.49 |
| 3.6 ft Upstream from Splice | ||
| Maximum deflectiona (in.) | ||
| Handrail | 7.0 (3.9) | N/A |
| Traffic rail | 6.7 (3.7) | N/A |
| Rub rail | 4.4 (2.5) | N/A |
| OIV (ft/s) | ||
| X | 19.0 | 40 |
| Y | 26.2 | 40 |
| Stability (deg) | ||
| Roll | 21.1 | 75 |
| Pitch | 2.4 | 75 |
| Yaw | 32.9 | — |
| Ridedown acceleration (g) | ||
| X | 5.5 | 20.49 |
| Y | 13.7 | 20.49 |
| 5.6 ft Upstream from Splice | ||
| Maximum deflectiona (in.) | ||
| Handrail | 7.8 (4.8) | N/A |
| Traffic rail | 7.6 (4.5) | N/A |
| Rub rail | 5.6 (3.4) | N/A |
| Variable | Measurement | MASH Limits |
|---|---|---|
| OIV (ft/s) | ||
| X | 20.7 | 40 |
| Y | 27.9 | 40 |
| Stability (deg) | ||
| Roll | 23.4 | 75 |
| Pitch | 1.8 | 75 |
| Yaw | 35.6 | — |
| Ridedown acceleration (g) | ||
| X | 6.2 | 20.49 |
| Y | 11.3 | 20.49 |
aPermanent deflection is given in parentheses.
MASH Test 3-11 Simulations with 66-in. Post Spacing
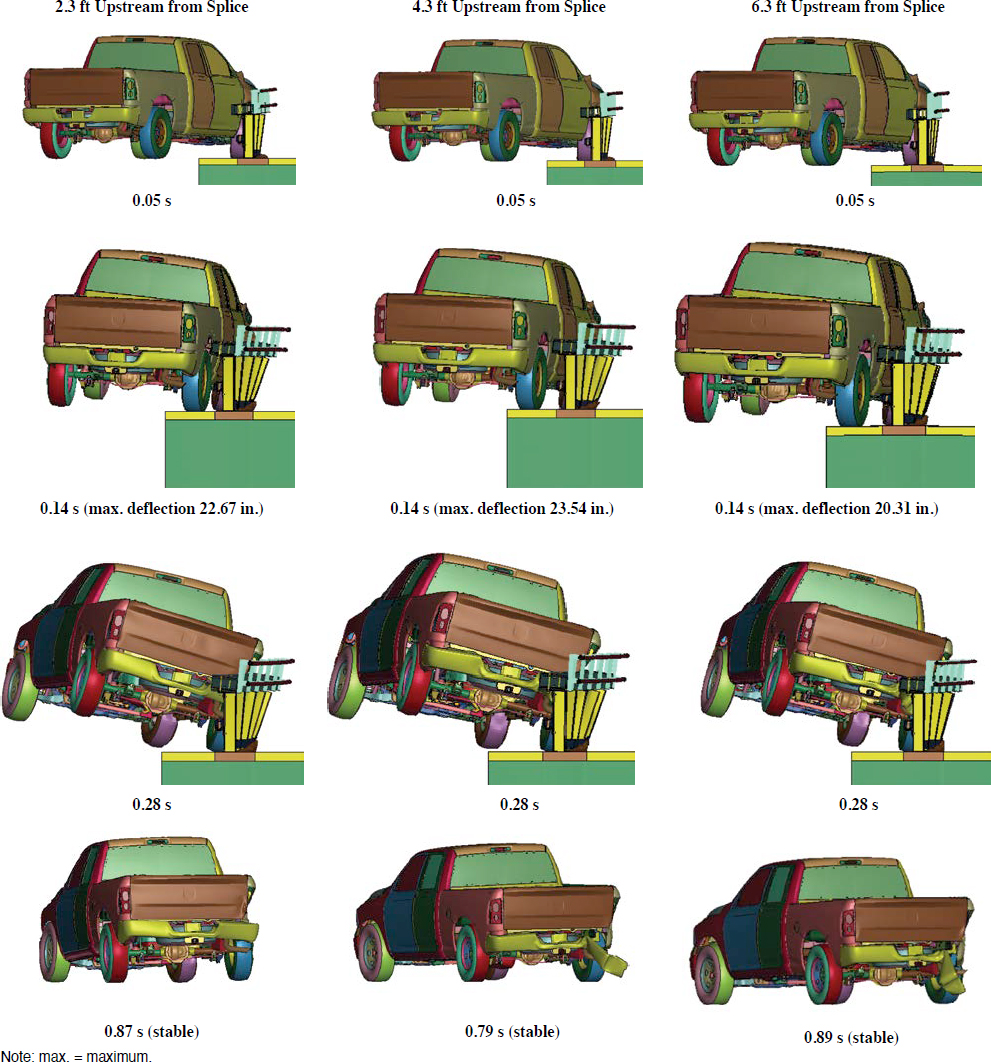
To parametrically evaluate the barrier system, simulations with different impact points were performed. Simulations with the truck impacting at 2.3 ft, 4.3 ft, and 6.3 ft upstream from the splice were performed. These impact distances were selected for the pickup in consideration of the CIP distance for rigid barriers in MASH, as previously discussed. The results are shown in Figure 70.
The postprocessing values for all three simulations indicated stable behavior of the truck, with values well within the MASH limits. The maximum dynamic deflection of 23.54 in. was obtained at the impact location of 4.3 ft upstream from the splice. This was very close to the desired deflection limit of 24 in. (2 ft) and much higher than the preferred limit of 12 in. (1 ft). The permanent deflection in the same case was 16.38 in., which again was more than the preferred limit of 12 in. (1 ft).
MASH Test 3-10 Simulations with 66-in. Post Spacing
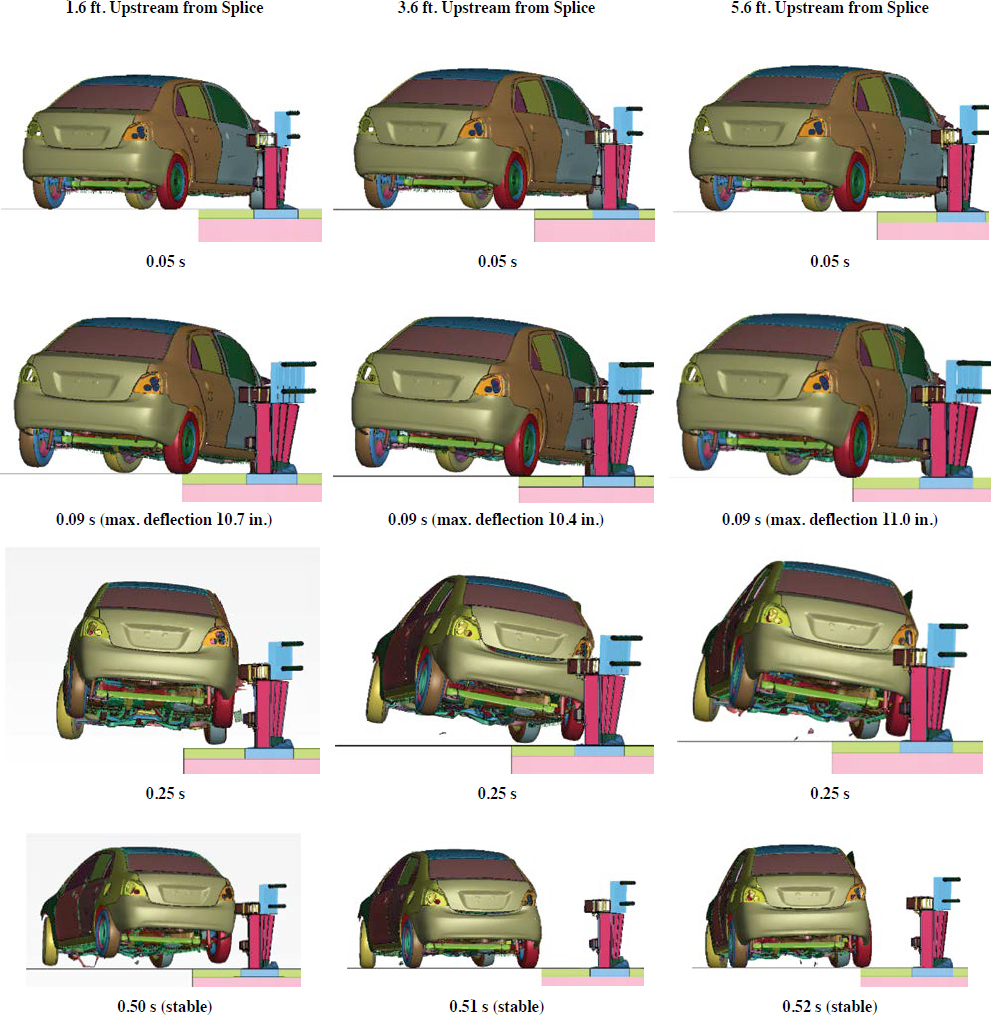
To parametrically evaluate the barrier system, simulations with different impact points were performed, as recommended by MASH (starting with recommendations from Table 2-6 in MASH). Simulations with the Toyota Yaris impacting at 1.6 ft, 3.6 ft, and 5.6 ft upstream from the splice were performed. These impact distances were selected for the passenger car in consideration of the CIP distance for rigid barriers in MASH, as previously discussed. The results are shown in Figure 71.
The postprocessing values for all three simulations indicated stable behavior of the Yaris, with values well within the MASH limits. The maximum dynamic deflection of 11.0 in. was obtained at the impact location of 5.6 ft upstream from the splice. This was less than the preferred limit of 12 in. (1 ft). The permanent deflection in the same case was 4.2 in., which was less than half of the preferred limit of 12 in. (1 ft).
Conclusions
The researchers evaluated three similar barrier design options that varied predominantly with regard to post spacing (i.e., 22 in., 44 in., and 66 in.). These three variations were proposed to obtain recommendations, if any, from the project panel regarding the system that best addressed its needs. The post spacing was increased to allow the design to be more economical from the perspective of installation, fabrication, transportation, and feasibility while still maintaining the structural ability
to contain and redirect an errant vehicle and meet the crashworthiness requirements. Closer post spacing would yield lower maximum deflection values, resulting in a more conservative design for pedestrian and bicyclist safety. The handrail design was optimized to address construction, installation, repair, and aesthetic criteria. When revising the FE predictive simulations, the researchers also gave special consideration to the maximum system deflection (including handrails) during impact, the preferred value of which was set by the project panel to be less than 24 in.
On the basis of the simulation results, the TTI researchers suggested the CIP for the car and pickup truck impacting the system for each of the proposed design options. The CIPs were suggested after the occupant risk results, deflection values, and overall stability of the vehicle in the crash test simulations were compared. Table 46 summarizes the simulation results for all the design options.
Table 46. Summary table for MASH testing of the three investigated designs.
| Design 1: Option with 22-in. Post Spacing | ||||
 | ||||
| Testing configuration | MASH Test 3-10 | MASH Test 3-11 | ||
| 2,400-lb car CIP: 3.6 ft upstream of splice | 62.2 mi/h speed 25-deg angle | 5,000-lb car CIP: 6.3 ft upstream of splice | 62.2 mi/h speed 25-deg angle | |
| Design 2: Option with 44-in. Post Spacing | ||||
 | ||||
| Testing Configuration | MASH Test 3-10 | MASH Test 3-11 | ||
| 2,400-lb car CIP: 3.6 ft upstream of splice | 62.2 mi/h speed 25-deg angle | 5,000-lb car CIP: 4.3 ft upstream of splice | 62.2 mi/h speed 25-deg angle | |
| Design 3: Option with 66-in. Post Spacing (Recommended Option) | ||||
 | ||||
| Testing Configuration | MASH Test 3-10 | MASH Test 3-11 | ||
| 2,400-lb car CIP: 5.6 ft upstream of splice | 62.2 mi/h speed 25-deg angle | 5,000-lb car CIP: 4.3 ft upstream of splice | 62.2 mi/h speed 25-deg angle | |
The researchers recommended the 66-in. post spacing option for construction and full-scale crash testing according to MASH TL-3 high-speed conditions. This proposed option maximizes the cost efficiency for system construction while maintaining all performance requirements and preferences specified by the project panel, such as lateral deflection. A three-dimensional rendering of the recommended system is provided in Figure 72.


