Review of the SBIR and STTR Programs at the National Science Foundation (2023)
Chapter: 5 The Impact of the NSF SBIR/STTR Programs: Outcomes of NSF SBIR and STTR Awardees
5
The Impact of the NSF SBIR/STTR Programs: Outcomes of NSF SBIR and STTR Awardees
Whereas the previous chapter provides descriptive evidence with respect to the landscape of SBIR/STTR awardees, this chapter focuses on the observable impact of the NSF SBIR/STTR programs on key dimensions of performance: advancing science, producing inventions, and attracting additional capital.
The chapter begins with a discussion of the challenges faced by the committee in designing an assessment approach for program outcomes. It then describes the method used by the committee to establish a counterfactual group against which to measure program outcomes. The analysis then proceeds in two distinct parts: (1) an analysis of NSF SBIR/STTR awardees to assess whether those firms are advancing science (as measured by scientific publications), stimulating technological progress (as measured by inventions or patent activity), or attracting additional capital (measured by private-sector follow-on funding) compared with similar businesses that are not funded by the programs; and (2) an analysis of the effectiveness of the NSF SBIR/STTR programs at expanding the geographic and demographic diversity of awardees compared with firms funded solely by venture capital.
ASSESSMENT CHALLENGES
In designing an approach for assessing outcomes of NSF SBIR/STTR awardees, the committee faced several interrelated challenges. First, the SBIR/STTR programs have several competing objectives that vie for priority in the design and implementation of the programs. For example, the enabling legislation for the SBIR program states that the program should advance federal agency research and development (R&D) needs, as well as increase private-sector
commercialization of innovations derived from federal funding.1 These two objectives are likely in competition with each other, even in an agency such as NSF that does not have an intramural research program.
Second, even if one focuses on a particular metric for success for the NSF SBIR/STTR programs, no systematic measurement systems are in place with which to track outcomes on an ongoing basis. For example, there is evidence for the commercial development of new products and processes from exemplar awardees, but no systematic project management database exists with which to assess the commercial impact of SBIR/STTR on a grant-by-grant basis.
Third, even if conditioned on a particular program objective and a particular outcome metric, any assessment aimed at making causal claims about the programs’ impacts must strive to approximate counterfactual outcomes—that is, what SBIR/STTR awardees would have looked like had they not received an award. In the case of the SBIR program, for example, a pioneering study of the SBIR program by Lerner (2000) documents that recipients of those awards are linked to higher levels of firm growth, with the effect being concentrated in regions with higher levels of venture capital financing; as emphasized by Wallsten (2000), however, such an analysis cannot preclude the possibility that the program is simply identifying firms with the highest potential (the so-called picking winners challenge). In the face of this methodological challenge, the committee used a suite of methodologies to provide evidence for program impacts that are “additional”—that is, associated with program participation.
Finally, the committee’s analyses of NSF SBIR/STTR awardees does not measure the full benefits of the SBIR/STTR programs because these analyses do not include measures of those activities and outcomes that go beyond the outcomes associated with individual firms. Those additional benefits are difficult to assess. Scientific publications and patents produced by NSF SBIR/STTR–awarded firms may spill over to other firms and are not captured by looking solely at awarded firms. Knowledge gained from an SBIR or STTR award can be applied to other work carried out by that firm, or a principal investigator (PI) may leave the firm and continue the research in another firm or industry. In addition, because the SBIR/STTR programs encourage partnerships with research institutions, the awards may also advance the careers of researchers within those institutions.
ASSESSING CAUSAL IMPACTS OF NSF SBIR/STTR AWARDS: ESTABLISHING A COMPARISON GROUP
The committee was asked to investigate (1) economic and noneconomic impacts of NSF’s SBIR and STTR programs, (2) the programs’ effectiveness at stimulating technological innovation, (3) the role of the programs in providing
___________________
1 As described in Chapters 1 and 2, SBIR and STTR have different, but similar, goals. Increasing private-sector commercialization of innovations derived from federal funding is a goal of both programs, although the share of work done by the research institution is larger for STTR. NSF administers the programs together.
early capital to firms, and (4) the effectiveness of the programs in selecting technologies that attract additional investment that leads to scalable commercial outcomes. One type of evidence to support this investigation would be direct production of observable innovations by NSF SBIR/STTR awardees. For example, one could examine whether SBIR/STTR awardees engaged in patenting (or even produced scientific publications), or one could examine whether awardees were involved in or led the commercialization of particular technologies, tools, or products. See Table 5-1.1 in the chapter annex for a list of NSF SBIR/STTR awarded firms whose outcomes are highlighted on its website.
In the absence of a comparison group, however, such an analysis provides only information about the outcomes linked to awards or awarded firms. As noted earlier, assessing causal impacts of awards requires a counterfactual—whether absent the SBIR/STTR awards, the associated publications or patents would not exist.
The gold standard for assessing causal impacts is randomized controlled trials, in which participants are randomly assigned to either treatment or control groups, and outcomes are compared across the two groups. When such an approach is infeasible, as is the case when studying the SBIR/STTR programs, quasi-experimental approaches are used to create comparisons that simulate randomization.
Ideally, this approach would have been implemented through a comparison of NSF SBIR/STTR awardees with program applicants who did not receive an award. Because the committee was unable to gain access to application data, however, it took a different approach to comparing awardees with similar firms that did not receive SBIR/STTR funding. The committee relied on previous work by several committee members and a consultant to the committee who compared first-time NSF SBIR/STTR Phase I awardees with a counterfactual sample of small firms seeking to transact business with the federal government (Lanahan et al., 2021).2 NSF SBIR/STTR awardees were matched with firms that won no awards based on a number of observable characteristics (firm age, size, industry, location, and credit availability).3
The set of counterfactual firms was found using the U.S. General Services Administration’s System for Award Management (SAM) and the Small Business Administration’s (SBA’s) Dynamic Small Business Search (DSBS). The DSBS is an opt-in database that SBA uses to help small businesses connect with potential customers, whereas all firms interested in receiving a grant or contract with the U.S. government, including those interested in receiving SBIR/STTR awards, must register their company in SAM. Taken together, these
___________________
2 Lanahan and colleagues (2021) used a set of SBIR/STTR awardees for NSF, the Department of Energy, Department of Defense, National Institutes of Health, and National Aeronautics and Space Administration. For the purposes of this report, the committee used only the NSF SBIR/STTR–awarded firms.
3 Although the employment statistics in the National Establishment Time-Series (NETS) database are imputed, they are highly correlated with other employment statistics. See Lanahan et al. (2021) for more information.
two databases, SAM and DSBS, contain official registration records of all corporate entities seeking to be (1) a recipient of a federal grant, (2) a contractor with the federal government, or (3) a borrower of federally guaranteed loans. Thus, the counterfactual pool identified using these databases includes all SBIR/STTR applicants, in addition to firms that did not apply. Although not all the firms in the counterfactual pool are interested specifically in the SBIR/STTR programs, they offer a constructive group for drawing baseline comparisons.
The sample of potential counterfactual firms was then matched with each of the NSF SBIR/STTR awardees in the study period based on the following characteristics: firm founding year; 3-digit NAICS4 code; Established Program to Stimulate Competitive Research (EPSCoR)5 state indicator; county-level economic cluster measure from the U.S. Economic Development Administration Cluster Map; firm-level measures of credit availability, employment, and sales from the National Establishment Time-Series (NETS) database; total disbursement of federal contracts from USASpending; and patent activity from PatentsView.6
From the Lanahan et al. (2021) dataset of all SBIR/STTR-awarded firms and matched controls, the committee analyzed a set of 901 first-time NSF SBIR/STTR awardees and 901 matched firms that did not receive SBIR/STTR awards from any agency. Because of issues with creating the matched set, the set of awarded firms was restricted to the 2000–2015 period.
While the committee made every effort to ensure the similarity of the counterfactual sample and the set of awardees, there are likely to be unobservable variables that differentiate the two groups. Therefore, it is difficult to determine to what extent the impact of receiving an NSF SBIR or STTR award is due to a selection effect (NSF’s ability to select the best applicants), the certification effect of being recognized as an NSF SBIR or STTR awardee, or the financial effect of the money associated with an award.
INNOVATION AND COMMERCIALIZATION OUTCOMES
Comparing NSF SBIR/STTR–awarded firms with the matched group described above shows that the NSF SBIR/STTR programs play an important role in the U.S. innovation ecosystem. As detailed below, the committee found that NSF SBIR/STTR awardees have contributed scientific publications and patents and realized financial and commercial outcomes that are consistent with the programs’ goal of encouraging small businesses to engage in federal R&D with an aim toward commercialization.
___________________
4 The North American Industry Classification System (NAICS) is an industry classification system used for collecting, analyzing, and publishing statistical data related to the U.S. business economy. The 3-digit code includes 20 industry sectors, which are further divided into 102 industry subsectors (https://www.census.gov/naics). The NETS database provided industry classification information.
5 https://beta.nsf.gov/funding/initiatives/epscor.
6 More information on the matching process can be found in Lanahan et al. (2021).
Publications
In its analysis of publications, the committee found no difference between the NSF SBIR/STTR–awarded firms before they received their first Phase I award and the firms that did not receive an SBIR/STTR award (Table 5-1). Over time, however, awarded firms were more than three times as likely to publish compared with the control group, and overall published five times as many papers. Moreover, there are no distinguishable quality differences between publications of the awarded firms and those of the control group (Table 5-1, Panel B).
Inventions
The committee next investigated whether the production of inventions differed between NSF SBIR/STTR–awarded firms and the control group. The NSF SBIR/STTR–awarded firms in the sample had patented more than had the control group prior to award (Table 5-2, Panel A). They were more than three times as likely to patent compared with the control group prior to award. However, after receiving an award (or in the same year as they received their NSF Phase I award), awarded firms were nearly eight times as likely to patent compared with the matched control firms and had produced nearly five times as many patents. As with publications, there were no discernable differences in patent quality between the awarded firms and the control group (Table 5-2, Panel B).
TABLE 5-1 SBIR/STTR Awardees and Control Group: Differences in Advancing Science
| Panel A: Full Sample | ||||
|---|---|---|---|---|
| N | SBIR/STTR–Awarded Firms | Control Group Firms | p < | |
|
Published preaward |
1,802 | 0.010 | 0.010 | 1.0000 |
|
Ever published a paper* |
1,802 | 0.082 | 0.024 | 0.0000 |
|
Number of papers published* |
1,802 | 0.220 | 0.046 | 0.0001 |
| Panel B: Conditional on Publishing | ||||
| N | SBIR/STTR–Awarded Firms | Control Group Firms | p < | |
|
Number of cites from papers |
96 | 11.065 | 8.922 | 0.6526 |
|
Number of cites from patents |
96 | 0.203 | 0.091 | 0.5952 |
|
Pct. of cites from patents |
83 | 0.013 | 0.020 | 0.6630 |
NOTE: (*) indicates that the difference between the awarded firms and control group is statistically significant.
SOURCE: Committee calculations based on the set of treated and control firms in Lanahan et al. (2021); publication data from the Web of Science database.
TABLE 5-2 Differences in Patenting between NSF SBIR/STTR Awardees and the Control Group
| Panel A: Full Sample | ||||
|---|---|---|---|---|
| N | SBIR/STTR–Awarded Firms | Control Group Firms | p < | |
|
Patented preaward* |
1,801 | 0.033 | 0.009 | 0.0003 |
|
Patented at/after* |
1,801 | 0.256 | 0.033 | 0.0000 |
|
Number of patents (preaward) |
1,801 | 0.151 | 0.010 | 0.1387 |
|
Number of patents (at/after)* |
1,801 | 1.346 | 0.283 | 0.0000 |
| Panel B: Conditional on Patenting | ||||
|
N |
SBIR/STTR–Awarded Firms | Control Group Firms | p < | |
|
Avg. fwd. cites |
299 | 0.335 | 0.427 | 0.1442 |
|
Avg. fwd. cites (preaward) |
38 | 0.064 | 0.188 | 0.2177 |
|
Avg. fwd. cites (at/after) |
287 | 0.335 | 0.384 | 0.4570 |
|
Avg. scirefs* |
299 | 12.718 | 3.602 | 0.0294 |
|
Avg. preaward scirefs |
32 | 5.849 | 0.764 | 0.4084 |
|
Avg. postaward scirefs |
221 | 16.981 | 6.990 | 0.1157 |
NOTE: (*) indicates statistically significant differences between awarded firms and the control group.
SOURCE: Committee calculations based on the set of treated and control firms in Lanahan et al. (2021); patent data from PatentsView.
Follow-on Funding
The committee turned to whether the NSF SBIR/STTR programs select technologies that attract private-sector follow-on funding, are acquired, or complete an initial public offering relative to similar firms that do not receive SBIR/STTR funding. NSF SBIR/STTR–funded firms were more than five times as likely to attract angel investments or venture capital and more than three times as likely to complete an initial public offering or be acquired compared with the control group (Table 5-3, Panel A). Additionally, conditional on raising follow-on funding, the awarded firms raised less than a seventh as much money in the preaward period compared with similar firms (Table 5-3, Panel B), providing evidence that the NSF SBIR/STTR programs are providing early capital to firms that lack significant sources of support. While the calculated average follow-on investment raised by the control group was much larger than that of the awarded firms after the award, the difference between the two groups was not found to be statistically significant.
Considering only the average (mean) amount of follow-on funding does not provide a full picture of the distribution of follow-on funding. There may be outliers, with a few firms raising significant amounts of funding. To determine whether this is the case, the committee took a closer look at the distribution of postaward funding. Of the 901 NSF SBIR/STTR–awarded firms in the original
analysis, 144 attracted follow-on funding, whereas only 26 of the matched control firms attracted venture capital funding. The median amount raised by the control group was much larger than the median raised by the awarded firms (Table 5-4), pointing to significant outliers in funding from the control group, but the fact that a larger proportion of awardee firms received follow-on funding is notable.
Failure Rates
Although Table 5-3 does not show a statistically significant difference in failure rates between NSF SBIR/STTR awardees and the control firms, the
| Panel A: Full Sample | ||||
|---|---|---|---|---|
| N | SBIR/STTR–Awarded Firms | Control Group Firms | p < | |
|
Venture capital/angel funding* |
1,802 | 0.160 | 0.029 | 0.0000 |
|
Initial public offering (IPO)/acquired* |
1,802 | 0.014 | 0.004 | 0.0283 |
| Panel B: Conditional on Attracting Additional Capital | ||||
|
N |
SBIR/STTR–Awarded Firms | Control Group Firms | p < | |
|
$ million raised preaward* |
170 | 0.064 | 0.469 | 0.0084 |
|
$ million raised at/after award |
170 | 14.361 | 23.357 | 0.3304 |
|
IPO/acquired |
170 | 0.090 | 0.154 | 0.3229 |
|
Failed |
170 | 0.188 | 0.077 | 0.1697 |
NOTE: (*) indicates that the difference between the awarded firms and control group is statistically significant.
SOURCE: Committee calculations based on the set of treated and control firms in Lanahan et al. (2021); funding and IPO/acquisition information from PitchBook.
TABLE 5-4 Distribution of Venture Capital Funding for NSF SBIR/STTR Awardees and the Control Group
| Amount of Follow-on Funding | Percentage of NSF Awardees (%) | Percentage of Control Group Firms (%) |
|---|---|---|
| Less than $250,000 | 19 | 23 |
| $250,000–500,000 | 6 | 4 |
| $500,000 to $1 million | 8 | 4 |
| $1–5 million | 27 | 15 |
| $5–20 million | 23 | 23 |
| More than $20 million | 17 | 31 |
| Number of firms | 144 | 26 |
SOURCE: Committee calculations based on the set of treated and control firms in Lanahan et al. (2021); funding information from PitchBook.
committee investigated whether this would be the case if one controlled for other observable differences between the firms, including where they are located, the time period, and the industry. After controlling for those observable variables, the committee found that failure rates for NSF SBIR/STTR awardees were statistically higher than those of the control group (Table 5-5). A higher failure rate for NSF SBIR/STTR awardees may indicate that NSF is selecting applicants whose innovations are higher risk and higher reward, while a lower failure rate may indicate that NSF is selecting awardees that would have succeeded even in the absence of the programs.
NSF’S SBIR/STTR PROGRAMS AND DIVERSITY
Next, the committee compared the set of NSF SBIR/STTR awardees that appear in Pitchbook with the universe of firms that are funded by venture capital to determine whether the programs diversify the set of awardees by either expanding the industry sectors that are funded; broadening the racial, ethnic, or gender diversity of funded firms; or expanding the geographic distribution of funding relative to venture funding alone.7
Diversity of Funded Sectors
First, as Figure 5-1 shows, venture capital funding is concentrated in software (representing about 30 percent of firms that received venture capital from 1983 to 2019) and services (an additional 13 percent). While software is still the most common technology funded by the NSF SBIR/STTR programs for firms that are in PitchBook, the NSF SBIR/STTR awardees are more likely to be in other areas, such as pharmaceuticals and biotech, health care devices and supplies, commercial products, computer hardware, and semiconductors, compared with the universe of venture capital–funded firms.
Racial, Ethnic, and Gender Diversity of Firm Founders
The committee then examined the racial, ethnic, and gender diversity of founders of SBIR/STTR-funded companies compared with companies funded by venture capital.8 Numerous studies have found evidence of a gender gap in
___________________
7 The set of NSF SBIR/STTR–awarded firms (through mid-2020) was found by matching the firm names with PitchBook firms. The committee used fuzzy match against the Pitchbook company names using Julio Raffo’s “matchit” program and a 90 percent confidence threshold (Raffo, 2020).
8 The committee used the gender flag from PitchBook for its analysis of women entrepreneurs. For race and ethnicity, the committee used all U.S.-based ventures tracked by Pitchbook from 2000 to 2022 for which at least one firm founder’s LinkedIn profile could be located. Founder race and ethnicity was determined by a combination of skintone-classification algorithms, forename- and surname-classification algorithms, and manual review of LinkedIn profiles. For more detail, see Cook et al. (2022).
TABLE 5-5 Progress toward Liquidity Events
| Full Sample | Conditional on Raising $ | ||||
|---|---|---|---|---|---|
| (1) Initial Public Offering (IPO)/Acquired |
(2) Millions Raised Preaward |
(3) Millions Raised at/after |
(4) IPO/Acquired |
(5) Failed |
|
|
SBIR/STTR recipient |
−0.064 (0.075) | −0.432∗∗∗ (0.158) | −12.985 (10.729) | −0.061 (0.077) | 0.184∗∗ (0.092) |
| Constant | 0.157∗∗ (0.069) | 0.498∗∗∗ (0.144) | 26.667∗∗∗ (9.779) | 0.157∗∗ (0.070) | 0.023 (0.084) |
| Observations | 166 | 166 | 166 | 162 | 162 |
| R2 | 0.225 | 0.412 | 0.236 | 0.225 | 0.285 |
|
Award-year fixed effects (FE) |
yes | yes | yes | yes | yes |
|
Industry FE |
yes | yes | yes | yes | yes |
|
State FE |
yes | yes | yes | yes | yes |
NOTE: ∗ p <0.10, ∗∗ p <0.05, ∗∗∗ p <0.01.
SOURCE: Committee calculations based on the set of treated and control firms in Lanahan et al. (2021); funding and IPO/acquisition information from PitchBook.

SOURCE: Committee calculations based on NSF SBIR/STTR Awards data from SBIR.gov and Venture Capital Funding data from PitchBook.
entrepreneurship, especially among high-risk, high-return, venture-backed startups (Ewens and Townsend, 2020; Guzman and Kacperczyk, 2019; Kanze et al., 2020; Marx, 2022). There is also evidence of a gap in venture funding for minorities (Cook et al., 2022; Younkin and Kuppuswamy, 2017). Consistent with the committee’s findings in Chapter 4, there is evidence that NSF SBIR/STTR program awards increase early-stage funding for women entrepreneurs (Figure 5-2).9 There is also some evidence that NSF SBIR/STTR–funded firms are more likely to have Black or African American founders compared with firms funded
___________________
9 While the share of woman-owned firms supported by venture funding is thought to be low, it is nearly in line with statistics on the share of woman-owned small businesses from the Annual Business Survey, which shows that 22.9 percent of businesses with 2-digit NAICS codes of 31, 32, 33, and 54 are owned by women. Those NAICS codes (associated with various manufacturing sectors and professional, scientific, and technical services) represent the bulk of NSF SBIR/STTR awardees’ industry sectors (calculated from Census Bureau, Annual Business Survey: Employment Size of Firm Statistics for Employer Firms by Sector, Sex, Ethnicity, Race, and Veteran Status for the U.S., States, and Metro Areas: 2020).
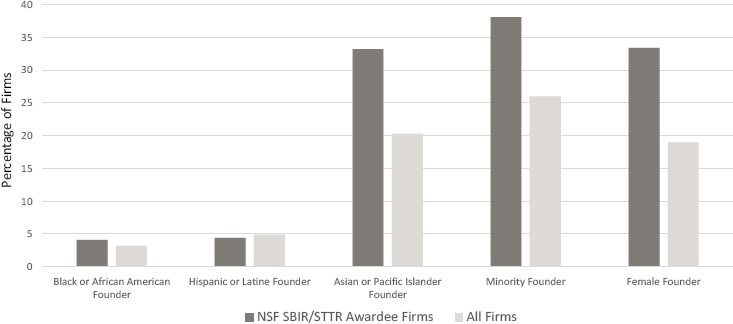
NOTE: Minority founders are those who are either Black or African American, Hispanic or Latine, or Asian or Pacific Islander, although some founders are included in multiple categories.
SOURCE: Based on NSF SBIR/STTR Awards data from U.S. Small Business Administration, SBIR/STTR Awards database (SBIR.gov), and Venture Capital Funding data from PitchBook.
by venture capital alone (Figure 5-2).10 However, more Latine- or Hispanic-founded firms are backed by venture capital alone than have received NSF SBIR/STTR awards (Figure 5-2).
Geographic Diversity
The committee also looked to see whether the NSF SBIR/STTR programs diversify early-stage seed funding geographically. It is well documented in the literature that venture capital is geographically concentrated in California and that venture capitalists are reluctant to support distant firms (Bernstein et al., 2016; Sørensen and Stuart, 2001), and that valuable discoveries in some parts of the United States may go uncommercialized for lack of local capital (Clayton et al., 2018; Samila and Sørensen, 2010). As shown in Figure 5-3, while half of all
___________________
10 Similarly, the share of Black- or African American–owned small businesses from the Annual Business Survey with the NAICS codes 31, 32, 33, and 54 is 2.0 percent; the share of Latine or Hispanic-owned small businesses is 4.9 percent; and the share of Asian American–owned small businesses is 7.4 percent.

SOURCE: Committee calculations based on U.S. Small Business Administration, SBIR/STTR Awards database (SBIR.gov), and Pitchbook.
venture capital deals go to firms in California (Panel A), companies in states such as Michigan, Ohio, and Wisconsin, which receive few venture deals, receive a larger share of NSF SBIR/STTR–funded awards (Panel B). Thus, the NSF SBIR/STTR programs do help diversify the geographic reach of venture funding.
CONCLUSION
NSF SBIR/STTR awardees have contributed scientific publications and patents and have realized financial and commercial outcomes that are consistent with the programs’ legislative goals. The programs also have helped support small, new firms across a wider technological spectrum than is supported by venture capital, while helping to diversify the geographic reach of seed funding. NSF’s SBIR and STTR programs provide initial funding for states that receive little venture funding, such as Michigan, Wisconsin, and Indiana.
NSF’s SBIR/STTR programs are more likely than the venture capital community overall to fund small businesses founded by women and African Americans. Latine- or Hispanic-owned small businesses are still underrepresented among NSF SBIR/STTR awardees compared with the greater venture capital community.
To make determinations about the impacts of the NSF SBIR/STTR programs through its analyses, the committee relied on matching NSF SBIR/STTR–awarded firms with a similar set of firms demonstrating interest in receiving grants, contracts, or loans from the federal government but not receiving SBIR/STTR awards; however, the committee was constrained in its ability to establish such a comparison group. While the committee made every effort to provide a matched comparison group for the set of awardees, there are likely to be unobservable variables that could explain the differences in outcomes between the two groups, making it difficult to determine to what extent the impact of receiving an NSF SBIR or STTR award is due to a selection effect (NSF’s ability to select the best applicants), the certification effect of being recognized as an NSF SBIR or STTR awardee, or the financial effect of the money associated with an award.
The committee’s analyses would have been enhanced by access to information on all NSF SBIR/STTR program applicants, not just the awarded firms. In the 2011 reauthorization of the programs, Congress required that agencies file information on applicants with SBA to enable analyses such as that carried out by this committee, but NSF has not complied with that mandate. A more fulsome picture of the demographics of applicants would also be accomplished by requiring that demographic information on principal investigators be collected in SAM.
Finally, although this chapter and Chapter 4 present evidence that NSF has made progress toward improving the gender and racial diversity of its awardees, the committee did not have access to information that would make it possible to determine whether changes in NSF’s processes and procedures are responsible for any improvements. Establishing systematic data collection, data
access, and preregistered evaluation approaches would allow a comprehensive assessment of NSF’s SBIR/STTR processes and procedures. To reduce the burden on awardees, NSF could use administrative data collected by other agencies, such as information on patenting by awardees included in the government interest statements in U.S. Patent and Trademark Office filings and demographic information on applicants in SAM.
FINDINGS AND RECOMMENDATIONS
Finding 5-1: The NSF SBIR/STTR programs continue to play an important role in the U.S. innovation ecosystem. Notably, NSF SBIR/STTR awardees contribute scientific publications and patents and realize financial and commercial outcomes that are consistent with the programs’ goal of encouraging small businesses to engage in federal research and development with the aim of commercialization.
Finding 5-2: After receiving an NSF SBIR/STTR award, an awardee is more likely to advance science through published papers than is a similar business that does not receive an award. Over time, an NSF SBIR/STTR awardee is three times as likely to publish as a nonawardee. Prior to their receiving an award, publication rates for awardees were not statistically different from those for nonawardees.
Finding 5-3: NSF’s SBIR/STTR programs are effective at stimulating technological innovation. Although an NSF SBIR/STTR awardee is more likely than a similar small-business nonawardee to have produced patented inventions prior to receiving an award, it is eight times more likely to patent after receiving an award.
Finding 5-4: While software is still the most common industry sector represented by NSF’s SBIR/STTR awardees, the sectoral distribution of awardees is more diverse than that of firms supported by venture capital. NSF SBIR/STTR awardees that receive private-sector follow-on funding are more likely to be in pharmaceuticals, medical devices, semiconductors, chemicals, and other capital-intensive technologies than are firms funded by venture capital, which focuses on software and commercial services.
Finding 5-5: NSF’s SBIR/STTR programs fund start-ups in states where such firms receive little venture capital.
Finding 5-6: NSF’s SBIR/STTR programs are more likely to fund woman-owned and African American– or Black-owned small businesses than is the venture capital community. Latine- or Hispanic-
owned small businesses are still underrepresented as NSF SBIR/STTR awardees compared with the greater venture capital community.
Finding 5-7: The NSF SBIR/STTR programs provide early capital to firms without other significant sources of funding.
Finding 5-8: NSF’s SBIR/STTR programs are effective at selecting technologies that attract additional capital after an award has been received. After receiving an NSF SBIR/STTR award, an awardee firm versus a similar nonawardee firm is more likely to attract private-sector follow-on funding, to be acquired, or to complete an initial public offering. However, compared with a similar firm that attracts private investment instead of receiving an NSF SBIR/STTR award, an NSF SBIR/STTR–funded firm is more likely to fail.
Finding 5-9: NSF has not yet established systematic approaches to data collection, data access, and preregistered evaluation that would allow a comprehensive assessment of its SBIR/STTR processes and procedures.
Finding 5-10: NSF has made a number of programmatic changes to its SBIR/STTR programs, but it is difficult to determine which of these changes have been effective at increasing the number of awards to woman- or minority-owned businesses.
Recommendation 5-1: Congress should continue to support NSF’s SBIR/STTR programs, including by providing additional resources to enable innovation and new initiatives within the programs.
Recommendation 5-2: NSF should establish systematic approaches for data collection, data access, and preregistered evaluation that would allow a comprehensive assessment of its SBIR/STTR processes and procedures. The data collected should include scientific, technical, and financial outcomes of awardees for 10 years following the end of an award. Data on firms that applied for but did not receive SBIR/STTR awards would provide a meaningful comparison group, and NSF should provide this information to the Small Business Administration as is legally required.
ANNEX 5-1:
ADDITIONAL TABLE
TABLE 5-1.1 Patents, Publications, and Commercial Products of Awardees on the NSF Showcase Website
| Company Name | Commercialized Product | SBIR/STTR Award Years | Total Number of NSF SBIR/STTR Awards | Other SBIR/STTR Awards | Total NSF SBIR/STTR Award Amount | Number of Employees | Total Funding Including SBIR/STTR | Location | Number of Granted U.S. Patents | Number of Publications |
|---|---|---|---|---|---|---|---|---|---|---|
| Azitra | topical drug delivery system using reengineered skin bacteria | 2016–2019 | 2 (STTR Phase I; SBIR Phase II) | 2 Phase I awards from NIH | $944,727 | 11–50 | $37.8 million | Farmington, CT | 2 | 5 |
| ClearFlame Engine Technologies | technology that allows diesel engines to run on any fuel | 2017–2020 | 2 (SBIR Phase I & II) | 1 SBIR Phase I from USDA; SBIR Phase I & II from DOE | $972,192 | 11–50 | $21.1 million | Woodridge, IL | 4 | 1 |
| Squishy Robotics | shape-shifting, squishy, mobile sensor robots that provide real-time data in disasters | 2018–2019 | 2 (SBIR Phase I & II) | 1 SBIR Phase I from DoD - Army | $958,898 | 1–10 | $1.2 million | Berkeley, CA | 0 | 1 |
| Muzology | web-based, gamified learning platform using music to boost learning outcomes | 2018–2021 | 2 (SBIR Phase I & II) | SBIR Phase I & II from ED | $926,399 | 1–10 | $1.3 million | Nashville, TN | 0 | 0 |
| re:3D | large-scale, industrial 3D printers that can print from locally sourced plastic waste | 2018–2021 | 2 (SBIR Phase I & II) | 3 SBIR Phase I awards & 1 SBIR Phase II from DoD; 1 STTR Phase I from NASA | $969,660 | 11–50 | $1.7 million | Houston, TX | 0 | 4 |
| KelaHealth | adaptive machine learning–based platform to improve surgical quality and patient outcomes by predicting “tailored risk profiles” for each patient before surgery | 2017–2019 | 2 (STTR Phase I; SBIR Phase II) | no | $918,899 | 11–50 | $5.6 million | Durham, NC | 0 | 1 |
| Twelve Benefit Corporation (a.k.a. Opus 12 Inc.) | device that recycles waste carbon dioxide into chemicals and fuels | 2016–2022 | 2 (SBIR Phase I & II) | 9 Phase I & 7 Phase II awards from DOE; 2 Phase I & 2 Phase II awards from DoD; 1 Phase I & 1 Phase II award from NASA | 101–250 | $199.4 million | Berkeley, CA | 3 | 11 |
| Company Name | Commercialized Product | SBIR/STTR Award Years | Total Number of NSF SBIR/STTR Awards | Other SBIR/STTR Awards | Total NSF SBIR/STTR Award Amount | Number of Employees | Total Funding Including SBIR/STTR | Location | Number of Granted U.S. Patents | Number of Publications |
|---|---|---|---|---|---|---|---|---|---|---|
| Kinetic (a.k.a. One Million Metrics Corp.) | small, wearable device that uses sensors to reduce common workplace injuries | 2016–2020 | 3 (2 SBIR Phase I awards & 1 SBIR Phase II) | none | $1,155,993 | 11–50 | $19.4 million | New York, NY | 3 | 0 |
| Beta Hatch | technology to mass-produce insects as an alternative protein to feed animals | 2017–2021 | 2 (SBIR Phase I & II) | 2 SBIR Phase I awards & 1 Phase II from DoD; SBIR Phase I from USDA; 1 SBIR Phase I from HHS (CDC) | $855,632 | 11–50 | $42 million | Cashmere, WA | 1 | 7 |
| Vital (a.k.a. JLB Innovations, Inc.) | touchscreen-based software that translates visual educational content into accessible, multisensory content for students with special needs | 2016–2017 | 2 (SBIR Phase I & II) | none | $892,147 | 1–10 | $50 million | St Louis, MO | 0 | 0 |
| Path Ex | device to remove pathogens from blood and treat drug-resistant bacteria and endotoxins from circulating blood | 2017–2018 | 2 (STTR Phase I; SBIR Phase II) | none | $975,000 | 1–10 | $4.8 million | Nashville, TN | 0 | 0 |
| Spherical Block | using concrete masonry construction to build affordable, efficient homes—the manufactured concrete blocks can even be used to build arches (including roofs) | 2016–2017 | 2 (SBIR Phase I & II) | none | $868,778 | N/A (not reported on Crunchbase) | $1 million | Alfred Station, NY | 4 | 0 |
| Dimensional Energy | created a Hi-Light Reactor that uses sunlight to convert carbon dioxide into energy | 2017–2020 | 2 (STTR Phase I & II) | 1 SBIR Phase I from DOE) | $959,607 | 11–50 | $9 million | Ithaca, NY | 0 | 0 |
| Embr Labs | developed a wearable device that uses a battery-powered, thermal-electric cooler to moderate temperature control | 2016–2022 | 2 (STTR Phase I & II) | SBIR Phase I & II from DoD | $974,252 | 11–50 | $15.2 million | Boston, MA | 6 | 2 |
| Company Name | Commercialized Product | SBIR/STTR Award Years | Total Number of NSF SBIR/STTR Awards | Other SBIR/STTR Awards | Total NSF SBIR/STTR Award Amount | Number of Employees | Total Funding Including SBIR/STTR | Location | Number of Granted U.S. Patents | Number of Publications |
|---|---|---|---|---|---|---|---|---|---|---|
| OESH Shoes (a.k.a. JKM Technologies) | developing 3D printers to create shoes that minimize impact and are healthy by design (using recyclable materials) | 2015–2017 | 3 (STTR Phase I, SBIR Phase I & II) | none | $949,999 | 1–10 | $1 million | Charlottesville, VA | 5 | 2 |
| Diligent Robotics (a.k.a. Diligent Droids) | created “Moxi,” a robot that executes logistical tasks in acute care hospitals so clinical staff teams can focus on direct human care | 2016–2017 | 2 (SBIR Phase I & II) | none | $724,646 | 51–100 | $46.6 million | Austin, TX | 2 | 1 |
NOTES: Publication and patents prior to first SBIR/STTR award are not included. CDC = Centers for Disease Control and Prevention; DoD = Department of Defense; DOE = Department of Energy; ED = Department of Education; HHS = Department of Health and Human Services; NASA = National Aeronautics and Space Administration; NIH = National Institutes of Health; USDA = U.S. Department of Agriculture.
SOURCE: NSF SBIR Showcase (https://seedfund.nsf.gov/showcase/); SBA SBIR database; National Establishment Time-Series database; Crunchbase; PatentsView; U.S. Patent and Trademark Office; Scopus.


