Review of the SBIR and STTR Programs at the National Science Foundation (2023)
Chapter: 4 The Landscape of NSF SBIR/STTR Awardees
4
The Landscape of NSF SBIR/STTR Awardees
This chapter focuses on the landscape of NSF SBIR and STTR awardees. The aim is to provide descriptive data regarding the characteristics and geographic locations of firms that win NSF SBIR/STTR awards, with a particular focus on characteristics relating to the programs’ aim of improving outreach to small businesses that are (1) woman-owned, (2) minority-owned, (3) new to the programs, or (4) from underrepresented states. The chapter also provides information on collaborations between NSF STTR awardees and their research partners. Finally, the chapter looks at Innovation Corps (I-Corps) participants who subsequently win NSF SBIR/STTR awards to provide more evidence about the changing profiles of woman- and minority-owned SBIR/STTR awardees.
In carrying out its work, the committee analyzed information on SBIR and STTR awardees that is available on the Small Business Administration’s (SBA’s) SBIR/STTR website (SBIR.gov), as well as information from the NSF award archive (https://nsf.gov/awardsearch/). Demographic information on awardees was verified with information provided in the System for Award Management (SAM), accessed through the USA Spending database, whose database management system contains a subsample of demographic information entered in SAM for contract, grant, and loan awardees for the federal government since 2001. The committee did not have access to information on applicants to the program, so its analysis of applicants is limited and based only on summary statistics provided by NSF to SBA (published in SBA’s SBIR/STTR Annual Reports).
DEMOGRAPHIC DISTRIBUTION
As called for in the project’s statement of task (Box 1-1 in Chapter 1), the committee characterized and assessed “demographics of the applicant (and award) pool and their changes over time, including such characteristics as size, age of applicants (and awards) in the pool, and participation by underrepresented
groups.” The committee found that while the share of applications from woman-owned small businesses rose only slightly in the past 10 years, the share of awards going to such firms rose sharply, especially for Phase II awards. Consistent with previous National Academies assessments of NSF’s SBIR and STTR programs, this committee found low levels of SBIR and STTR awards among African American– or Black-owned, Latine- or Hispanic-owned, or American Indian–owned small businesses, although the shares of awards made to these groups have risen since 2012. For Asian Americans, award rates were generally higher than for other minority groups, but remained disproportionately low compared with Asian American representation in the U.S. science and engineering workforce (NCSES, 2021). Additionally, the share of awards going to Asian Americans declined over the past 10 years.
Woman-Owned Small Businesses
As noted above, although the share of Phase I applications from small businesses owned by women did not increase substantially in the past 10 years, the share of awards going to woman-owned small businesses improved over the period, with particularly striking results in the share of Phase II awards going to woman-owned small businesses.
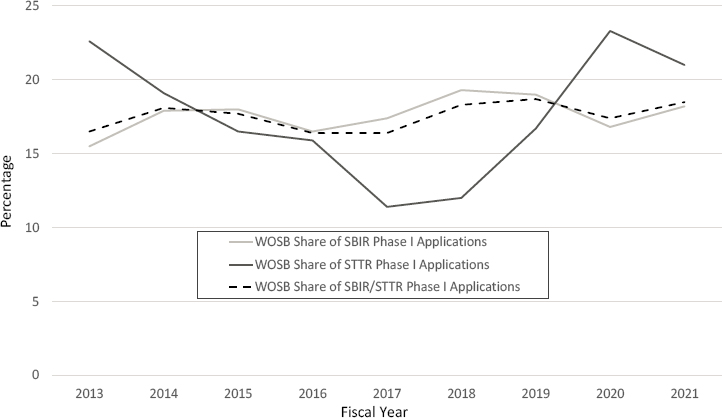
Focusing in further detail on the Phase I application rates, the share of STTR applications from woman-owned small businesses was slightly higher in recent years compared with their share of SBIR applications (see Figure 4-1). At the same time, because the number of STTR applications from woman-owned small businesses was small (ranging from 43 to 83 during the fiscal year [FY] 2013–2021 period),1 it is difficult to determine any trends in application over that period. Overall, the combined share of SBIR/STTR Phase I applications from woman-owned small businesses shows little change over the 2014–2021 time period.
Turning to the share of SBIR/STTR awards to woman-owned small businesses, that share for Phase I awards doubled from about 10 percent in 2011 to more than 20 percent in 2021 (see Figure 4-2), while the share for Phase II awards to woman-owned small businesses has tripled from nearly 7 percent in 2011 to 26 percent in 2021.2
Because the committee did not have access to information about the applicants who did not receive NSF SBIR/STTR awards, it is difficult to determine the root causes of the increased shares of awards for woman-owned small businesses. However, the lack of a corresponding increase in the share of
___________________
1 Data on applications from woman-owned small businesses are not available prior to FY2013.
2 These shares differ from those reported in the 2020 report Women’s Inclusion in Small Business Innovation Research & Small Business Technology Transfer Programs (Dawnbreaker, Inc., 2020), where gender is determined by self-reporting in the SBIR.gov database. The committee used the SAM designation of gender (as well as race and ethnicity) in its analysis.
NOTE: Data on applications from woman-owned small businesses are not available prior to fiscal year (FY) 2013.
SOURCE: U.S. Small Business Administration, SBIR/STTR Annual Reports FY2013–2021 (SBIR.gov).
applications from such firms suggests that other NSF programs, such as the I-Corps program (statistics surrounding which are discussed later in this chapter) may be responsible for the increased success of those applicants.
Minority-Owned Small Businesses
As discussed earlier, because the committee did not have access to applicant information, it relied on SBA’s SBIR/STTR Annual Reports for any available information on the race and ethnicity of small-business owners applying to NSF’s SBIR and STTR programs. However, the agencies are required to report to SBA only whether the owners of firms applying for SBIR/STTR awards are “socially and economically disadvantaged” (SED), and not anything about their race/ethnicity. Thus, the annual reports produced by SBA do not drill down to the level needed by the committee for its analysis.
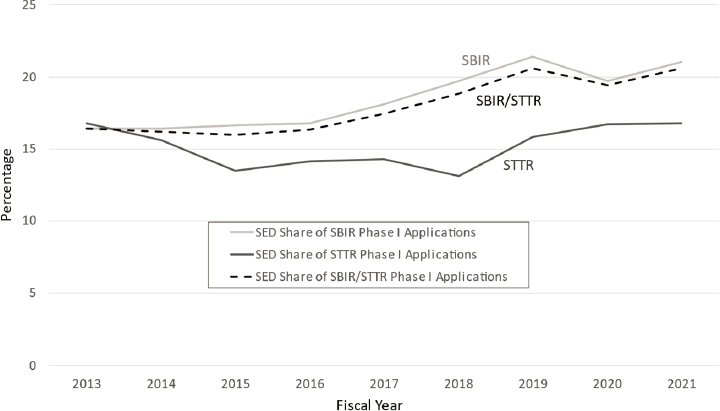
As shown in Figure 4-3, the overall share of SBIR/STTR Phase I applications from SED-owned small businesses increased from 16.4 percent in

SOURCE: Committee calculations based on U.S. Small Business Administration, SBIR/STTR Awards database, fiscal years 2013–2021 (SBIR.gov) and System for Award Management database (SAM.gov).
FY2013 to nearly 21 percent in FY2021.3 Based on these data alone, it is difficult to determine whether NSF has, in fact, succeeded in attracting more applications from minority-owned small businesses.
Breaking these data down by program, the share of STTR applications from SED-owned small businesses is substantially lower than the corresponding share of SBIR applications (although the number of STTR awards is quite small, limiting understanding of any trend). Again, however, the degree to which data on applications from SED-owned companies align with the share of applications from underrepresented minorities is not clear. Thus without underlying application information from NSF, the committee was unable to make any inferences about changes to the demographics of the applicant pool.
___________________
3 As with woman-owned small businesses, data on applications from SED-owned small businesses are not available prior to FY2013.
NOTE: Data on applications from SED-owned small businesses are not available prior to fiscal year (FY) 2013.
SOURCE: U.S. Small Business Administration, SBIR/STTR Annual Reports FY2013–2021. (SBIR.gov).
The committee was, however, able to obtain more information about the demographic makeup of the awardee pool. The committee matched the race and ethnicity of awardees with the demographic information provided in SAM for FY2011–2021, and found that the share of SBIR/STTR Phase I and Phase II awards to African American– or Black-owned small businesses, Latine- or Hispanic-owned small businesses, and American Indian–owned small businesses is still small but shows an overall positive trend, although there is variability across time (Table 4-1). The trend for Asian American– or Pacific Islander–owned small businesses, however, is in the opposite direction: the overall trend is downward. This downward trend is particularly concerning given the high Asian American representation in the science and engineering workforce (NCSES, 2021). Asian Americans also account for a large share (14 percent) of employees in the high-tech sector (defined as industries with a high concentration of science, technology, engineering, and mathematics [STEM] employees that produce goods and services advancing electronic and computer-based production methods), and for nearly one-fifth of executives in the high-tech sector (EEOC, n.d.).
| Fiscal Year (FY) | African American–or Black-Owned | Latine- or Hispanic-Owned | American Indian–Owned | |||
|---|---|---|---|---|---|---|
| Share of Phase I Awards (%) | Share of Phase II Awards (%) | Share of Phase I Awards (%) | Share of Phase II Awards (%) | Share of Phase I Awards (%) | Share of Phase II Awards (%) | |
| 2011 | 1.8 | 1.7 | 0.7 | 0.8 | 0.0 | 0.8 |
| 2012 | 0.4 | 2.9 | 1.3 | 1.5 | 0.0 | 0.0 |
| 2013 | 1.6 | 1.0 | 1.3 | 2.0 | 0.5 | 0.0 |
| 2014 | 1.3 | 0.9 | 3.0 | 1.8 | 0.7 | 1.8 |
| 2015 | 1.9 | 0.9 | 1.9 | 1.8 | 0.0 | 0.9 |
| 2016 | 2.7 | 1.7 | 2.7 | 1.7 | 0.0 | 0.0 |
| 2017 | 2.4 | 0.8 | 2.4 | 2.5 | 0.7 | 0.0 |
| 2018 | 3.4 | 1.9 | 3.4 | 2.8 | 0.7 | 0.0 |
| 2019 | 3.6 | 3.4 | 2.2 | 2.6 | 0.0 | 0.9 |
| 2020 | 1.5 | 1.7 | 3.1 | 3.3 | 0.8 | 0.0 |
| 2021 | 4.7 | 4.7 | 3.4 | 3.8 | 0.5 | 0.0 |
SOURCE: Committee calculations based on U.S. Small Business Administration, SBIR/STTR Awards database, FY2011–2021 (SBIR.gov), System for Award Management database (SAM.gov), and USASpending data (USASpending.gov).
| Asian American–and Pacific Islander–Owned | Total Share of Awards | Adjusted Totals (not including Asian American– and Pacific Islander–owned) | ||||
|---|---|---|---|---|---|---|
| Fiscal Year (FY) | Share of Phase I Awards (%) | Share of Phase II Awards (%) | Phase I (%) | Phase II (%) | Phase I (%) | Phase II (%) |
| 2011 | 7.3 | 7.6 | 9.8 | 11.0 | 2.5 | 3.4 |
| 2012 | 7.5 | 8.8 | 9.2 | 13.2 | 1.7 | 4.4 |
| 2013 | 8.9 | 5.0 | 12.4 | 7.9 | 3.4 | 3.0 |
| 2014 | 7.3 | 11.0 | 12.2 | 15.6 | 4.9 | 4.6 |
| 2015 | 4.8 | 1.8 | 8.6 | 5.3 | 3.8 | 3.5 |
| 2016 | 3.9 | 6.0 | 9.3 | 9.4 | 5.4 | 3.4 |
| 2017 | 5.1 | 5.0 | 10.6 | 8.3 | 5.5 | 3.3 |
| 2018 | 3.4 | 5.6 | 10.9 | 10.2 | 7.5 | 4.6 |
| 2019 | 4.7 | 3.4 | 10.5 | 10.3 | 5.8 | 6.9 |
| 2020 | 6.7 | 3.3 | 12.1 | 8.3 | 5.4 | 5.0 |
| 2021 | 5.7 | 4.7 | 14.3 | 13.2 | 8.6 | 8.5 |
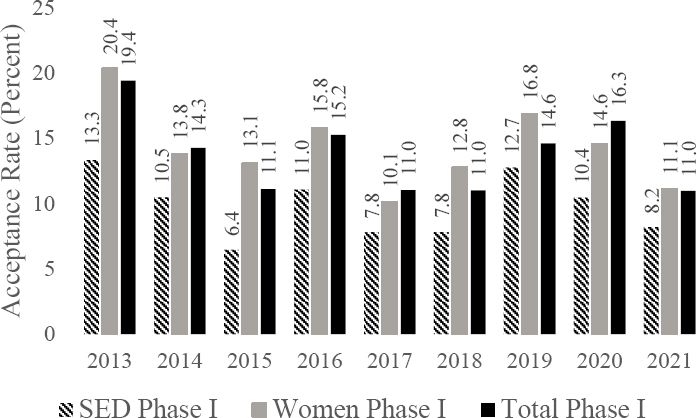
Given the disparity between the published application shares for SED-owned small businesses shown in Figure 4-3 and the award shares for minority-owned small businesses shown in Table 4-1, the committee reviewed the published application-acceptance rates for both Phase I and Phase II applicants for FY2013–2021. These data show that the Phase I application-acceptance rates for SED-owned small businesses were lower than the overall Phase I success rates throughout this period. In contrast, the Phase I application-acceptance rates for woman-owned small businesses exceeded or roughly equaled the overall rates for Phase I applicants. In the case of Phase II, the data show that the application-acceptance rates for SED-owned small businesses have been lower than overall Phase II success rates since FY2017, whereas data for woman-owned small businesses show more positive results, especially in more recent years. (See Figures 4-4 and 4-5.)
Absent information on applicants or peer review scores, it is difficult to impossible to determine the reasons for lower success rates among minority-owned small businesses, which may be due to limited outreach, bias in the review process, or a limited set of interested entrepreneurs. As discussed in Chapter 3, NSF SBIR/STTR program directors mentioned increased success in recruiting women reviewers, but they have not had similar success in recruiting minority
SOURCE: Based on U.S. Small Business Administration, SBIR/STTR Annual Reports fiscal years 2013–2021 (SBIR.gov).

SOURCE: Based on U.S. Small Business Administration, SBIR/STTR Annual Reports fiscal years 2013–2021 (SBIR.gov).
reviewers. Some research suggests that NSF’s review process may be biased against minority applicants (Chen et al., 2022).
Small Businesses That Are New to the Program
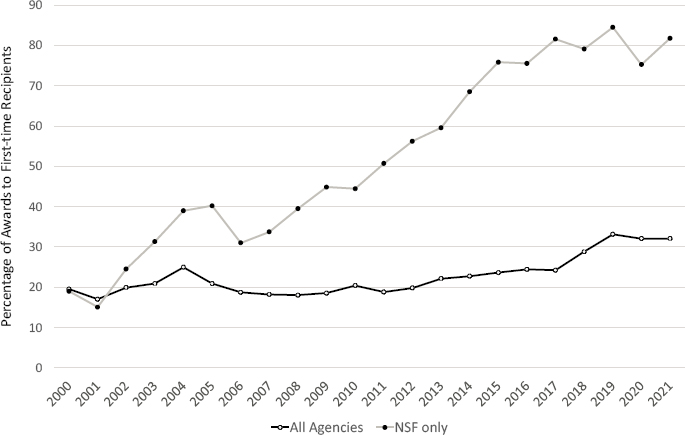
NSF’s SBIR/STTR programs focus on funding start-ups rather than established small businesses, and on awards to small businesses that are new to the SBIR/STTR programs, not just new to NSF’s programs.4 Recent data are consistent with this description. The average age of an NSF SBIR or STTR awardee declined over the past decade (Table 4-2). NSF SBIR and STTR awardees in FY2021 had founded their company less than 5 years prior to receiving their award, and these companies were small, with fewer than 10 employees at the time of their award. Figure 4-6 shows that NSF’s SBIR/STTR awards have increasingly gone to firms that have not previously received these awards.
___________________
4 Ben Schrag, presentation to the NSF SBIR/STTR committee, February 28, 2020.
| Fiscal Year (FY) | Mean Age of Phase I Awardees (in years) | Mean Age of Phase II Awardees (in years) | Mean Age of SBIR Awardees (in years) | Mean Age of STTR Awardees (in years) | Average Number of Employees for Phase I Awardees | Average Number of Employees for Phase II Awardees |
|---|---|---|---|---|---|---|
| 2011 | 7.1 | 7.9 | 7.4 | 6.0 | 8.9 | 12.4 |
| 2012 | 6.4 | 7.8 | 6.7 | 9.4 | 8.5 | 9.6 |
| 2013 | 5.6 | 6.0 | 5.7 | 5.7 | 5.2 | 11.1 |
| 2014 | 4.9 | 5.9 | 5.2 | 5.1 | 5.4 | 4.8 |
| 2015 | 4.3 | 4.5 | 4.0 | 5.9 | 4.3 | 4.8 |
| 2016 | 4.0 | 5.1 | 4.3 | 4.2 | 4.1 | 5.5 |
| 2017 | 4.4 | 4.2 | 4.1 | 5.5 | 4.3 | 3.8 |
| 2018 | 3.5 | 4.9 | 3.9 | 4.1 | 3.3 | 3.8 |
| 2019 | 3.1 | 4.5 | 3.4 | 3.5 | 3.1 | 3.9 |
| 2020 | 4.1 | 4.1 | 4.0 | 4.3 | 3.4 | 3.2 |
| 2021 | 4.0 | 4.3 | 4.1 | 3.7 | 2.9 | 3.2 |
SOURCE: Committee calculations based on U.S. Small Business Administration, SBIR/STTR Awards database (SBIR.gov), and the National Establishment Time-Series database.
SOURCE: Committee calculations based on U.S. Small Business Administration, SBIR/STTR Awards database (SBIR.gov).
TABLE 4-3 Agency Shares of First-time and Repeat SBIR/STTR Award Recipients, Fiscal Years 1985–2020
| Agency | Share of Awards to First-time Winners | Probability of Subsequent Phase I Award from a Given Agency | Share of All SBIR/STTR Awards (%) |
|---|---|---|---|
Department of Defense | 0.12 | 0.73 | 46.6 |
Department of Energy | 0.13 | 0.31 | 7.5 |
Department of Health and Human Services | 0.24 | 0.83 | 23.1 |
National Aeronautics and Space Administration | 0.09 | 0.30 | 9.4 |
National Science Foundation | 0.37 | 0.19 | 7.4 |
Other | 0.30 | 0.27 | 6.0 |
SOURCE: Committee calculations based on U.S. Small Business Administration, SBIR/STTR Awards database (SBIR.gov).
NSF is also less likely to fund a subsequent project for the same small business. The committee found that the probability of receiving a subsequent Phase I award from NSF is only 0.19, much lower than the probability at other agencies (Table 4-3).
Innovation is a complex process that often requires multiple inventions to lead to a commercial product, and although NSF is less likely to provide subsequent awards to a small business it has funded previously, many NSF SBIR/STTR awardees receive subsequent SBIR/STTR funding from other agencies. As Table 4-4 shows, during 1985–2020, a high proportion of NSF SBIR/STTR awardees received subsequent SBIR/STTR awards from other agencies. For example, 36.5 percent of NSF awardees that received another SBIR/STTR award received that award from the Department of Defense, and 16 percent received it from the Department of Health and Human Services. Thus, NSF, with its broader mandate, provides initial funding for projects that often subsequently receive additional funding from mission agencies with more targeted needs and solicitations.
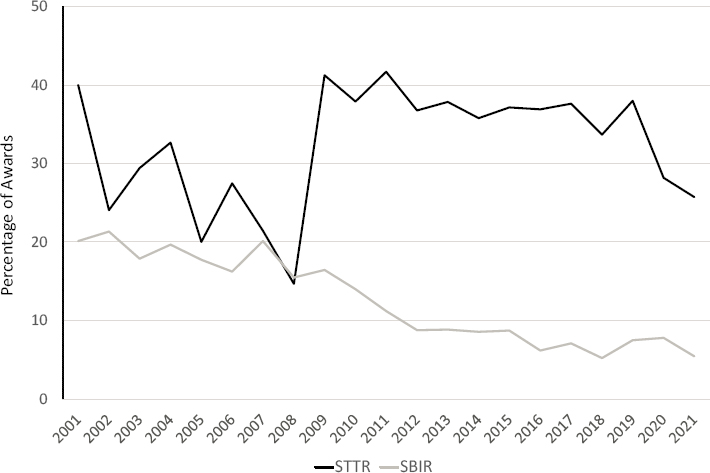
The committee also researched how many principal investigators (PIs) for projects that received SBIR/STTR awards had received previous NSF non-SBIR/STTR awards. The committee found that this was the case for a very small share of SBIR/STTR awards and that this share has been declining. In FY2021, the share was 5 percent for SBIR PIs and 26 percent for STTR PIs (Figure 4-7).5
___________________
5 These numbers may underestimate the relationship between NSF’s non-SBIR/STTR grants and its SBIR/STTR programs if SBIR and STTR awardees are postdoctoral scholars or graduate students who
| Agency A | |||||||
|---|---|---|---|---|---|---|---|
| Agency B | DoD | DOE | HHS | NASA | NSF | Other | |
| DoD | 72.6 | 5.1 | 4.1 | 10.6 | 4.5 | 3.2 | |
| DOE | 39.0 | 30.9 | 7.4 | 9.6 | 7.6 | 5.6 | |
| HHS | 7.5 | 1.6 | 83.3 | 1.4 | 3.8 | 2.4 | |
| NASA | 48.0 | 7.1 | 5.8 | 30.2 | 5.6 | 3.4 | |
| NSF | 36.5 | 11.9 | 16.4 | 8.6 | 19.1 | 7.5 | |
| Other | 30.4 | 10.7 | 13.8 | 8.4 | 9.6 | 27.1 | |
NOTE: DoD = Department of Defense; DOE = Department of Energy; HHS = Department of Health and Human Services; NASA = National Aeronautics and Space Administration; NSF = National Science Foundation.
SOURCE: Committee calculations based on U.S. Small Business Administration, SBIR/STTR Awards database (SBIR.gov).
SOURCE: Committee calculations based on NSF Award archive
(https://nsf.gov/awardsearch/).
___________________
were supported by previous NSF non-SBIR/STTR grants. The committee was unable to trace these relationships because graduate students and postdoctoral scholars are not listed as principal investigators in NSF’s databases.
This finding is especially surprising given that a large percentage of SBIR and STTR PIs appear to have had recent academic experience. The committee analyzed the FY2018 SBIR and STTR cohort of PIs and found that 22.5 percent of SBIR PIs were recent graduate students or postdoctoral researchers, and an additional 16 percent were faculty members in 2017, the year prior to their applications for an SBIR award.6 Not surprising, the share of faculty members among STTR PIs was higher, with 41 percent holding faculty positions in 2017, while 15 percent were recent graduate students or postdoctoral researchers.7
Among the small set of PIs that had previously received NSF grants, most had received those awards from the Engineering Directorate, with a small number receiving grants from a few other directorates. The SBIR/STTR programs were housed in the Engineering Directorate before the Technology, Innovation and Partnerships (TIP) Directorate, in which it now resides, was created. Overall, the numbers and shares of SBIR/STTR PIs receiving previous NSF grants are quite low, and only 2.7 percent of PIs from the Engineering Directorate later have received an SBIR/STTR award (see Table 4-5).
Geographic Distribution of Awardees
The geographic distribution of NSF SBIR/STTR awardees is similar to that of all NSF awardees, with firms from California, Massachusetts, and New York receiving the most awards. Table 4-6 shows the 10 states with the highest number of NSF total awards and NSF SBIR/STTR awards. None of these top 10 states is in NSF’s Established Program to Stimulate Competitive Research (EPSCoR), which makes investments to “enhance the research competitiveness of targeted jurisdictions” (NSF, n.d.l).
It should be noted, however, that looking at only the raw number of awards in each state (or even award dollars by state) does not take into account differences among states, such as population levels. For example, normalizing SBIR/STTR awards by state population reveals that Alaska, Delaware, Hawaii, Montana, New Hampshire, and Rhode Island—all EPSCoR states—are among the top 10 states for NSF SBIR/STTR awards during FY2012–2021.
STTR COLLABORATIONS
The committee analyzed characteristics of small businesses that receive NSF STTR awards to assess the effectiveness of the program in stimulating new collaborations and to identify any obstacles that may prevent or inhibit such collaborations. As described in Chapter 1, the STTR program requires the small
___________________
6 Committee calculations based on LinkedIn and U.S. Small Business Administration, SBIR/STTR Awards Database (SBIR.gov).
7 Committee calculations based on LinkedIn and U.S. Small Business Administration, SBIR/STTR Awards Database (SBIR.gov).
TABLE 4-5 Previous NSF Grants to NSF SBIR/STTR Awardees, Fiscal Years 2000–2021
| NSF Directorate | Number of NSF SBIR/STTR Awards Whose Principal Investigator [PI] Was Previously Funded by This NSF Directorate | Percentage of NSF SBIR/STTR Awardees with Previous NSF Grants from This Directorate (%) | Percentage of SBIR/STTR PIs in Each Directorate Who Received a Subsequent SBIR/STTR Award (%) |
|---|---|---|---|
| Engineering | 837 | 50.4 | 2.7 |
| Computer & Information Science & Engineering | 189 | 11.4 | 1.0 |
| Education and Human Resources | 178 | 10.7 | 0.4 |
| Mathematical & Physical Sciences | 170 | 10.2 | 0.6 |
| Biological Sciences | 102 | 6.1 | 0.4 |
| Geosciences | 71 | 4.3 | 0.4 |
| Office of the Director | 63 | 3.8 | 0.6 |
| Social, Behavioral and Economic Sciences | 48 | 2.9 | 0.2 |
| Budget, Finance and Award Management | 2 | 0.1 | 2.3 |
| Total | 1,660 | 100 |
SOURCE: Committee calculations based on data from the NSF Award archive (https://nsf.gov/awardsearch/).
business to partner with a research institution, with 30–60 percent of the work being conducted by that institution. NSF’s STTR program requires the PI to be employed by the small business and a co-PI to be employed by the research institution.
The committee compared firms that received only an NSF SBIR award with firms that received at least one NSF STTR award, some of which also received a subsequent NSF SBIR award. Given the limitations of the STTR data available on the SBA awards website, the committee restricted its analysis to firms that began participating in NSF’s SBIR/STTR programs in 2001–2019, a universe of 1,656 small businesses, 1,209 of which received only SBIR awards (Table 4-7).
TABLE 4-6 Top 10 States for NSF Awards, Fiscal Years 2012–2021
| NSF Awards | NSF SBIR/STTR Awards | ||
|---|---|---|---|
| State | Number of Awards | State | Number of Awards |
| California | 13,879 | California | 980 |
| New York | 8,811 | Massachusetts | 393 |
| Massachusetts | 7,604 | New York | 293 |
| Pennsylvania | 6,136 | Texas | 206 |
| Illinois | 5,060 | Pennsylvania | 176 |
| Michigan | 3,943 | Colorado | 160 |
| North Carolina | 3,756 | Illinois | 153 |
| Florida | 3,682 | Maryland | 147 |
| Virginia | 3,270 | North Carolina | 142 |
| Colorado | 3,137 | Michigan | 138 |
SOURCE: Committee calculations based on U.S. Small Business Administration, SBIR/STTR Awards database (SBIR.gov), and NSF award database, fiscal years 2012–2021.
First, the committee found that the STTR program has diversified the overall geographic reach of NSF-sponsored research activities. Compared with those firms receiving only SBIR awards, STTR-awarded firms are more likely to be located in the Midwest or the South compared with firms receiving only NSF SBIR awards (Table 4-7).
Next, NSF STTR–awarded firms also tend to be older than firms receiving only NSF SBIR awards. The average NSF STTR–awarded firm was more than 4 years old when it received its first NSF STTR award, compared with an age of less than 3 years for firms receiving only NSF SBIR awards (Table 4-7). This differential suggests that it takes more time to develop the collaborations and secure the required intellectual property agreements with research partners that are required for STTR applications relative to what is required for SBIR applications. There is also evidence that NSF STTR–awarded firms tend to receive more NSF Phase I awards and participate in the programs longer than those that receive only NSF SBIR awards (Table 4-8).
The committee also analyzed patterns of research collaboration among NSF STTR awardees, using research partnership information for 2004–2017. The committee found that the vast majority of NSF STTR research partners were universities (Table 4-9); the most common university research partners were land-grant universities.8 Not surprisingly, NSF STTR–awarded firms are less likely to partner with the federal laboratories compared with firms receiving STTR awards from other agencies.
___________________
8 The top 10 universities listed as NSF STTR research partners are the University of Colorado Boulder; The Ohio State University; The Pennsylvania State University; Purdue University; Virginia Polytechnical Institute and State University; the University of Michigan, Ann Arbor; Georgia Institute of Technology; the University of California, Berkeley; Carnegie Mellon University; and the University of Florida.
TABLE 4-7 Characteristics of NSF SBIR–Awarded Firms versus NSF STTR–Awarded Firms, 2001–2019
| Characteristic of Firms in the First Year They Received an Award | Average (Mean) across All Awarded Firms | Minimum Value | Maximum Value | Average (Mean) for SBIR-only Recipients | Average (Mean) for Firms That Received at Least One STTR Award |
|---|---|---|---|---|---|
| Firm age at receipt of first award* | 3.07 | 0 | 26 | 2.89 | 4.04 |
| Share that were woman-owned | 0.19 | 0 | 1 | 0.18 | 0.19 |
| Share that were SED-owned | 0.1 | 0 | 1 | 0.10 | 0.12 |
| Share of firms that were HUBZone certified* | 0.25 | 0 | 1 | 0.23 | 0.32 |
| Number of employees | 4.3 | 1 | 450 | 4.15 | 4.63 |
| Share of firms located in the Northeast | 0.22 | 0 | 1 | 0.23 | 0.19 |
| Share of firms located in the Midwest* | 0.18 | 0 | 1 | 0.16 | 0.22 |
| Share of firms located in the South* | 0.22 | 0 | 1 | 0.19 | 0.28 |
| Share of firms located in the West* | 0.36 | 0 | 1 | 0.42 | 0.31 |
| N | 1,656 | 1,209 | 447 |
NOTES: (*) indicates that the difference between SBIR-only and STTR-awarded firms is statistically significant. SED = socially and economically disadvantaged.
SOURCE: Committee calculations based on U.S. Small Business Administration, SBIR/STTR Awards database (SBIR.gov), and the National Establishment Time-Series database.
TABLE 4-8 Cumulative Awards for NSF SBIR– and STTR–Awarded Firms at Ages 5 and 10
| Average (Mean) across All Awarded Firms | Minimum Value | Maximum Value | Average (Mean) for SBIR-only Recipients | Average (Mean) for Firms that Received at Least One STTR Award | |
|---|---|---|---|---|---|
| Cumulative number of Phase I awards when firm is 5 years old* | 1.57 | 1 | 13 | 1.42 | 1.91 |
| N | 1,099 | ||||
| Cumulative number of Phase I awards when firm is 10 years old* | 1.91 | 1 | 11 | 1.69 | 2.21 |
| N | 310 |
NOTE: (*) indicates that the difference between SBIR-only and STTR-awarded firms is statistically significant.
SOURCE: Committee calculations based on U.S. Small Business Administration, SBIR/STTR Awards database (SBIR.gov), and the National Establishment Time-Series database.
TABLE 4-9 Characteristics of Research Partners for NSF STTR–Awarded Firms
| Type of Partnering Research Institution | Number of NSF STTR Awards | Percentage of NSF STTR Awards (%) | Percentage of All STTR Awards (%) |
|---|---|---|---|
| University | 942 | 94.6 | 89.1 |
| Hospital | 7 | 0.7 | 0.3 |
| Federal laboratory | 26 | 2.6 | 5.0 |
| Other government agency | 22 | 2.2 | 0.3 |
| Nonprofit research institution | 94 | 9.4 | 2.8 |
| For-profit research institution | 71 | 7.1 | 3.9 |
| Total | 996 |
NOTE: Categories are not mutually exclusive, and percentages add up to more than 100 percent.
SOURCE: Committee calculations based on STTR award activity and partner reported in U.S. Small Business Administration, SBIR/STTR Awards database (SBIR.gov), fiscal years 2004–2017.
While the STTR program does help diversify the overall geographic reach of NSF-sponsored R&D activities, the participation of firms and partners located in rural areas is limited: about 75 percent of NSF’s STTR–research institution partnerships are between firms and research partners located in major metropolitan areas,9 whereas less than 2 percent of awarded firms and less than 7 percent of research partners are located in rural areas. Moreover, very few NSF STTR-awarded small businesses partner with minority-serving institutions (less than 2 percent).10
Finally, the committee looked at the relationship between small-business PIs and partnering research institutions to identify any patterns in these collaborations, using information on PIs from LinkedIn searches and institutional webpages for first-time NSF STTR awardees on or after 2001. The committee found that NSF STTR recipients most often relied on their own prior professional or educational ties when identifying a research partner. About one-fifth of STTR recipients had a prior professional placement with their research partner, either as postdoctoral scholar, faculty, or staff, and nearly one-third had received graduate training with their research partner.
Given the paucity of collaborations between STTR awardees and historically Black colleges and universities, NSF might explore, as part of its outreach and diversity efforts, whether there are historical barriers to research partnerships with minority-serving institutions and if so, how these barriers might be overcome. As discussed in Chapter 5, information on unfunded applicants would provide additional insight on the breadth of proposed collaborations.
___________________
9 Committee calculations based on U.S. Small Business Administration, SBIR/STTR Awards database (SBIR.gov).
10 Committee calculations based on U.S. Small Business Administration, SBIR/STTR Awards database (SBIR.gov).
I-CORPS AND SBIR/STTR AWARDS
As described in Chapter 3, NSF’s Innovation Corps (I-Corp) is a 7-week program designed to help entrepreneurs understand the commercial potential of their innovations; it is open to all NSF awardees, not just those in the SBIR and STTR programs. NSF has increased the number of I-Corps participants in recent years, and a growing number of participants have gone on to win SBIR/STTR awards. As shown in Table 4-10, an increasing number of woman-owned and SED-owned firms have participated successfully in the I-Corps program. In FY2020, 25.6 percent of woman-owned firms and 30.9 percent of SED-owned firms receiving SBIR/STTR Phase I awards had participated in the I-Corps program, in both cases before receiving an SBIR or STTR Phase I award.
The committee also calculated the share of awards connected to PIs, business contacts, or small-business owners who had participated in I-Corps. In the case of woman- or SED-owned small businesses, the committee found a statistically significant difference in the percentage of SBIR/STTR awards received by these firms if the firm’s PI, business contact, or owner had participated in the I-Corps program before applying for the award.11 There was no statistically significant difference for applicants from EPSCoR states or
| Fiscal Year | Non-SED-Owned Firms | SED-Owned Firms | Non-Woman-Owned Firms | Woman-Owned Firms | Grand Total |
|---|---|---|---|---|---|
| 2011 | 0.0 | 0.0 | 0.0 | 0.0 | 0.0 |
| 2012 | 1.7 | 0.0 | 1.5 | 2.2 | 1.6 |
| 2013 | 5.3 | 2.2 | 4.7 | 6.7 | 5.0 |
| 2014 | 6.0 | 6.5 | 5.6 | 8.7 | 6.1 |
| 2015 | 7.4 | 6.1 | 7.4 | 6.9 | 7.3 |
| 2016 | 7.3 | 3.8 | 5.7 | 12.5 | 6.9 |
| 2017 | 8.4 | 6.8 | 7.4 | 12.7 | 8.2 |
| 2018 | 7.4 | 18.4 | 8.1 | 11.4 | 8.8 |
| 2019 | 12.5 | 16.9 | 11.8 | 18.1 | 13.2 |
| 2020 | 19.2 | 30.9 | 19.5 | 25.6 | 20.5 |
NOTE: SED = socially and economically disadvantaged.
SOURCE: Committee calculations based on NSF Innovation Corps lists and U.S. Small Business Administration, SBIR/STTR Awards database, fiscal years 2011–2021 (SBIR.gov).
___________________
11 The SBA website provides the name of the firm’s PI and a contact name. The name of the firm’s owner is available from SAM.
| Percentage of Awards to Firms That Had Not Previously Participated in I-Corps (%) | Percentage of Awards to Firms That Had Previously Participated in I-Corps (%) | |
|---|---|---|
Woman-owned firms* | 12 | 17 |
Socially and economically disadvantaged firms* | 12 | 18 |
From an EPSCoR state | 13 | 12 |
STTR Awardees | 13 | 15 |
NOTES: (*) indicates that the difference was statistically significant. For the purposes of the analysis in this table, firm participation in I-Corps means that the principal investigator, business contact, or owner had taken part in I-Corps. EPSCoR = Established Program to Stimulate Competitive Research.
SOURCE: Committee calculations based on NSF I-Corps lists and U.S. Small Business Administration, SBIR/STTR Awards database, fiscal years 2012–2021 (SBIR.gov).
overall STTR applicants. For example, the share of Phase I awards to woman-owned businesses that did not participate in I-Corps before applying averaged 12 percent during FY2012–2021, while 17 percent of awards went to woman-owned small businesses with a PI, business contact, or owner who had participated in I-Corps (Table 4-11).
CONCLUSION
This chapter has reviewed application and award data across a number of demographic variables and looked at participation in I-Corps and its relationship to receipt of NSF SBIR/STTR awards. NSF has substantially improved application success rates for woman-owned small businesses, perhaps as a result of the increased participation in (and expansion) of the I-Corps program, efforts to increase the number of women reviewers for the SBIR/STTR programs, or other factors. Although the committee had insufficient information with which to analyze the effectiveness of I-Corps, such precommercialization assistance programs suggest a pathway to expanding the impact and diversity of awardees. At the same, NSF has not made substantial headway in increasing the share of awards to minority-owned firms and in fact has lost ground in the share of awards to small-business owners who identify as Asian or Pacific Islander.
The data show that NSF has substantially increased the number of firms that are new to the SBIR/STTR programs, but efforts to restrict the number of awards that a firm can receive across all agencies may be counterproductive with respect to the production of complex innovations. Furthermore, very few SBIR/STTR awardees have received other NSF grants, a possible missed
opportunity for NSF to spur the emergence of commercial products from its funded research.
Despite the lack of overlap between NSF SBIR/STTR and other NSF grants, the geographic distribution of NSF SBIR/STTR awards is similar to that of all NSF grants. While the STTR program has helped diversify the geographic distribution of awardees, the majority of those awards are given to firms and research partners in urban areas. STTR awardees also tend to rely on their prior professional or educational ties when choosing research partners; there is little participation with minority-serving institutions.
FINDINGS AND RECOMMENDATIONS
Finding 4-1: The NSF SBIR/STTR programs’ focus on first-time applicants and awardees is consistent with the agency’s unique mission and goals.
Finding 4-2: NSF’s SBIR/STTR programs are funding small, young firms with founders or principal investigators that are new to the programs and to NSF.
Finding 4-3: NSF has increased the share of its SBIR/STTR awards to woman- and minority-owned small businesses; however, the share of awards to small businesses owned by underrepresented minorities has increased very little in the past decade, and the share of awards to small businesses owned by Asian Americans has declined.
Finding 4-4: NSF SBIR/STTR awardees are unlikely to receive subsequent awards from NSF. Many NSF SBIR/STTR awardees receive subsequent awards from other agencies, such as the Department of Defense and the National Institutes of Health.
Finding 4-5: SBIR/STTR awards can provide a route to commercializing research supported by NSF, but only a small share of NSF SBIR/STTR awards go to principal investigators with previous NSF (non-SBIR/STTR) awards. Most of the grants to prior NSF awardees are from NSF’s Engineering Directorate.
Finding 4-6: NSF’s Innovation Corps (I-Corps) program suggests a pathway for increasing the diversity of NSF’s applicants and awardees, possibly by increasing the share of woman- and minority-owned businesses that apply for NSF Phase I awards or increasing the likelihood that such firms win an NSF Phase I award. Absent data on unfunded applicants, the underlying cause of the increase in Phase I
awards to woman-owned small businesses or small-business owners who are socially and economically disadvantaged and participated in I-Corps is unclear.
Finding 4-7: NSF STTR recipients partner predominantly with universities, most commonly large, public, research-intensive universities. STTR recipients tend to use prior professional and educational networks when choosing a research partner. Historically Black colleges and universities are infrequent research partners for NSF’s STTR awardees.
Recommendation 4-1: Congress should give federal research agencies the latitude to prescribe individually the appropriate maximum number of SBIR/STTR applications and awards that can be allowed for any given small business.
Recommendation 4-2: The new Directorate for Technology, Innovation and Partnerships should proactively encourage program directors across all NSF directorates to provide information on NSF’s SBIR/STTR programs to grantees conducting NSF-funded research and development.


