Mitigating Arboviral Threat and Strengthening Public Health Preparedness: Proceedings of a Workshop (2024)
Chapter: 3 Assessing and Detecting Arboviral Risk
3
Assessing and Detecting Arboviral Risk
Highlights
- The World Health Organization (WHO) is working to develop an integrated global arbovirus reporting system that will collect, aggregate, and analyze data from around the world. (Rojas)
- There are large gaps between different regions in their capabilities to collect, analyze, and report data and to act on those data. Improving the global surveillance system will require helping the countries that are lagging improve the capabilities. (Rojas)
- There has been exponential growth in the amount of genomic data on arboviruses published over the past three decades. These data enable genomic epidemiology. (Faria)
- Genomic data can be used in near-real time to analyze the dynamics of an outbreak. Such data can also improve forecasting. (Faria)
- Singapore uses a multiprong approach to control dengue, with two aimed at keeping the mosquito population low and the other two intended to break the transmission chain once cases of dengue have appeared. (Ng)
- Knowing the genotypes of the prevalent viruses can provide important information both for tracking and implementing control efforts. (Ng)
- Models can be valuable in predicting the likely spread of a virus and in proving the value of surveillance and control efforts. (Ng)
- Diagnostic testing can play a major role in arbovirus mitigation, and, indeed, dengue diagnostics are now on the WHO essential diagnostics list. (Boeras)
- Multiplex diagnostic tests that look for multiple arboviruses have promise for both patient management and surveillance. (Boeras)
NOTE: These points were made by the individual workshop speakers/participants identified above. They are not intended to reflect a consensus among workshop participants.
Eva Harris, professor of infectious diseases and vaccinology at the University of California, Berkeley, chaired the second session on current and forward-thinking strategies of assessing and detecting arboviral risk, specifically through surveillance and diagnostics. “I think we’re at a really exciting place,” she said, because of the variety of techniques, particularly molecular and genomics methods, for tracking and diagnosing arboviruses and arboviral diseases.
The panel consisted of four presenters. Diana Rojas, technical officer in the Epidemic and Pandemic Preparedness and Prevention Department at the World Health Organization (WHO), spoke on epidemiological surveillance. Nuno Faria, professor of viral genomic epidemiology in the School of Public Health at Imperial College London, discussed genomic surveillance. Lee Ching Ng, group director of the Environmental Health Institute at Singapore’s National Environment Agency, spoke about integrated surveillance and risk assessment in Singapore. Finally, Rosanna Peeling, professor emeritus at the London School of Hygiene and Tropical Medicine and the founding director of the International Diagnostic Center Network, was scheduled to speak but could not attend, so her presentation—with additional contributions—was made by Debi Boeras, founder and chief executive officer of the Global Health Impact Group. She spoke about the role that diagnostics can play in arbovirus surveillance and mitigation.
EPIDEMIOLOGICAL SURVEILLANCE
Rojas began by describing WHO’s Global Arbovirus Initiative, a six-pillar plan to tackle mosquito-borne viruses with epidemic and pandemic potential in an integrated way. The first pillar, monitoring and anticipat-
ing risk, would be the subject of her talk, and she quickly described the other five pillars before returning to the first. The second pillar is reducing epidemic risk at the local level through actions such as strengthening early-detection capacities at the local level, this would include not just improved lab detection but also improving the abilities of health care workers to identify these diseases early in their course. The third pillar is strengthening vector control, including improvements in environmental surveillance. The fourth is preventing and preparing for pandemics, particularly through global coordination and data sharing as well as building more prepared and resilient populations. Fifth is enhancing innovation and new approaches; this refers mainly to strengthening research on vaccines, therapeutics, new vector control tools, and the transmission dynamics of arboviruses. Sixth is building a coalition of partners. “If we all have the same goal, if we all have the same priorities, we will be more likely to succeed,” Rojas said.
Turning her attention back to the first pillar—monitoring risk and anticipation—Rojas said that the pillar has two priority actions associated with it. The first is to develop a global risk monitoring framework for arboviruses using a One Health approach, and the second is to use that framework to forecast and model potential epidemic and pandemic scenarios for arboviruses. WHO has been working on a data dashboard as part of this first pillar. WHO first developed an inventory of the data services and systems across the WHO regions and is now working on an integrated arbovirus reporting system that would capture arbovirus-related data from the local level, aggregate them, and send them to the regional level and ultimately to the global level. With those data, the next step would be to then design and operationalize a global arbovirus dashboard that would be hosted by WHO headquarters. However, Rojas said, there are some regions that are more advanced in arbovirus surveillance architecture than others. Due to delays and additional complexities from the COVID-19 pandemic, WHO worked with the London School of Hygiene and Tropical Medicine to develop two tools in parallel. The first was to build a data dashboard with individual regions, and the second was to create an integrated risk map with a model including environmental data and other open data sources that can give a quick risk assessment of the situation. Rojas demonstrated a draft of the integrated risk map.1 “We are trying to do a hotspot mapping for all the zoonotic and epidemic pathogens with epidemic and pandemic potential,” she explained, which included avian influenza, SARS, and Rift Valley fever. The next step will be to validate these hotspot maps.
In its work with the individual regions on data dashboards, WHO has realized different capacities at the different regions. The Pan American
___________________
1 https://experience.arcgis.com/experience/31ff667796be41f8b4e2cd0393e44bfe/ (accessed February 4, 2024).
Health Organization (PAHO) has one of the most complete surveillance systems on arboviruses, Rojas said, including open data that allow real-time monitoring of this information through PLISA, the Spanish acronym for the Health Information Platform for the Americas. PAHO has been sharing their experience with other regions, and now the southeast Asia region is publishing a bulletin and working on its dashboard, as is the western Pacific region.
In 2021, WHO carried out a global capacity survey for the surveillance, prevention, and control of arboviral diseases, and 167 countries and territories participated. The survey found major inequalities both within and between countries. “We have countries that moved completely from paper-based to computer-based surveillance or even real-time surveillance using cell phones, iPads, and computers,” Rojas said. “But then you have some that are still using paper,” and transferring the information on paper to digital format can pose a significant challenge to effective surveillance.
Similarly, while some countries report their data in real or near-real time, others report quarterly or even yearly. While this can be sufficient for program evaluation, it is not adequate for monitoring outbreaks or pathogens with epidemic or pandemic potential, Rojas noted. Thus, WHO is working with several countries to help them gather and report their data in a timelier fashion. Another issue is that while some countries are able to collect the data, they do not have the personnel or the tools to conduct analysis of these data. WHO is also working to bring analytic tools to the local level so that health authorities can take advantage of the data they have gathered. Data analysis is basic to informing early warning systems, Rojas noted. A separate issue is that some countries have early warning systems but ministries of health are not using the data. The question, then, is how to get countries to take action based on the surveillance outcomes. Another problem in some countries, she added, is that epidemiological surveillance is isolated from other surveillance systems. In those cases, it is important to integrate the epidemiological surveillance data with laboratory surveillance data, including data from genomic surveillance, entomological surveillance, and environmental surveillance. Finally, in some countries there is little or no action taken even when an alert is triggered by arboviral disease surveillance.
Rojas noted some gaps and opportunities in improving surveillance on a regional level. In some regions, for instance, there are no regional agreements on arbovirus surveillance. In those cases, the countries should agree on standard case definitions, which basic variables should be shared, what confirmatory tests should be given, and how information is shared. One challenge is that some countries are worried that reporting on arboviruses will affect tourism. There should be people in each region who are working to drive arbovirus surveillance processes.
On the global level, Rojas said that there are also several steps that can be taken to improve surveillance globally. “We need to fill the gaps and inequities in technology across the globe to guarantee timely or real-time surveillance,” she said, and analytical tools need to be transferred to the local levels to improve response. Such tools could include early-warning systems, modeling, and genomic surveillance, among others. Lessons learned from the capacities built during the COVID-19 response should be used in improving surveillance capabilities for other diseases, such as arboviral diseases. Using an integrated approach like One Health to monitor and control arboviral diseases will be crucial, as will taking a multisectoral approach at all levels. Other factors in strengthening the control of and response to arboviral diseases are increasing awareness of those diseases, building trust with communities, and maintaining continuous financial support. Finally, Rojas said, laboratories and surveillance systems must be prepared now before outbreaks emerge.
GENOMIC SURVEILLANCE
Faria gave an overview of current efforts in genomic surveillance, beginning with details on the degree of genomic surveillance conducted for different arboviruses. The more viral genomes known, the more details one can infer about the spread of that virus. In the case of dengue, about 3,000 genomes were sequenced in 2023 alone, Faria said, which corresponds to about seven genomes per million dengue cases. Compared to other pathogens, the number of genomes sequenced for dengue is relatively high, and this is certainly higher than the number of genomes sequenced for other arboviruses such as West Nile and chikungunya viruses. Faria noted that Zika is among the least sequenced arbovirus among these pathogens of concern.
Over the past several decades, there has been exponential growth in the number of genome sequences submitted for arboviral pathogens (Figure 3-1). The first arboviral sequence shared in the National Center for Biotechnology Information’s GeneBank was for yellow fever in 1986. Venezuelan equine encephalitis, West Nile, and dengue genomes followed in 1993, then chikungunya in 1994, and Zika in 2005. More than 20,000 arboviral genomes have been reported up to this point—for dengue, West Nile, chikungunya, Zika, yellow fever, and Venezuelan equine encephalitis, Faria said. If the exponential increase were to continue, he anticipates there would be 250,000 arboviral genomes available within 10 years (Sayer et al., 2023).
The source of viral genome data is also not equally distributed between the pathogens and endemic countries. Brazil produces more sequences for chikungunya, yellow fever, and Zika than any other country, while
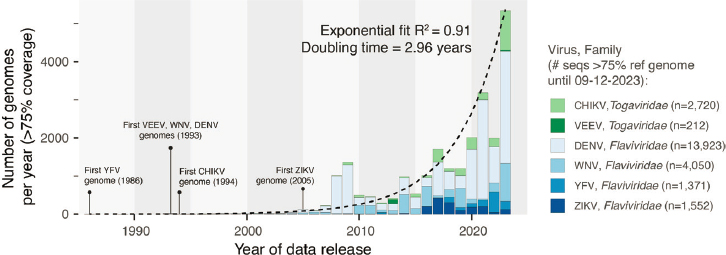
NOTES: CHIKV = chikungunya virus; DENV = dengue virus; VEEV = Venezuelan equine encephalitis virus; WNV = west Nile virus; YFV = yellow fever virus; ZIKV = Zika virus.
SOURCES: Presented by Nuno Faria on December 12, 2023; generated from data in NCBI GenBank and Sayers et al., 2023 by Prof. Nuno R. Faria and Dr. Charles Whittaker.
Thailand leads in the number of dengue sequences produced. Indeed, 82 percent of all dengue sequences published online were produced by just 10 countries—Thailand, Vietnam, China, Brazil, Singapore, Nicaragua, Cambodia, the United States, Venezuela, and India. It is difficult to know exactly how representative the resulting arboviral dataset is relative to the underlying burden of disease and the actual number of cases for these different arboviruses, Faria said.2 However, it is possible to compare estimates of force of infection—the rate at which susceptible individuals in a population acquire an infection—against the number of sequenced genomes per capita in a population. This makes it possible to identify which countries have a high force of infection, but a low number of viral genomes sequenced to determine where to target investments in sequencing. Faria shared that this analysis has identified the Philippines, Jamaica, and El Salvador as countries where it would be beneficial to do more genomic sequencing of dengue and other arboviruses.
Faria went on to describe that there are two main strategies in genomic sequencing to maximize the public health benefit: untargeted sequencing and targeted sequencing. Untargeted sequencing, also known as metagenomics or pathogen-agnostic surveillance, does not require a prior knowl-
___________________
2 Faria also discussed that disease transmission dynamics of different virus influence the ease of detection and, relatedly, the quantity of genomes sequenced. Of note, Zika viral titers in human samples are on average significantly lower compared with titers of chikungunya, dengue, or yellow fever viruses. Faria pointed to this as part of the reason for why there are so few Zika genomes available.
edge of the pathogen genome to be investigated, he said. Instead, with this approach all the genetic material found within a sample is sequenced and assembled into full or partial genomes for analysis. Targeted sequencing, on the other hand, needs a priori knowledge of the viral genome that is being sought. For example, Faria said, untargeted sequencing was used to generate the first genomes of SARS-CoV-2 in Wuhan, China, and it is very useful for identifying (potentially unknown) pathogens in the early stage of an outbreak. Targeted sequencing is typically used at a later stage of an outbreak or an epidemic and can help provide epidemiological understanding of viral lineages.
Knowledge of the genome sequence of a virus unlocks many applications, Faria said. It can help in designing diagnostics, therapeutics, and vaccines, and it is useful for investigating phenotypic changes, such as a mutation in the chikungunya that increases its transmissibility in Aedes albopictus. For arboviruses, he said, genome sequences could be valuable for investigating their drivers of emergence, persistence, and evolution. One key application is genomic epidemiology that leverages these sequence data to study the distribution and spread of pathogens. There are four key components of genomic epidemiology, Faria said. It starts with sequencing viral genomes from samples that were identified as positive for the presence of the pathogen by polymerase chain reaction (PCR) and have appropriate metadata. The next step is bioinformatics, which typically involves phylogenetic inference using both outbreak and background sequences. In many cases, this is a major bottleneck in the overall process. Next are genetic analyses, where researchers investigate how transmission likely took place over time and reconstruct the evolutionary history of a given pathogen. It is normally done using samples recovered from human patients, but in the case of zoonotic or epizootic cycles the viruses may have come from mosquitoes, nonhuman primates, or other sources. The fourth step is translation into public health action. There are many open questions on how to best approach this, Faria said, but dashboards and visualizations have proved helpful in things like investigating transmissibility and the severity of viral lineages and making forecasts.
To illustrate ways that genomic information can be used in arbovirus surveillance, Faria shared an example from 2016 where detection of Zika virus and its potential origin was optimized using climate-informed temporal sampling. There were many samples available for testing with very limited time, so his group used a map of suitability for Aedes mosquitoes to determine which samples they would test (Faria et al., 2017). That process allowed them to recover about 54 genomes for Zika during a 2-week period. By comparing these 54 genomes with another 200 Zika genomes, they discovered that Zika had been introduced into Brazil from French Polynesia in a single event and, more importantly, that it had been circu-
lating undetected for over 1 year across Brazil and across other countries before it was first detected in May 2015.
In another study, Faria’s group collaborated with the Angolan Ministry of Health to sequence Zika samples and showed that the virus strains circulating in Angola were connected to strains circulating in northeast Brazil. Then, using mobility data such as the number of monthly air passengers to Angola, they showed that air travel was linked to the spread of the Zika virus and, specifically, that the Asian lineage of the Zika virus was linked to continental Africa and Angola (Hill et al., 2019). Another team sequenced 39 Zika genomes from a 2016 outbreak in Florida, identified four lineages, and determined an R0 of between 0.5 and 0.8 that allowed them to estimate a very low probability that Zika would persist for over 1 year in Florida.3 Furthermore, they were also able to hypothesize that there were about 40 separate introductions of the Zika virus in Miami alone (Grubaugh et al., 2017). The value of genomics data is illustrated in another study, still in preparation in late 2023, where he and colleagues compared the performance of different forecast models for dengue outbreaks with and without genomic information on the various strains. What they have found, he said, is that all forecasts seem to improve when they consider phylogenetic data in the model.
Faria discussed the yellow fever outbreak in 2017 in Brazil as an exemplar of the importance of using genomic surveillance in understanding the source of arbovirus outbreaks.4 It was the largest outbreak in Brazil in the past 8 years, Faria said, and within 5 days he and his team analyzed 50–60 sequences from nonhuman primates and from humans to investigate whether the outbreak was due to an urban transmission cycle or sylvatic transmission (Faria et al., 2018). “Essentially what we saw using phylogenetic approaches, within 5 days upon arrival,” he said, “was that every human sequence was clustering very closely to a nonhuman primate sequence, indicating frequent cross-species transmission from nonhuman primates to humans” in a sylvatic transmission via non-Aedes mosquitoes. Faria also described an example of work done with untargeted sequencing. When a colony of 68 Alouatta monkeys in a São Paulo Park died within a short period in 2017–2018, Faria and team used untargeted sequencing to simultaneously identify the yellow fever virus that was responsible for their deaths and the mosquito species that had infected them with the virus.
In closing, Faria pointed to areas that need work in the future. There is potential for greater optimization of global detection or arboviral threats,
___________________
3 R0 is a measure of inherent transmissibility of a pathogen in a fully susceptible population, estimating the number of people that one infected person will transmit the disease to. See https://globalhealth.harvard.edu/understanding-predictions-what-is-r-naught/ (accessed July 11, 2024).
4 This outbreak was also referenced by Aldighieri in Chapter 2 as an example of taking a One Health approach in outbreak response.
he said, that could involve considering climate, mobility, force of infection, serological estimates, and sampling strategies as well as focusing on under-sampled locations with high transmission rates. There is also potential for models to integrate genomic data with other surveillance data (epidemiological, serological, mobility, entomological, and climate) to improve forecasts for arboviral disease outbreaks. Faria addressed the role of genomics data in developing future low-cost, temperature-insensitive diagnostic tools to improve arboviral surveillance. He concluded by noting the importance of collaborative surveillance across sectors, emergency cycles, and different geographic levels.
INTEGRATED SURVEILLANCE AND RISK ASSESSMENT: CASE STUDY FROM SINGAPORE
Lee Ching Ng began her description of integrated surveillance and risk assessment of dengue in Singapore by providing some background and context: The three crucial elements in the spread of dengue are the virus itself, mosquitoes, and people. Removing any one of the three will stop the spread of the dengue. At this point in time, the only way to control dengue is to control its spread by mosquitoes. Ng noted the importance of clarity in how the three critical elements of an outbreak interact and affect one another in order to understand the epidemic potential of the virus. The latter is particularly challenging, she said, and involves such things as understanding the immunity of the population, the epidemiology of the disease, and various environmental risk factors such as rainfall and temperature.
A typical outbreak begins with a single case, which then spreads to others to form a cluster, which, if it is not controlled, leads to an outbreak. Efforts to prevent outbreaks can take place on many different levels, Ng said. Accurately diagnosing a patient who has dengue and notifying the appropriate authorities can help prevent an individual case from leading to a cluster, for instance, and prompt intervention to minimize further transmission can prevent a cluster from leading to an outbreak. Singapore’s dengue control framework has four pillars: surveillance, prevention and control, outbreak management, and public communications and advocacy. The first two are aimed at keeping the mosquito population low, while the second two are intended to break the transmission chain once cases of dengue have appeared (Aik et al., 2019; Ho et al., 2023; Sim et al., 2020). Ng focused on Singapore’s surveillance efforts in the remainder of her presentation.
One aspect of Singapore’s dengue surveillance is mandatory reporting of positive results from clinicians and laboratories. Since 2008, when the rapid diagnostic test for dengue (based on the non-structural protein antigen 1, or NS1) became available, the health authorities in Singapore have
been strongly encouraging doctors to use it on patients who present with the appropriate symptoms, and its increasing use has allowed health officials to get a clearer picture of where dengue is appearing. When a patient tests positive with the NS1 antigen test (run using patient blood samples), the laboratory proceeds to determine the virus’s serotype and sequence its genome. In the case of a negative result, the patient sample is subjected to PCR tests for other flaviviruses and chikungunya; many cases of Zika and chikungunya have been discovered this way, Ng added.
The data on dengue infections collected through the NS1 tests are used for public alerts. The public health department maps locations of the cases with a geographic information system (GIS); then, if two cases are discovered within 150 meters of each other within 2 weeks, it is considered to be a cluster, and the existence of a cluster and its location is made available on the National Environment Agency’s website.5 A user can input an address or postal code on the website and see an alert if there is an cluster in that area. People can use this information and implement precautionary measures, such as using insect repellant or wearing long sleeves, she said. Those people who may not use the website are alerted through banners placed around the city. A red banner indicates that there are more than 10 cases in the surrounding area, so care should be taken to avoid infection. A yellow banner indicates fewer than 10 cases in the area, while green indicates that the threat is minimal.
The information obtained from dengue virus serotyping has also proven useful, Ng said. Testing has shown that Singapore has all four serotypes of the virus circulating and that the relative prevalence of the four types provides important information. When the predominant serotype switches from one to another, it is a signal that an outbreak may occur in about 3 months (Rajarethinam et al., 2018). Finally, knowing the genotypes of the prevalent viruses can provide important information. Ng pointed to an outbreak of chikungunya in Singapore in 2008 which had a mutation that allowed the virus to adapt to Aedes albopictus as well as Aedes aegypti (Ng et al., 2009). Since Aedes albopictus is typically encountered outside, in contrast with Aedes aegypti that is mostly encountered inside, the public health department had to modify its control measures to focus more on outdoor efforts.
In recent years, Ng said, Singapore has complemented its clinical surveillance with wastewater surveillance that was set up during the COVID-19 pandemic to track the levels of the SARS-CoV-2 virus. Since Zika virus is shed in urine, the National Environment Agency decided to see whether it was also possible for wastewater surveillance to detect the presence of
___________________
5 https://www.nea.gov.sg/dengue-zika/dengue/dengue-clusters (accessed July 11, 2024).
Zika. When a small cluster of about 20 Zika cases appeared, the agency found that the data from wastewater did track well with the cases and with the presence of Zika in mosquito surveillance. Conversely, there was no evidence of Zika transmission in people where the wastewater surveillance for Zika was negative. Thus, Ng stated that the wastewater testing offers a reliable way of monitoring for Zika and aids in targeting vector control efforts. Unfortunately, infected patients do not have high shedding of dengue virus in bodily fluids, and wastewater testing for dengue have not proven effective.
As part of their surveillance efforts, Singapore health authorities also test mosquitoes for dengue. Traditionally they have tested mosquito larva, sending out health officers to homes to find larvae and bring them back for testing, but since 2017–2018 they have used a Gravitrap surveillance system (Ong et al., 2021). The Gravitrap has a sticky lining that immobilizes mosquitoes that are then removed by health officers for laboratory testing. There are currently 70,000 such traps distributed around Singapore’s 700 square kilometers. Since 90 percent of the residents live in high-rise apartments, traps are placed on lower floors, middle floors, and upper floors in order to get a full understanding of the distribution of the mosquitoes. It traps both Aedes aegypti, the usual carrier of dengue, and Aedes albopictus, a recently emerged vector for dengue. Analyses done on these data indicate the threshold for dengue transmission is about five infected Aedes aegypti mosquitoes caught per 100 traps. When the number does go above a high-risk threshold, the department posts warnings on its website and with banners around the area to caution the public of exposure to mosquitoes.
In some cases, the mosquitoes caught in the traps are tested for the presence of specific pathogens, such as the Zika virus. The species of mosquito is also reported from these tests to help inform preventive efforts. The National Environment Agency combines the data it gets from clinics and mosquito traps with a variety of other relevant data—population demographics, temperature, humidity, vegetation index, the age of buildings, and the number of units in buildings—and puts them into a temporal model that predicts the likelihood of outbreaks (Shi et al., 2016). The model did a good job of predicting a dengue outbreak in 2013, Ng said, but it predicted an outbreak in 2016 that did not materialize. In retrospection, this miss was likely due to the unusually high heat from El Niño that year. A prediction of an outbreak in 2022 was borne out, although it arrived several weeks earlier than predicted. On a more granular scale, the data are put into a random forest algorithm to predict which areas in Singapore are at the highest risk (Ong et al., 2018). Those predictions have proven to be quite accurate as well, Ng said; for instance, nearly 90 percent of large clusters (10 cases or more) occurred in areas that had been identified as high risk in the model.
In addition to predicting outbreaks and knowing where to allocate resources, Ng described how the surveillance tools developed by the National Environment Agency help in evaluating the effectiveness of their control measures and in estimating the economic impact of those measures. The control measures can calculate how much money is saved in health care costs and to what extent human productivity and efforts are conserved, which provides an economic justification of the funds spent on surveillance and prevention.
DIAGNOSTICS FOR ARBOVIRUS MITIGATION
Boeras spoke about how diagnostics can be used for arbovirus mitigation, what effective diagnostic tools are available, and how widely they can be deployed. She began by discussing what has been achieved and what still needs more attention in the three different ways that diagnostics are used: to prepare for an epidemic, to prevent an epidemic, and to respond to an epidemic.
In the case of preparing for an epidemic, she said, what has already been done includes carrying out landscape reviews of what is available and what is in the pipeline, determining target product profiles, and evaluating diagnostic tests through networks of expert laboratories. What is still lacking, she said, is the creation of a framework for specimen and data sharing, the promotion of local manufacturing to improve access to tests, and the education of care providers and communities to raise awareness of these various issues. With regard to the prevention, there has been significant accomplishments in the development of diagnostics for early and rapid case detections and also diagnostics to support deployment of transmission prevention measures. On the other hand, Boeras said, there is still insufficient investment in real-time surveillance, particularly for diagnostics with connectivity functions that could allow for better, real-time use of surveillance data. Finally, in terms of diagnostics for response, Boeras pointed out that current tools can already be used to carry out rapid assessments of the extent of outbreaks and genomic sequencing when diagnostic testing is available. Areas where more work is needed include the stockpiling of diagnostics equipment and material, engaging with the community and raising awareness, and aligning use of diagnostics with vaccine research and development, she said.
Boeras offered some background details on how the diagnosis of a viral disease such as dengue is carried out. With primary infection, the virus enters the bloodstream (viraemia), triggering the production of the antibodies immunoglobulin M (IgM) and immunoglobulin G (IgG). If this is a secondary infection, the level of IgG will increase sharply from an already elevated level, while IgM will only have a small increase from the
near-baseline level after the end of the primary infection. In 2010, Boeras said, Peeling and colleagues examined this pattern to understand how it translates into diagnostics, particularly for patient management and disease surveillance. A variety of diagnostic tools are available for clinicians to confirm infection during the acute phase: virus isolation, nucleic acid detection, antigen detection, and, in some cases, it is possible to look for IgM seroconversion and an approximately fourfold rise in IgG titers (i.e., the IgG concentration). Boeras noted the benefit of serology testing in public health surveillance, where a population baseline of IgM can be established so that an increased number of IgM-positive individuals or higher IgM titers could indicate a potential outbreak. Confirmation of the outbreak could be done by using reverse transcription polymerase chain reaction (RT-PCR) to look for viral messenger RNA (mRNA).
However, there remain challenges in carrying out serological diagnostics of emerging arboviruses, Boeras remarked. A 2021 review examined the performance of readily available, commonly used commercial antibody and antigen tests and identified five categories of challenges (Fischer et al., 2021). The first is the inherent limitation(s) from how the intrinsic properties of different test formats limit their performance, such as the differences in sensitivity or specificity between an enzyme-linked immunosorbent assay (ELISA) and a rapid diagnostic test. A second challenge is that the timing of a serological test is crucial—exactly when a patient presents symptoms can significantly affect test results. Third, individual infection histories can also affect diagnostic test performance, and a major issue is referred to as “original antigenic sin”; this is when the patient may react to a new infection when they were previously exposed to a closely related antigen by mounting a response to the first antigen rather than the new antigen (Vatti et al., 2017). “So for example,” Boeras explained, “if your first infection with a flavivirus is dengue, and then you got infected with Zika, your antibody response would still be higher for dengue than for Zika.” In that case, the only way to correctly diagnose the Zika infection would be with RT-PCR. One problem, she continued, is that most pregnant women in resource-limited settings tend to delay seeking medical care and the window for PCR positivity may pass before they visit a clinic, thus making it very difficult to diagnose a Zika infection. This is a major problem because of the effects that Zika can have on a fetus. A fourth challenge is the global mixing of antigenically related viruses. Since dengue, Zika, and chikungunya may all be circulating in a population at the same time, it can be difficult to know what virus or viruses a person who tests positive was exposed to. The final challenges are polyclonal B cell activation and environmental factors.
Returning to the challenge posed by the different performances of different tests, Boeras highlighted that these serological tests show a broad range of sensitivities and specificities. For example, the IgM ELISA test for
chikungunya has reasonable sensitivity and high specificity, but the IgM rapid diagnostic test (RDT) for chikungunya has extremely low sensitivity. The IgM RDT for dengue and the IgM ELISA test for Zika both have a high median specificity, but the range of specificity values from different studies is very large, indicating that cross reactivity between the two viruses may be a problem. This situation is complicated by the fact that the sensitivities of the different tests vary over time, and they do not always vary in the same way, Boeras said.
Using different tests together in reaching a diagnosis may be one way to address these challenges, Boeras suggested. A 2016 study by Hunsperger and colleagues used paired serum samples from 1,234 laboratory-confirmed dengue patients to show that over 90 percent of the primary and secondary dengue cases were accurately identified by using either IgM ELISA with RT-PCR or IgM ELISA with the NS1 antigen ELISA. Boeras also described recent work to develop effective diagnostic tests for Zika. As part of this effort, and in response to the Zika outbreak, UNICEF and the U.S. Agency for International Development established an advanced purchase commitment mechanism aimed at incentivizing companies to develop assays that were more accurate and accessible, with a specific focus on serological rapid diagnostic tests. Once a test was validated, UNICEF was committed to procuring millions of them for countries to use as part of arbovirus surveillance programs.
Boeras’s group was involved in evaluating the tests submitted to this program, and she described the multisite approach they used. They conducted quick pass or fail assessments on three RDTs, two of which had satisfactory performance to progress to full lab-based evaluations (Boeras et al., 2022). Then in conjunction with partners, such as the Institute Pasteur Dakar in Senegal, these assays were evaluated for feasibility in the field. There were nine testing facilities in two regions, one with the highest known Zika transmission rates in Senegal and another with one of the lowest. A key feature to the program, Boeras said, was that the researchers engaged the community, including leaders and health authorities. Health care workers who participated in this evaluation program received trainings over 2–3 days and reported back on their user experience, revealing insights such as that RDTs were especially useful for screening of pregnant women because they can be used at remote sites, Boeras said. Most of the health care workers agreed to integrate the RDTs into routine services for pregnant women. For surveillance, the workers preferred to use multiplex panels that would test for Zika as well as for chikungunya, dengue, and yellow fever, but they concluded that the single test was better suited for the point-of-care diagnosis at district-level health centers where pregnant women were presenting.
In summary, Boeras shared that dengue diagnostics are now on the WHO list of essential diagnostics but there are opportunities for continued
improvement. While RDTs exist for point-of-care diagnosis, “we are still looking at external quality assurance programs for these,” she said. There is ongoing work to develop multiplex tests for patient management and surveillance, and to ensure existing multiplex tests are broadly affordable and accessible. More specific antigen or molecular detection tests are also needed to confirm Zika infection for use in patient management at the point of care. Ongoing research and development can be directed toward creating more rapid but less expensive multiplex molecular tests that can distinguish among febrile illnesses caused by the dengue, chikungunya, and Zika viruses, Boeras said. There is also a need for more specific and high-throughput antibody detection tests that can be used on a population basis for surveillance of arbovirus infection and for epidemiological studies. Finally, connectivity capabilities that can link data between diagnostic laboratories and point-of-care test devices could provide early warnings for infectious disease outbreaks as well as timely information for disease control and prevention programs, which in turn would increase the efficiency of health care systems and improve patient outcomes.
DISCUSSION
Speaking to Ng, Scott asked about key considerations for other regions that may want to set up a dengue control program similar to the one in Singapore. “Environment management is one of the most important things when it comes to vector control programs,” she answered. Singapore’s program not only focused on dengue control, but also included efforts to keep the city clean and to relocate residents from slum housing to high-rise apartments. These efforts worked together synergistically to first eliminate malaria (Singapore was declared malaria-free by WHO in 1989) and then to address Aedes aegypti and dengue. A second important factor, she added, is social mobilization. The Singapore government worked to get the community involved so that removing water containers become as much a part of life as brushing teeth. Cultivating such habits was crucial, Ng stressed.
Harris asked Ng about how residents are encouraged to pay attention to health alerts in Singapore. Public education will reach maybe 90 percent of the population, Ng replied, but there will still be 5 to 10 percent who are not as vigilant, and, unfortunately, the vector control of dengue is only as strong as the weakest link. “If you have a block of flats and you have one person breeding mosquitoes, the whole block is at risk.” Singapore has a system of civil penalties to address this gap in societal vigilance. Health officers will conduct home visits to check for potential mosquito breeding sites, and a person who is found with active mosquito breeding in their home will be fined.
One attendee asked Rojas about the dashboard she had described in her talk. Noting that the quality of the dashboard will depend on the
quality of the data provided at the local level, where it has always been a struggle to get high-quality data, she asked what role WHO or other large multinational organizations play in the development of easy-to-use tools that could be used on the ground. WHO has been working with its regional offices to figure out which tools are needed by different countries and to determine the best ways to report the data and the analyses, Rojas said. “We’re a little bit behind with some of the regions, such as the African region, because right now they are starting to see arboviruses as a threat,” she said. Malaria was the biggest arboviral threat in the African region, but efforts to tackle this have paid off and malaria cases have been declining, while non-malaria arboviral disease cases are going up. “And now, with the capacities that were built for COVID, they are realizing that they have more arbovirus transmission than what they thought they had. So, with them we are now going to create a parallel surveillance system.” WHO will try to include arboviruses in the DHIS2, a tool for reporting malaria and other diseases, which has been used in Africa as well as in the western Pacific and the Caribbean. Rojas concluded, “we’ve been working with the regions at trying to address, at the local level where the data is generated, which is the best tool to gather the data on arboviruses.” The goal is to build a surveillance system that can provide data not just on malaria or HIV but also on all infectious diseases, including arboviral diseases. In addition, Rojas agreed with another attendee’s comment that malaria or arboviral disease funding should not be framed as opposing each other another. “What we need to do is to put arboviral diseases into the top level of discussion, as PAHO has done it with all the resolutions throughout the years,” she said, “and do a similar exercise with the other countries, even bringing it to the World Health Assembly to have the political commitment to have continuous funding.”
Asked about communicating genomic surveillance, Faria mentioned the numerous training workshops he hosted that were attended by PAHO and Brazilian Ministry of Health colleagues. Faria said that he tried to always bring stakeholders to the workshops, so that the students he mentored could see what was expected from the genomic data from the stakeholders’ perspective. “I think that involvement with the stakeholders is really important because it also allows us to target a little bit more the questions that we need to address.”
REFERENCES
Aik, J., Z. W. Neo, J. Rajarethinam, K. Chio, W. M. Lam, and L.-C. Ng. 2019. The effectiveness of inspections on reported mosquito larval habitats in households: A case–control study. PLOS Neglected Tropical Diseases 13(6):e0007492.
Boeras, D., C. T. Diagne, J. L. Pelegrino, M. Grandadam, V. Duong, P. Dussart, P. Brey, D. Ruiz, M. Adati, A. Wilder-Smith, A. K. Falconar, C. M. Romero, M. Guzman, N. Hasanin, A. Sall, and R. W. Peeling. 2022. Evaluation of Zika rapid tests as aids for clinical diagnosis and epidemic preparedness. eClinicalMedicine 49:101478.
Faria, N. R., J. Quick, I.M. Claro, J. Thézé, J. G. de Jesus, M. Giovanetti, M. U. G. Kraemer, S. C. Hill, A. Black, A. C. da Costa, L. C. Franco, S. P. Silva, C.-H. Wu, J. Raghwani, S. Cauchemez, L. du Plessis, M. P. Verotti, W. K. de Oliveira, E. H. Carmo, G. E. Coelho, A. C. F. S. Santelli, L. C. Vinhal, C. M. Henriques, J. T. Simpson, M. Loose, K. G. Andersen, N. D. Grubaugh, S. Somasekar, C. Y. Chiu, J. E. Muñoz-Medina, C. R. GonzalezBonilla, C. F. Arias, L. L. Lewis-Ximenez, S. A. Baylis, A. O. Chieppe, S. F. Aguiar, C. A. Fernandes, P. S. Lemos, B. L. S. Nascimento, H. A. O. Monteiro, I. C. Siqueira, M. G. de Queiroz, T. R. de Souza, J. F. Bezerra, M. R. Lemos, G. F. Pereira, D. Loudal, L. C. Moura, R. Dhalia, R. F. França, T. Magalhães, E. T. Marques Jr, T. Jaenisch, G. L. Wallau, M. C. de Lima, V. Nascimento, E. M. de Cerqueira, M. M. de Lima, D. L. Mascarenhas, J. P. Moura Neto, A. S. Levin, T. R. Tozetto-Mendoza, S. N. Fonseca, M. C. Mendes-Correa, F. P. Milagres, A. Segurado, E. C. Holmes, A. Rambaut, T. Bedford, M. R. T. Nunes, E. C. Sabino, L. C. J. Alcantara, N. J. Loman, and O. G. Pybus. 2017. Establishment and cryptic transmission of Zika virus in Brazil and the Americas. Nature 546:406–410.
Faria, N. R., M. U. G. Kraemer, S. C. Hill, J. Goes de Jesus, R. S. Aguiar, F. C. M. Iani, J. Xavier, J. Quick, L. du Plessis, S. Dellicour, J. Thézé, R. D. O. Carvalho, G. Baele, C.-H. Wu, P. P. Silveira, M. B. Arruda, M. A. Pereira, G. C. Pereira, J. Lourenço, U. Obolski, L. Abade, T. I. Vasylyeva, M. Giovanetti, D. Yi, D. J. Weiss, G. R. W. Wint, F. M. Shearer, S. Funk, B. Nikolay, V. Fonseca, T.E.R. Adelino, M. A. A. Oliveira, M. V. F. Silva, L. Sacchetto, P. O. Figueiredo, I. M. Rezende, E.M. Mello, R.F.C. Said, D.A. Santos, M. L. Ferraz, M. G. Brito, L. F. Santana, M. T. Menezes, R. M. Brindeiro, A. Tanuri, F.C.P. dos Santos, M. S. Cunha, J. S. Nogueira, I. M. Rocco, A. C. da Costa, S. C. V. Komninakis, V. Azevedo, A. O. Chieppe, E. S. M. Araujo, M. C. L. Mendonça, C. C. dos Santos, C. D. dos Santos, A. M. Mares-Guia, R. M. R. Nogueira, P. C. Sequeira, R. G. Abreu, M. H. O. Garcia, A. L. Abreu, O. Okumoto, E. G. Kroon, C. F. C. de Albuquerque, K. Lewandowski, S. T. Pullan, M. Carroll, T. de Oliveira, E. C. Sabino, R. P. Souza, M. A. Suchard, P. Lemey, G. S. Trindade, B. P. Drumond, A. M. B. Filippis, N. J. Loman, S. Cauchemez, L. C. J. Alcantara, and O. G. Pybus. 2018. Genomic and epidemiological monitoring of yellow fever virus transmission potential. Science 361(6405):894–899. https://doi.org/10.1126/science.aat7115
Fischer, C., W. K. Jo, V. Haage, A. Moreira-Soto, E. F. de Oliveira Filho, and J. F. Drexler. 2021. Challenges towards serologic diagnostics of emerging arboviruses. Clinical Microbiology and Infection 27(9):1221–1229.
Grubaugh, N. D. J. T. Ladner, M. U. G. Kraemer, G. Dudas, A. L. Tan, K. Gangavarapu, M. R. Wiley, S. White, J. Thézé, D. M. Magnani, K. Prieto, D. Reyes, A. M. Bingham, L. M. Paul, R. Robles-Sikisaka, G. Oliveira, D. Pronty, C. M. Barcellona, H. C. Metsky, M. L. Baniecki, K. G. Barnes, B. Chak, C. A. Freije, A. Gladden-Young, A. Gnirke, C. Luo, B. MacInnis, C. B. Matranga, D. J. Park, J. Qu, S. F. Schaffner, C. Tomkins-Tinch, K. L. West, S. M. Winnicki, S. Wohl, N. L. Yozwiak, J. Quick, J. R. Fauver, K. Khan, S. E. Brent, R. C. Reiner Jr., P. N. Lichtenberger, M. J. Ricciardi, V. K. Bailey, D. I. Watkins, M. R. Cone, E. W. Kopp IV, K. N. Hogan, A. C. Cannons, R. Jean, A. J. Monaghan, R. F. Garry, N. J. Loman, N. R. Faria, M. C. Porcelli, C. Vasquez, E. R. Nagle, D. A. T. Cummings, D. Stanek, A. Rambaut, M. Sanchez-Lockhart, P. C. Sabeti, L. D. Gillis, S. F. Michael, T. Bedford, O. G. Pybus, S. Isern, G. Palacios, and K. G. Andersen. 2017. Genomic epidemiology reveals multiple introductions of Zika virus into the United States. Nature 546:401–405.
Hill, S. C., J. Vasconcelos, Z. Neto, D. Jandondo, L. Zé-Zé, R. S. Aguiar, J. Xavier, J. Thézé, M. Mirandela, A. L. Micolo Cândido, F. Vaz, C. d. S. Sebastião, C.-H. Wu, M. U. G. Kraemer, A. Melo, B. L. F. Schamber-Reis, G. S. de Azevedo, A. Tanuri, L. M. Higa, C. Clemente, S. P. da Silva, D. da Silva Candido, I. M. Claro, D. Quibuco, C. Domingos, B. Pocongo, A. G. Watts, K. Khan, L. C. J. Alcantara, E. C. Sabino, E. Lackritz, O. G. Pybus, M.-J. Alves, J. Afonso, and N. R. Faria. 2019. Emergence of the Asian lineage of Zika virus in Angola: an outbreak investigation. The Lancet Infectious Diseases 19(10): 1138–1147. https://doi.org/10.1016/S1473-3099(19)30293-2
Ho, S. H., J. T. Lim, J. Ong, H. C. Hapuarachchi, S. Sim, and L.-C. Ng. 2023. Singapore’s 5 decades of dengue prevention and control—Implications for global dengue control. PLOS Neglected Tropical Diseases 17(6):e001140.
Hunsperger, E. A., J. Muñoz-Jordán, M. Beltran, C. Colón, J. Carrión, J. Vazquez, L. N. Acosta, J. F. Medina-Izquierdo, K. Horiuchi, B. J. Biggerstaff, and H. S. Margolis. 2016. Performance of dengue diagnostic tests in a single-specimen diagnostic algorithm. Journal of Infectious Diseases 214(6):836–844.
Ng, L.-C., L. K. Tan, C. H. Tan, S. S. Tan, H. C. Hapuarachchi, K. Y. Pok, Y. L. Lai, S. G. Lam-Phua, G. Bucht, R. T. Lin, Y. S. Leo, B. H. Tan, H. K. Han, P. L. Ooi, L. James, and S. P. Khoo. 2009. Entomologic and virologic investigation of chikungunya, Singapore. Emerging Infectious Diseases 15(8):1243–1249.
Ong, J., X. Liu, J. Rajarethinam, S. Y. Kok, S. Liang, C. S. Tang, A. R. Cook, L.-C. Ng, and G. Yap. 2018. Mapping dengue risk in Singapore using random forest. PLOS Neglected Tropical Diseases 12(6):e0006587.
Ong, J., J. Aik, and L.-C. Ng. 2021. Short report: Adult Aedes abundance and risk of dengue transmission. PLOS Neglected Tropical Diseases 15(6):e0009475.
Peeling, R. W., H. Artsob, J. L. Pelegrino, P. Buchy, M. J. Cardosa, S. Devi, D. A. Enria, J. Farrar, D. F. Gubler, M. G. Guzman, S. B. Halstead, E. Hunsperger, S. Kliks, H. S. Margolis, C. M. Nathanson, V. C. Nguyen, N. Rizzo, S. Vázquez, and S. Yoksan. 2010. Evaluation of diagnostic tests: Dengue. Nature Reviews Microbiology 8(12 Suppl):S30–S38.
Rajarethinam, J., L. W. Ang, J. Ong, J. Ycasas, H. C. Hapuarachchi, G. Yap, C. S. Chong, Y. L. Lai, J. Cutter, D. Ho, V. Lee, and L.-C. Ng. 2018. Dengue in Singapore from 2004 to 2016: Cyclical epidemic patterns dominated by serotypes 1 and 2. American Journal of Tropical Medicine and Hygiene 99(1):204–210.
Sayers, E. W., M. Cavanaugh, K. Clark, K. D. Pruitt, S. T. Sherry, L. Yankie, and I. Karsch-Mizrachi. 2023. GenBank 2023 update. Nucleic Acids Research 51(D1):D141–D144. https://doi.org/10.1093/nar/gkac1012.
Shi, Y., X. Liu, S. Y. Kok, J. Rajarethinam, S. Liang, G. Yap, C. S. Chong, K. S. Lee, S. S. Tan, C. K. Chin, A. Lo, W. Kong, L.-C. Ng, and A. R. Cook. 2016. Three-month teal-time dengue forecast models: An early warning system for outbreak alerts and policy decision support in Singapore. Environmental Health Perspectives 124(9):1369–1375.
Sim, S., L.-C. Ng., S. W. Lindsay, and A. L. Wilson. 2020. A greener vision for vector control: The example of the Singapore dengue control programme. PLOS Neglected Tropical Diseases 14(8):e0008428.
Vatti, A., D. M. Monsalve, Y. Pacheco, C. Chang, J. M. Anaya, and M. E. Gershwin. 2017. Original antigenic sin: A comprehensive review. Journal of Autoimmunolgy 83:12–21.


