Measuring Biodiversity for Addressing the Global Biodiversity Crisis: Summary of the 2025 US-UK Scientific Forum (2025)
Chapter: 1 Introduction
1 Introduction
The diversity of life on Earth is under threat, but understanding this threat and the actions needed to address the ongoing biodiversity crisis requires measuring biodiversity accurately and reproducibly. Assessing biodiversity faces multiple challenges, mainly because of the great complexity of natural systems, but also a lack of standardized approaches to measurement, a plethora of measurement technologies with their own strengths and weaknesses, and different data needs depending on the purpose for which the information is being gathered.
The US-UK Scientific Forum on Measuring Biodiversity for Addressing the Global Biodiversity Crisis, held in Washington, DC, on May 21–22, 2025, aimed to build momentum toward standardizing methods for using environmental monitoring technologies to assess biodiversity and ensure interoperability between different outputs. Doing so would go far toward increasing confidence that observed changes in biodiversity resulted from real changes in what is being measured. It would also advance integrating biodiversity monitoring with evaluation to help ensure that conservation at a variety of scales can be more effective.
WHAT IS BIODIVERSITY?
According to Article 2 of the 1992 Convention on Biological Diversity, biodiversity means “the variability among living organisms from all sources including, inter alia, terrestrial, marine and other aquatic ecosystems and the ecological complexes of which they are part; this includes diversity within species, between species and of ecosystems.” Biodiversity includes both the species in an ecosystem and the ecological links between them, as well as the composition, structure, and function of the landscape, the community or ecosystem, the population, and genetics (see Figure 1-1).
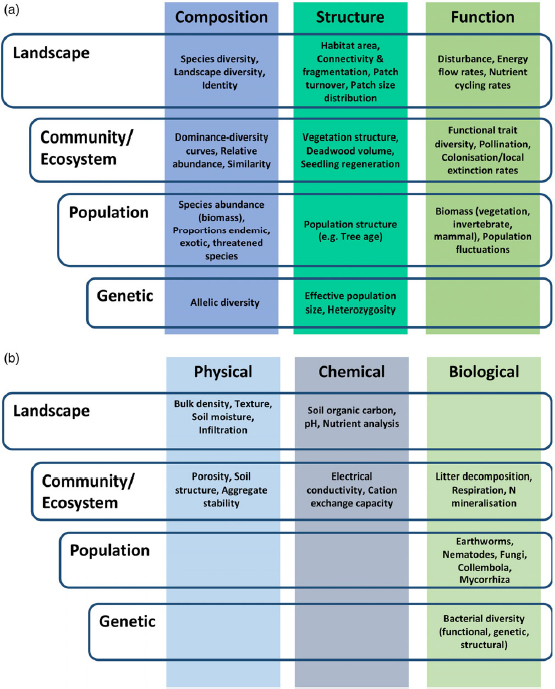
Sources of variation at different levels of ecosystem organization.
SOURCE: Warner, E., L.M. Giuliani, G.A. Campbell, P. Smith, N. Seddon, D. Seddon, and A.C. Smith. 2025. Integrated above- and below-ground ecological monitoring for nature-based solutions. Ecological Solutions and Evidence 6:e70043. https://doi.org/10.1002/26888319.70043. CC BY 4.0.
One challenge to measuring biodiversity is its uneven distribution around the world, said Andy Purvis, research leader at the Natural History Museum in London and research investigator at Imperial College London. Another is that different perspectives on nature influence the choice of biodiversity facets on which to focus. A utilitarian perspective considers how society depends on nature and is embedded in it, while a cultural perspective considers people embedded and enmeshed in ecological systems. A person-free perspective treats nature as having intrinsic value of its own without regard for humans. Taking the latter perspective, for example, might focus on avoiding loss of species and on areas with the richest biodiversity, while a utilitarian perspective might focus on “average ecosystem health,” traded biodiversity, and on areas producing benefits that are hard to replace.
Each perspective has its own set of what needs to be measured in terms of what the entities to measure are, what they look like, and what they do. Adding to the complexity is the fact that there is no single way of measuring these variables. Purvis noted that an international team of investigators has proposed six classes of essential biodiversity variables as a means of connecting raw observations and indicators, similar to the Essential Climate Variable framework that accelerated interoperability in climate science. The six classes are genetic composition, species populations,
species traits, community composition, ecosystem structure, and ecosystem function. Although this framework may prove useful, it does not address the problem that there are many ways of measuring each variable class and that the measurements themselves may depend on the time frame over which they are collected.
In closing, Purvis summarized the challenge confronting measurement of biodiversity by stating, “Biodiversity is a concept that does not lend itself to a single number. People want a single number, and I do not think we should give it to them,” said Purvis, adding that “We do not all mean exactly the same thing by ‘biodiversity,’ and that is okay.”
WHO NEEDS TO USE BIODIVERSITY MEASUREMENTS?
When considering who needs to use biodiversity measurements and how to make them most effective, it is important to consider the user’s relationship with nature, one’s values, and how the measures might affect a user’s emotions, said María Cecilia Londoño Murcia, scientific information manager at the Alexander von Humboldt Institute in Colombia. As an example, she cited the case of the hippopotamus as an invasive species in Colombia. While ecologists and biologists agree that hippos do not belong in Colombia, there are people who benefit from them, including those who depend on tourism for a living as well as the people making money trafficking this species. In addition, the animalism movement is not in agreement on how to use measurements to control this population.
In 2010, the Colombian government began mapping the country’s Páramo ecosystems, which are high-altitude, neotropical ecosystems. This activity produced good information on where the Páramos were and on species composition and distribution, but the project became complicated when trying to identify high- and low-impact activities, as well as how to determine the transition zone and where a given Páramo ended. “How to take and use the measurements in complex decisions is really tough,” said Murcia.
Murcia noted that Colombia’s biodiversity monitoring systems rely on partnerships with international networks to access the best technology available for genomic and functional data and to establish the best standards for its systems. At the same time, Colombia has implemented seven key national principles—open access, trust, participation, attribution, collaboration, responsibility, and transparency—that have helped make the users of these data feel they are part of the system and trust the data it generates. This was the case when measuring the distribution of hippos, where the project involved members of the academic research community in curating the data and validating the resulting models.
When Murcia and her colleagues designed a dashboard of biodiversity indicators, it focused on delivering the best available data to the national and subnational governments. However, the
academic community wanted more data available through the dashboard, so her team created a two-tiered dashboard that would be useful to the two different types of users. The dashboard aimed at government authorities, for example, provides maps with colors and graphs of trends along with descriptions and information on the limits of the data. Her team is now working to add information that would be useful for local communities, a slow process that requires building trust with the community and understanding the questions the community wants answered.
Sallie Bailey, chief scientist at Natural England—the UK government’s advisor on the natural environment and the nature regulator with a wide range of statutory duties and powers—explained that her organization is looking at how it aligns what it is measuring in the United Kingdom with global biodiversity framework indicators. It is doing this as part of its mandate to provide information relevant for international agreements and the United Kingdom’s obligations to the European Union, as well as to provide information regarding national statutory targets and local nature recovery strategies. Natural England is also collecting evidence to evaluate and maximize the effectiveness of interventions and action aimed at protecting various sites on land and at sea, managing agricultural and environmental schemes, and assessing net gains in biodiversity.
Bailey noted that Natural England’s new biodiversity net gain measurement, which has been “well and truly scrutinized,” requires developers to provide at least 110 percent of the biodiversity value found on a site before development. It has been adapted for use across the world, and the Institute of Environmental Sciences’ Environmental Policy Implementation Community is advocating strongly for it to become the standard global metric for biodiversity offsets and credits.
Aside from their use for regulatory purposes, biodiversity measures are important for understanding long-term change in the environment and the risk to natural capital. Much of the work her organization is engaged in is part of a broad approach called the National Capital and Ecosystem Assessment that aims to increase spatial scale of data on species distribution and biodiversity; provide reliable data for estimating carbon stocks in soils, peatlands, trees, and marine habitats; conduct ecosystem assessment in inland and coastal waters, marine environment, and land including soil ecosystems; draw together existing data streams, including those from UK Research & Innovation and the UK Hydrographic Office; and provide tools such as datasets, indicators of environmental status, and models to understand how humans affect nature both positively and negatively. The goal is to use these data to enable economic growth in harmony with nature.
The State of Natural Capital Report for England 2024: Risks to Nature and Why It Matters1 provides the first comprehensive assessment of the state of ecosystem assets in England, addresses why they are important, and identifies what is affecting them. It assesses the risk to England’s natural capital and the benefits it provides and interprets this risk for decision makers regarding policy areas such as economic resilience, climate adaptation, food and water security, and health and well-being. The report also identifies priorities for mitigating the risks. Bailey added that the report
___________________
1Lusardi, J., P. Rice, J. Craven, C. Hinson, F. Bell, A. Morgan, K. Martin, M. Dobson, T. Sunderland, and R. Waters. 2024. State of Natural Capital Report for England 2024: Risks to Nature and Why It Matters. Natural England Research Report Number NERR137. York, United Kingdom. https://publications.naturalengland.org.uk/file/5465017590480896.
shifts the discussion from species and habitats to a landscape-level, systems-based approach to protecting nature and biodiversity.
To inform policy and decision making that moves away from ecosystem restoration and instead focuses on maintaining ecosystem integrity and function, biodiversity measures need to move beyond encompassing traditional measures of biodiversity. One project, for example, used AI, remote sensing, and field studies to identify the role of sand eels as a key regulator of ecosystem structure and function beyond their commercial importance for producing fish meal. This work led to an international tribunal ruling that measures the United Kingdom took to close English waters of the North Sea to industrial sand eel fishing were based on the best available science and had sufficient regard for the principle of nondiscrimination. Another project used a variety of measurements to create a new baseline for England’s peat resources that will be used to target peatland restoration, improve the greenhouse gas inventory report for peatlands, and develop site protection strategies.
A third project used drones to survey grey seal populations along UK coasts to minimize the risk to the seals in their critical breeding grounds. An AI deep learning model then classified whitecoat seal pups and older seals, providing an accurate population estimate, including in areas that are either not visible or accessible from shore.
Bailey noted that new technologies, such as environmental DNA, acoustic and other autonomous survey methods, and AI, provide great opportunities and challenges going forward. So far, these new technologies are being used for bespoke needs and projects, generating vast quantities of data, but are raising questions about interoperability for other applications. In addition, given the rapid development of these new technologies, it can be difficult for regulators and government bodies to know what to invest in and how much confidence to have in the outputs. Standards and openness will be the key that allows users to assess the level of technological readiness and confidence, she said.
TURNING BIODIVERSITY DATA INTO GLOBAL ACTION AND IMPACT
“We have never had more data at our disposal to actually make some decisions,” said Cristián Samper, managing director and the leader for nature solutions at the Bezos Earth Fund. New tools, such as those enabling gene sequencing in the field and Earth-imaging satellites, are generating trillions of pieces of data, creating the challenge of turning those data into action and impact. That, in turn, requires focusing on the users of those data and understanding what they need, when they need it, and in what form they need it delivered to them. “If you do not have that clarity, you can be lost in this sea of information,” said Samper.
His organization is one of 14 working together to protect key biodiversity areas (KBAs), accounting for some 30 percent of the planet. The key issue here is determining which 30 percent. For example, the KBA partnership looked at three countries in the Congo Basin and four in the tropical Andes to identify important biodiversity areas that are currently protected and which key areas still need protecting. “What we are finding is that even countries that are already at 30 percent are not protecting the most important places,” said Samper. For example, Bolivia is already protecting 30 percent of its territory, but 48 percent of the country’s KBAs are not included in that 30 percent. The next step is to look at how these areas are or need to be connected and how they might be affected by climate change, for example.
Samper’s organization is working with the World Resources Institute to launch the Land & Carbon Lab, which will use satellite images to map all terrestrial and freshwater ecosystems at a resolution of at least 3 meters. The project’s goal is to track ecosystem changes, including restoration activities, and make the data available to anyone. Data from hyperspectral satellites, for example, will enable following the growth of individual trees planted as part of trillion tree initiatives, many of which, said Samper, are the wrong trees planted in the wrong places and are dying. Working with Meta AI, the Land & Carbon Lab has developed the world’s first global remote sensing dataset with a 1-meter resolution for identifying priority areas for restoration.
Citizen science can be a powerful source of biodiversity data, with the Cornell Lab of Ornithology’s eBird project being a good example. The eBird project, said Samper, has 1.9 billion records of bird sightings,2 providing the ability to generate data about movements and migrations of species, as well as population numbers, over time. For example, data on bobolinks, a grassland bird, found that population losses observed during their breeding season were tied to land use for food production.
BECOMING NATURE POSITIVE
Marco Lambertini, convener of the Nature Positive Initiative, said the 2022 Global Goal for Nature to halt and reverse biodiversity loss by 2030 is the most comprehensive and measurable agreement regarding biodiversity. “This is a goal that should inspire action at scale to deliver a bending of the curve of biodiversity loss,” he said. The challenge, he added, is to track changes and progress to drive action, accountability, and recognition for the efforts that different players are making to meet this goal. In his view, the urgent task at hand is to agree on the tools and methods that are already available and can be used in a standardized manner to drive action at scale and engage as many users as possible to achieve this nature-positive goal.
The Nature Positive Initiative’s approach is to focus on metrics describing the state of nature that can then inform enhanced responses that reduce the pressures on nature. Because it is impossible to measure all of the complexity of nature, the initiative is focusing on metrics related to the living
___________________
2On June 10, 2025, eBird announced it had passed 2 billion bird observations. See https://ebird.org/news/ebird-passes-2-billion-bird-observations (accessed July 15, 2025).
dimension of nature—species, ecosystems, and natural processes—rather than the nonliving elements such as water, air, and soil. Lambertini noted there are more than 600 metrics and indicators of biodiversity outcomes, leading to complexity, confusion, paralysis, and excuses for inaction.
To tackle the tension between complexity and simplicity, between credibility and practicality, and between usability, accessibility, and meaningful outcomes, the initiative has started a conversation with a broad constituency regarding the criteria that will define useful metrics that can drive action at scale by a large set of users who can help achieve nature-positive outcomes. This conversation is not designed to decide on the best, or most important, metrics but is about agreeing on a minimum set that strikes a balance between being practical, credible, and good enough to measure the state of nature and track changes toward nature-positive outcomes. Lambertini remarked that despite current political headwinds, corporate interest in this project was extraordinary, an important development given that fewer than 5 percent of the 500 largest companies measure and report on anything concerning biodiversity.
This activity agreed on four universal metrics that everybody should measure: ecosystem extent, site condition, landscape condition, and extinction risk. It also generated five case-specific indicators that specific situations will trigger (see Figure 1-2 and Table 1-1). In addition to the specific metrics, this
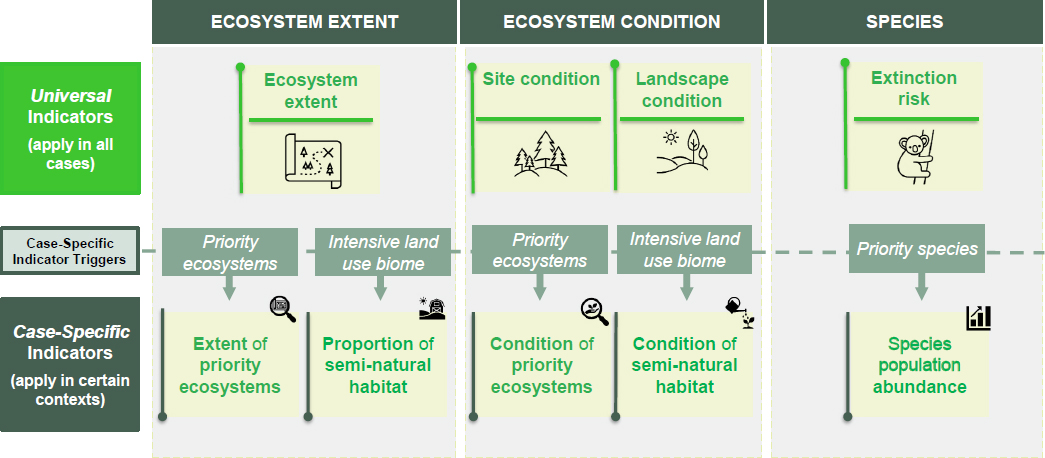
State of nature indicator framework.
NOTE: Draft universal indicators and metrics for measuring the state of nature and nature positive outcomes resulted from a consensus building process convened by the Nature Positive Initiative and currently are piloted and tested by companies ahead of their finalization at the end of 2025.
SOURCE: Lambertini presentation, May 21, 2025.
TABLE 1-1 Specific Metrics in the Nature Indicator Framework
| Indicators (IND) | Metrics | Granularity level | Case-specific metric triggers | |
|---|---|---|---|---|
| Ecosystem Extent | Ecosystem Extent & Classification (IND 1) | Area of loss, gain and net change in extent (ha) | Low, Medium, High | N/A |
| Extent of Priority Ecosystems (IND 1.1) | Area of loss, gain and net change in extent (ha)* | Medium, High | Priority ecosystem trigger criteria | |
| Proportion of natural or semi-natural habitat (IND 2) | Area of loss, gain and net change in average proportion of natural and semi-natural habitats within each km2 (%) | Low, Medium, High | Intensive land use biome trigger criteria | |
| Ecosystem Condition | Site Condition (IND 3) | Area and change since baseline by condition class (ha per condition class) | Low & Medium (provisional for piloting), High | N/A |
| Condition of Priority Ecosystems (IND 3.1) | Value and change since baseline by condition class (ha per condition class)* | Medium, High | Priority ecosystem trigger criteria | |
| Landscape Condition (IND 4) | Values and change in a) landscape intactness, b) structural connectivity, and c) functional connectivity | Low, Medium, High | N/A | |
| Condition of semi-natural habitat (IND 5) | Area and change since baseline of natural and semi-natural habitat by condition class (ha per condition class) | Medium, High | Intensive land use biome trigger criteria | |
| Species | Species Extinction Risk (IND 6) | Species extinction risk score and trend | Low, Medium, High | N/A |
| Species Population Abundance (IND 7) | Change in the number and proportion of priority species with: 1) stable or increasing populations, and 2) declining populations | Low, Medium, High | Priority species trigger criteria | |
| Key | Universal metric | *Case-specific metric is the same as the universal one but applied at a higher granularity level and only for areas meeting the trigger criteria | ||
| Case specific metric | ||||
SOURCE: Lambertini presentation, May 21, 2025.
activity also set the level of granularity needed to incentivize companies to start their journey toward a nature-positive strategy and outcomes. Currently, 40 companies from six sectors in 32 countries are testing these metrics and providing feedback as to whether the metrics are working. On an optimistic note, Lambertini said that despite political pushback, the companies engaging in the project want to find ways that will help them make meaningful, credible contributions to protecting and increasing biodiversity and to feel safe talking about the outcomes of their work.
In closing, Lambertini said work needs to progress on two parallel tracks. One is innovation and developing new approaches, technologies, and methodologies. The other is simplicity and practicality, because without creating a larger group of users of these metrics, this will be an exercise without meaningful outcomes.


