Measuring Biodiversity for Addressing the Global Biodiversity Crisis: Summary of the 2025 US-UK Scientific Forum (2025)
Chapter: 4 Interoperability of Biodiversity Measurements
4 Interoperability of Biodiversity Measurements
Efforts to monitor biodiversity use a multitude of approaches, generate heterogeneous data, and span spatial scales and levels of biological organization from microbial diversity assessed via eDNA to ecosystem scales using remote sensing. The challenge is to synthesize these heterogeneous data for a more comprehensive assessment of biodiversity and how it is changing through time. The forum’s third session focused on how to ensure that measurements of biodiversity, capturing different facets and using different methods, sometimes for different purposes, will be interoperable.
THE EARTH BIOGENOME PROJECT: ESTABLISHING AND PROMULGATING STANDARDS FOR BIODIVERSITY GENOMICS
Harris Lewin, research professor at Arizona State University and a distinguished professor emeritus of evolution and ecology at the University of California, Davis, explained that the Earth BioGenome Project (EBP), launched in 2018, is a confederated, international network-of-networks with the goal of sequencing and annotating the genomes of 1.8 million named species of eukaryotes in 10 years and building a digital repository of life. This repository will enable creating a digital foundation for interoperable biodiversity data available for all biodiversity research. He noted that 1.8 million species represent about 10 percent of the species on Earth and that the project will cost approximately $3.9 billion over 10 years.
Lewin noted that an executive council sets standards, establishes a solid governance structure for the project, and makes recommendations on policies and guidelines for things such as intellectual property. He added that EBP is committed to open access to data and compliance with the Convention on Biological Diversity and the Nagoya Protocol on Access and Benefit Sharing. It also has a committee dedicated to diversity, equity, and inclusion that involves Indigenous peoples and local communities. Project members have all agreed to put their assemblies into the International Nucleotide Sequencing Database Collaboration, with the sequences retrievable using EBP accession PRJNA533106.
As of May 7, 2025, projects affiliated with EBP have produced close to 4,000 genomes, with the number of chromosome-scale assemblies meeting initiative standards rising rapidly (see Figure 4-1). Lewin said the fact that the completed assemblies are meeting EBP standards means the affiliated projects are adopting and using those standards and that EBP did not create standards that nobody can use. He noted that other reference-quality genomes in the public domain are also meeting those standards even though they were not generated as part of EBP. “The standards are serving as a useful set of metrics for reference-quality genomes,” said Lewin.
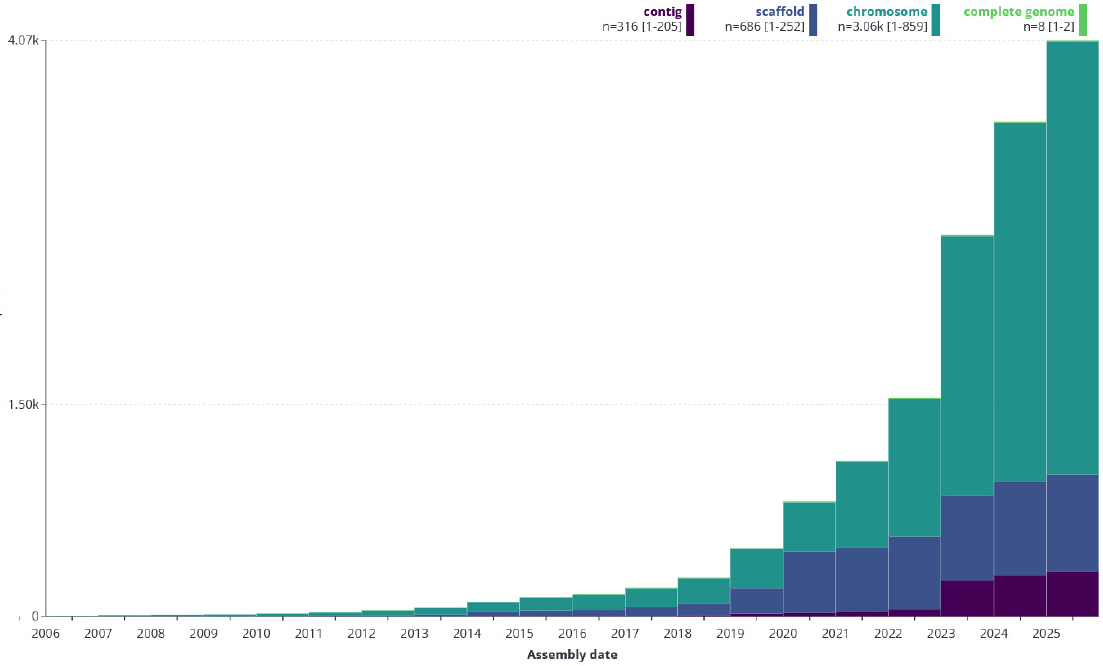
Year-over-year progress of the Earth BioGenome Project.
SOURCES: Lewin presentation, May 22, 2025. The Earth BioGenome Project at Arizona State University and the Earth Biogenome Project at the Wellcome Sanger Institute.
Contributions that EBP has made to biodiversity data integration include:
- Established standards for sample collection, DNA extraction, DNA sequencing, genome assembly, genome annotation, genome analysis, and information technology/informatics.1
- Standardized metadata and sample protocols that fit Darwin Core standards, with all scripts and programs available on GitHub, and protocols available at protocols.io.
- Created high-quality, chromosome-scale reference genomes as anchor points.
- Developed the Genomes-on-a-Tree database using National Center for Biotechnology Information taxonomy and other interoperable data sources.
- Adhered to Findable, Accessible, Interoperable, Reusable principles.
- Created standardized genome notes and now developing a no-cost universal genome note system that will be implemented by the end of 2025.
Lewin explained that annotated reference genomes enable cross-scale integration that enables linking genotype to phenotype, ecological traits, and other biodiversity measurements. They strengthen environmental DNA, metagenomics, and community composition studies; define evolutionary and conservation units; and support trait mapping, ecosystem-level studies, and identification of symbioses. They can also be used to train artificial intelligence (AI) models for a wide range of applications, such as gene finding, ortholog identification, extinction risk, and characterizing genotype-to-phenotype relationships.
In closing, Lewin noted that EBP holds lessons for other disciplines, such as how to establish a collaborative, global governance model; how to develop scale protocols that can be adopted across institutions; and that a robust, open-data ethos encourages data reuse and synthesis. An important message, he added, is that early coordination is important for long-term success. He then issued a call to action. “What we need as a community of biodiversity research is to foster multimodal biodiversity platforms; support technical infrastructure and community standards; build bridges across genomics, informatics, ecological monitoring, conservation, and policy; and empower the next generation of scientists with interoperable tools,” said Lewin.
BIODIVERSITY GENOMICS AT SCALE
Mark Blaxter, leader of the Darwin Tree of Life biodiversity genome program at the Wellcome Sanger Institute, said the program he leads aims to sequence all named eukaryotic species in Great Britain and Ireland. Though the approximately 72,000 eukaryotic species in Great Britain and Ireland are a small percentage of the total that EBP will sequence, they cover some 4,500 taxonomic families, which is a significant percentage of the approximately 9,500 taxonomic families on Earth.
___________________
1See www.earthbiogenome.org (accessed June 19, 2025).
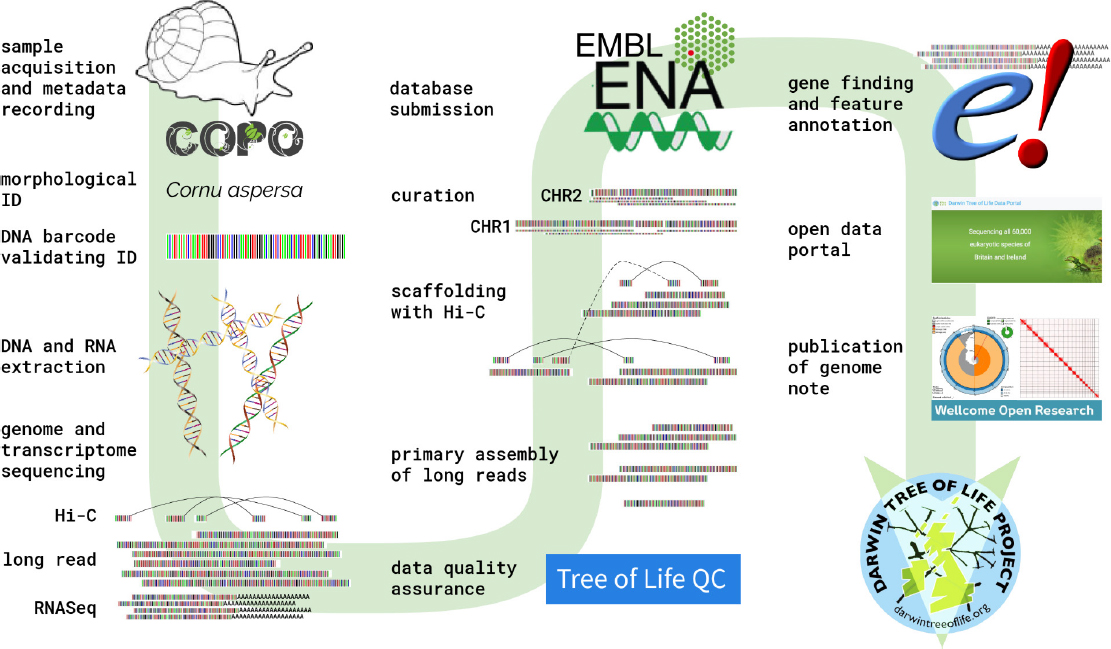
Example of the Darwin Tree of Life genome engine.
SOURCES: Blaxter presentation, May 22, 2025. Mark Blaxter for the Tree of Life programme at the Wellcome Sanger Institute. CC BY 4.0.
The project’s first goal, said Blaxter, is to sequence phylogenetic diversity. “It would have been easy to just sequence mammals, because we know how to sequence mammals and we knew we could do that at scale, but how do you sequence bees, jellyfish, trees, mosses, and protists?” he said. In one Tree of Life project, for example, researchers in Copenhagen are sequencing soil cores from ancient sediment dating back 1 million years. The idea is to identify alleles at loci from ecosystems that had different pathogen and climate pressures and that could be important to today’s agriculture and cropping systems.
To achieve its goal, the project developed what it calls a genome engine with standards it could promulgate across its partners (see Figure 4-2). Blaxter noted that the project had to develop special DNA extraction methods for many of the target taxa and manually curate assemblies because the programs designed for that task were designed to work on human genomes and they make human-specific errors that require checking.
The project has collected more than 10,000 species and had released nearly 2,600 assemblies as of May 2025 (see Figure 4-3). Blaxter noted that the released assemblies capture the totality of the genomes completely. Because the data capture the entire genome of a species, it allows for asking questions about patterns of gene family evolution across an ecosystem, for example, or patterns of evolution of chromosome change across an ecosystem.
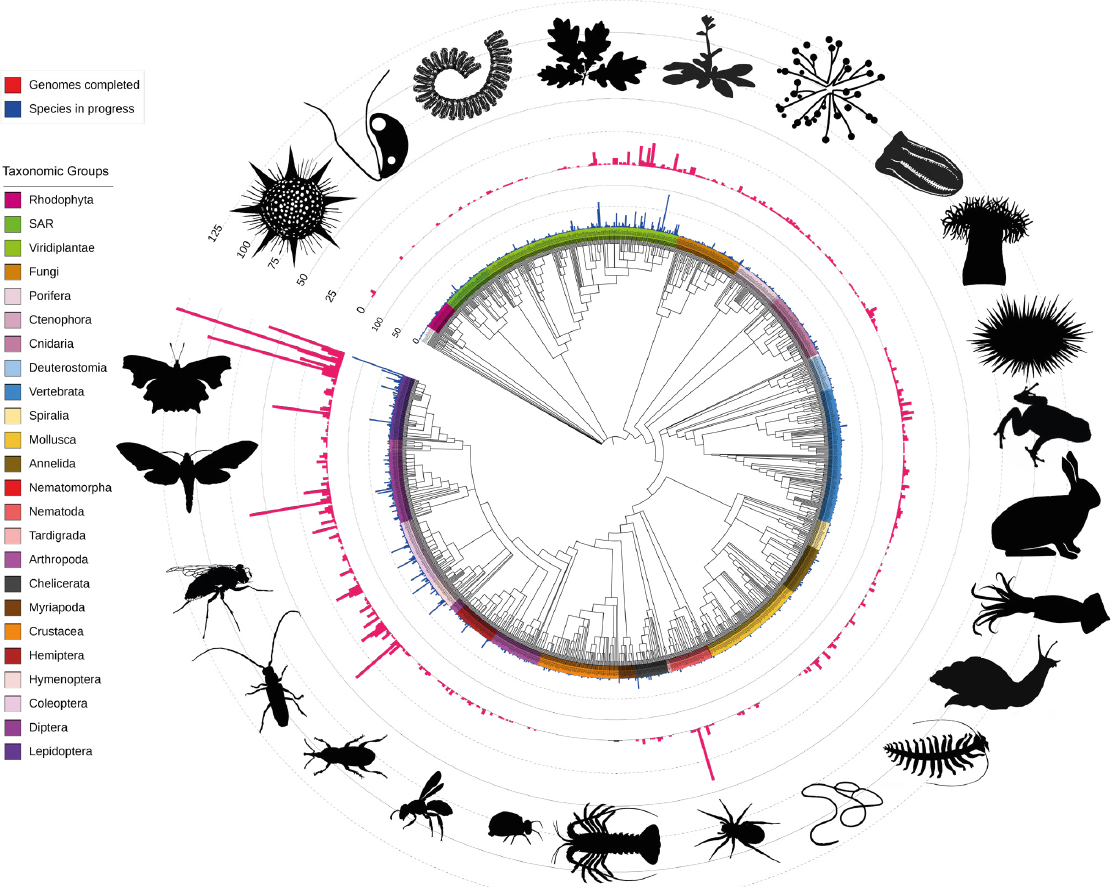
Genomes sequenced and in process by the Darwin Tree of Life project.
SOURCES: Blaxter presentation, May 22, 2025. Mark Blaxter for the Tree of Life programme at the Wellcome Sanger Institute. CC BY 4.0. The pictograms are from PhyloPic (phylopic.org). CC BY 4.0.
INTEROPERABILITY OF BIODIVERSITY MEASUREMENTS: WHAT METADATA ARE NEEDED AND HOW TO COLLECT THESE DATA?
Christina Grozinger, the Publius Vergilius Maro professor of entomology and the director of the Huck Institutes of the Life Sciences at Pennsylvania State University, discussed the factors that influence measurement, such as the limitations of specific collection and measurement methods. To address some of these limitations, she and her colleagues have developed nonlethal, AI-enabled monitoring systems. Also influencing measurements are sampling method details. One project, for example, involved analyzing the extensive, years-long dataset of citizen-captured firefly abundance in the eastern United States. Once the data were controlled for the time of year and how many minutes after sunset the data were collected, her team looked at other environmental factors driving firefly abundance, such as soil composition, land use, land cover, and light pollution.
In another project, her team used random forest models—machine learning based on statistical analyses—to evaluate seasonal variations in bee behavior given multiscale environmental factors. This study found that spring bees responded to factors within 1 kilometer, which were probably spring flowering trees, but summer bees were responding to factors within 100 meters. Grozinger said this was the opposite of what was predicted. Seasonal lag effects can also affect measurements, and data analysis using the same statistical methods found that prior-year weather was a major driver of bee abundance. There can also be indirect and community effects that influence measurements. Bee abundance, for example, is also affected by how well the plants they feed on are doing.
These complexities can create challenges for obtaining standardized metadata at the resolution needed for analysis and action, said Grozinger. To illustrate these challenges, she discussed examples from the Beescape Project, which aims to understand from both a scientific and managerial perspective the resources and risks that a bee experiences in the landscape. One way to collect such data is by doing surveys or deploying sensors. Her team assessed microclimate and microhabitat effects on bee visitation patterns in wild blueberry stands and fruit production using a few microsensors and machine learning. In another project, her team used large-scale datasets from the U.S. Department of Agriculture, U.S. Geological Survey, and U.S. Environmental Protection Agency to create a bee toxic load index for crop insecticides at 30-meter resolution across the United States. This index predicts how many bees will die if the bees are exposed to a specific quantity of pesticide.
Beescape provides a mapping interface that allows anyone to find their location, highlight an area of interest, and get information on land use, habitat quality scores, the economic value of pollination services, and weather from the current and previous years as well as the 10-year norm. It also provides information from the iNaturalist database on which flowering plants and pollinators are available at that moment. Grozinger said the goal is for Beescape to be useful for
nonscientists—beekeepers, growers, conservationists, and landscape architects—but she discovered that the scientific community has been using it, too. They have since added what she called the BeeShiny interface to be more useful to the research community.2
MULTIMODAL AI AND BIODIVERSITY DATA
Oisin Mac Aodha, reader in machine learning at the University of Edinburgh, said that three ingredients are responsible for the recent advances in AI: data, computing power, and algorithms. Data are a key component, as they are essential for both training and evaluating AI models. For biodiversity, the amazing growth of biodiversity data that researchers are sharing online has been a tremendous boon to the development of AI-powered models. For example, at the start of 2025, there were some 3 billion observations of species occurrence at a location in time in the Global Biodiversity Information Facility. These data are multimodal in that they contain information on taxonomic entity, location, and time, and include images and often other metadata such as courtship behavior.
Aodha has been working on two projects that aim to combine such multimodal data to enhance the ability of AI algorithms to help with biodiversity monitoring. One project involves species range mapping that takes 15 million pieces of observational data and additional metadata gleaned from text sources for more than 44,000 species and generates estimated range maps for multiple species simultaneously. This model can take a single observation plus text information and predict where a species might occur. Aodha and his team have been working with researchers at iNaturalist to integrate these models into their pipelines to automate identification of species. The goal is to develop range maps for some 100,000 species.
The goal of the second project is to create an AI-powered model that can search for specific images, such as an image of a California condor that is tagged and has a green 26 on its wing or an image of a hermit crab with plastic waste on its shell. Finding such a specific image today requires pouring through hundreds of millions of images manually. His team is putting together benchmark datasets that are representative of a diverse set of visual searches that ecologists, for example, might want to conduct. They will then quantify and measure the performance of vision language models on specific tasks.
In summary, Aodha said it is now possible to integrate different data types into multimodal AI models and enable new ways to use existing data sources. Evaluating these models is difficult and requires developing standardized assessment frameworks, but progress has been made for some well-defined tasks.
___________________
2See https://beesuite.psu.edu/beeshiny (accessed June 19, 2025).


