Measuring Biodiversity for Addressing the Global Biodiversity Crisis: Summary of the 2025 US-UK Scientific Forum (2025)
Chapter: 3 Making Measurements Matter
3 Making Matter Measurements
As speakers in the introductory and first sessions noted, there is no lack of biodiversity data and more sophisticated tools for measuring and monitoring biodiversity. However, that richness is not doing as much as it could to tackle the biodiversity crisis. This is why the forum’s second session focused on how to ensure that biodiversity measurements can be used to answer important conservation questions and contribute to improved biodiversity outcomes.
TRANSFORMING MONITORING DATA INTO MANAGEMENT INFORMATION
Nick Salafsky, executive director of Foundations of Success, addressed the use of focal conservation values and visibility analysis to construct useful gauges of biodiversity, using African painted dogs as an example. Conserving painted dogs requires ensuring viable numbers of not just the dogs, but of their prey and the availability of their prey. In turn, conserving both painted dogs and their prey requires conserving their savannah habit. The representative focal values—words that together represent an overall ecosystem—would therefore include the population of painted dogs, the population of its prey, and the health of the savannah ecosystem.
There are four steps to defining the viability of this system: defining key ecological attributes, identifying indicators for each key ecological attribute, developing a rating scale for each indicator, and knowing the current status and desired future status of the system. A key attribute, for example, could be the number of successful breeding units, and an indicator could be the number of packs that raise pups to adulthood. The rating scale could be poor, fair, good, and very good, with poor being fewer than 5 packs, fair being 5 to 15 packs and indicating an intervention is needed, good being 15 to 20 packs and indicating some intervention may be required to maintain the population, and very good being more than 20 packs and indicating little intervention is needed.
Salafsky explained that any natural indicator will vary over time, so the key is to define the natural range of variation to set a threshold between the different rating designations. He also noted that indicators can be qualitative and quantitative. For example, a project concerned with toad conservation could have absence of disease as a key ecological attribute with an indicator being ponds with the Batrachochytrium dendrobatidis, or Bd, fungus present. Here, the indicator could be as simple as many, few, and none. Another key attribute could be recolonization potential, with an indicator being how easy it is for the toads to hop from one pond to another. The indicators could then be not hoppable, barely hoppable, hoppable, and easily hoppable.
For a project looking at chimpanzees in Tanzania, Salafsky conducted a similar exercise using satellite measurements of trees, drone surveys of chimpanzee nets, and other data to identify areas needing different levels of management based on habitat health as measured by the percentage of forest loss from a baseline level measured in 2000 (see Figures 3-1 and 3-2). He noted that he repeated this analysis across all chimpanzee habitats (see Figure 3-3). The key to viability assessment, said Salafsky, is selecting the handful of indicators and attributes that fit an information need that will inform management action.
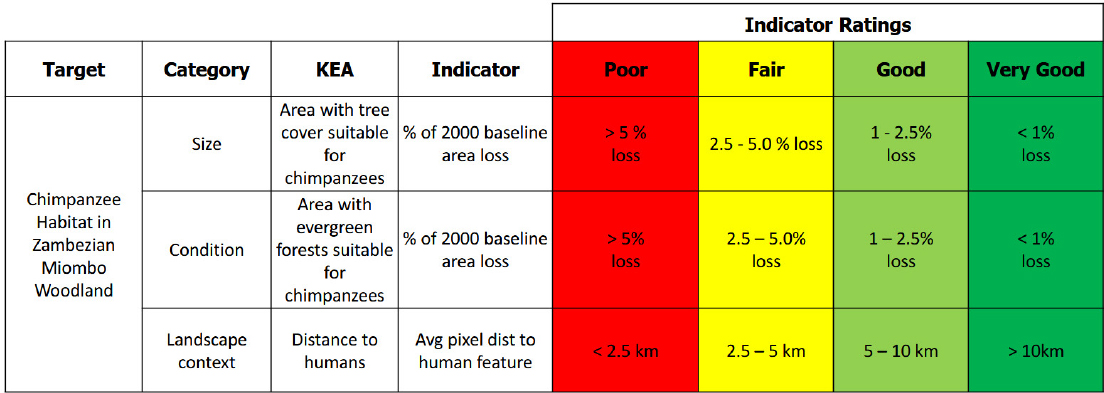
Viability matrix for chimpanzee conservation in Tanzania.
SOURCE: Salafsky presentation, May 21, 2025. CC BY-SA 3.0.
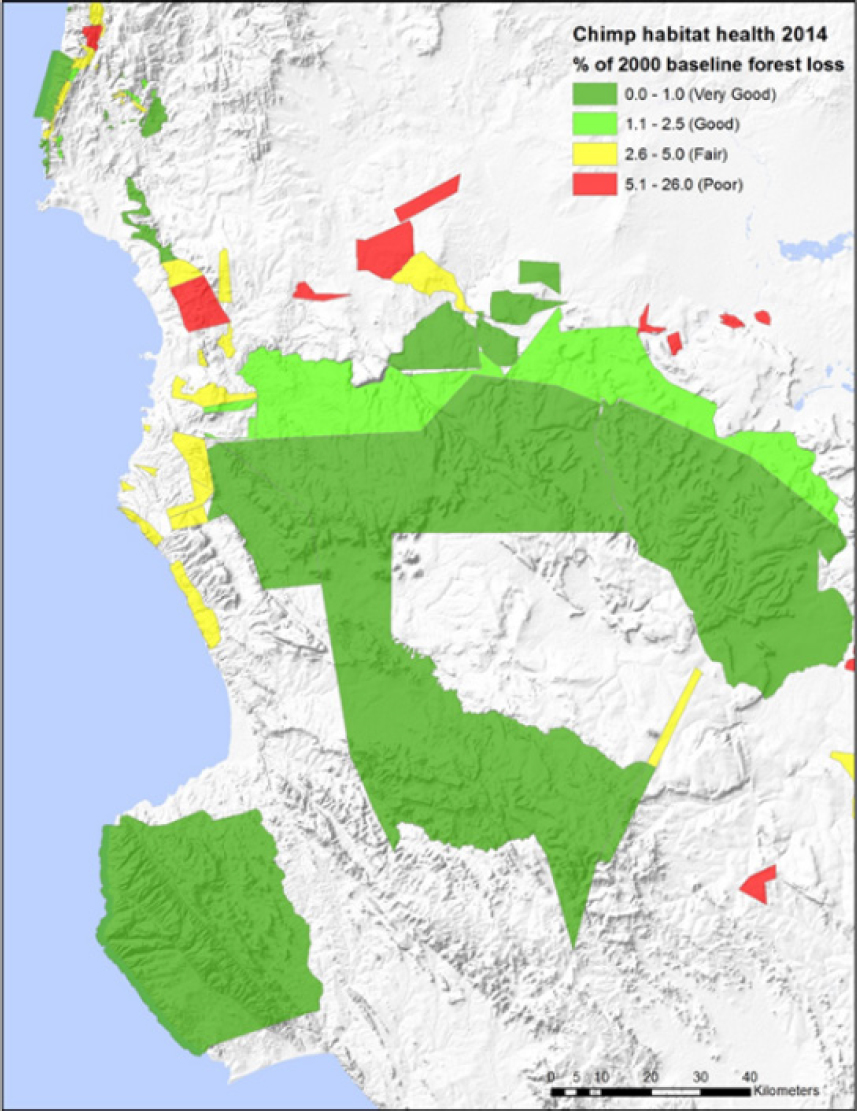
Identifying management polygons in Tanzania using viability ratings.
SOURCE: Salafsky presentation, May 21, 2025. CC BY-SA 3.0.
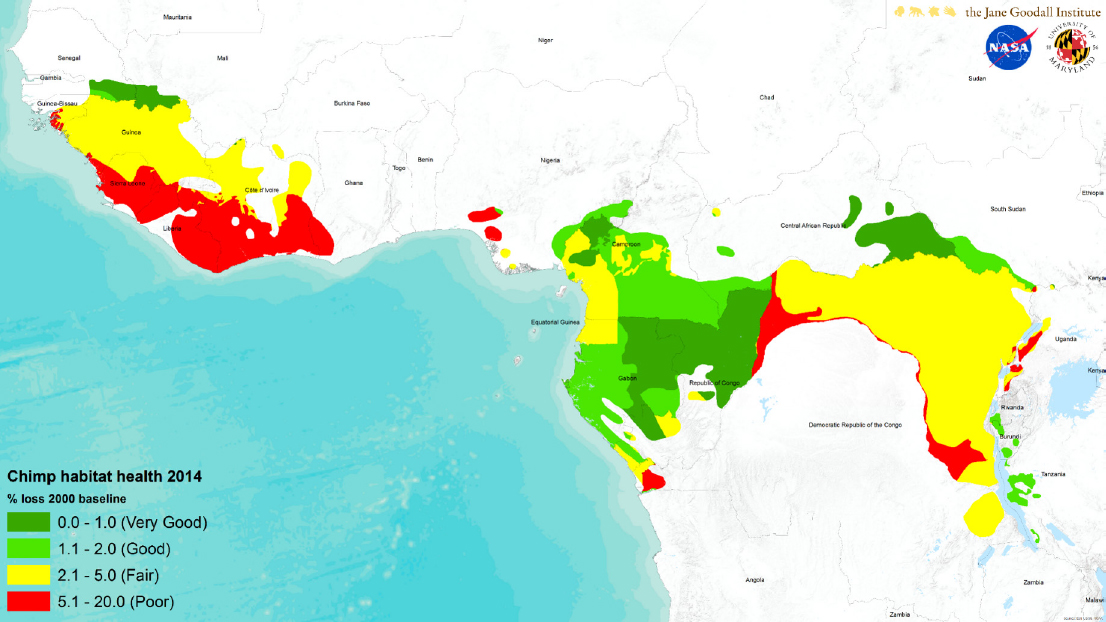
Management polygons covering all chimpanzee habitat.
SOURCE: Salafsky presentation, May 21, 2025. CC BY-SA 3.0.
In closing, Salafsky said while it is important to measure an outcome and biodiversity, it is also important to track threats that may materialize. Those can serve as a leading indicator of how an ecosystem is doing. It is also important to track the capacity of humans to respond to those threats.
FROM CHARTING CHANGE TO SEEKING SOLUTIONS
Philipp Boersch-Supan, principal ecological statistician at the British Trust for Ornithology, explained that the UK Breeding Bird Survey, which involves volunteers monitoring approximately 4,000 sites covering more than 1.5 percent of the nation’s land surface, has generated data that have played a part in evaluating conservation progress over the past 40 years. These data have
identified species in near-terminal decline, such as the turtle dove, colonizers that are rapidly expanding, and species maintaining their numbers within a range of natural variation.
Boersch-Supan said that although indicators such as this can answer certain questions, such as whether conservation activities are halting loss of biodiversity, they are not sufficient or even necessary to make decisions about diversity loss. “I do not want to lessen all of the talk we had today about gaps, but I would argue that we need to focus perhaps a bit less on the state of nature and perhaps a bit more on informing decisions,” he said.
As an example, Boersch-Supan discussed a project to assess whether a protected area designation alone improved species diversity in the United Kingdom. Data from the Breeding Bird Survey and other monitoring schemes showed that species diversity was higher in protected areas than outside of them. Protected areas, however, did not affect trends, raising concern that protected areas may not have long-term positive effects on halting biodiversity declines. Further analysis found that some species were more productive in unprotected areas, though that does not translate into population growth.
Regarding how to overcome the gap between monitoring the state of nature and generating actionable information for interventions, Boersch-Supan said it is important to integrate beyond state-of-nature measurement schemes and have targeted interventions that are structured so the resulting data are interoperable with long-term monitoring. It is also critical to think more mechanistically in how counterfactuals are set when planning interventions or making decisions. Measurements without collaboration and communication with policymakers will not solve the biodiversity crisis, he said, because if policymakers set targets based on unmeasurable quantities, those policies will fail.
ROBUST BIODIVERSITY ASSESSMENT POWERED BY ENVIRONMENTAL DNA
Catherine Bruce, founder and director of NatureMetrics, said environmental DNA (eDNA) technology enables sequencing DNA from water, soil, and even air to generate species data at scales that were previously not feasible and reveal what is changing and responding to changes in the environment over time and space. When compared to data from a reference site, it enables determining how well a restoration project is doing in aggregate and at the individual taxonomic or functional group level. For example, eDNA measurements from soil can generate a census of the bacteria, fungi, and invertebrates both collectively and separately to identify which groups are doing better or are underrepresented in a restoration area. Her company has done this type of analysis for the UK Forestry Commission to determine how well reforestation projects have fared.
The limitation with this approach is the need for a suitable reference site and to keep monitoring the reference site. This is expensive and not massively scalable, said Bruce. To address this limitation, her company has collected enough soil-based data to start building a model-based approach that overlays sites with soil data onto geospatial data on habitats and land use and combines those data with the Biodiversity Intactness Index. The resulting model enables taking a single soil sample and saying where it sits on a scale from good to bad based on its biological community. This approach also enables species distribution modeling to predict where important species might be, even in places beyond monitoring.
MAKING BIODIVERSITY MEASURES MATTER
One challenge facing the biodiversity community is how to think about continental-scale biology when biological processes are operating at many scales, where biologists have divided themselves into isolated disciplines and are measuring one thing at a time, and where methods for integrating across different scales are lacking. Jeannine Cavender-Bares, professor of organismic and evolutionary biology at Harvard University and director of the Harvard University Herbaria, said remote sensing can help address this challenge as can the wealth of plant diversity information housed in the world’s herbaria. Her team recently launched the International Herbarium Spectral Digitization Working Group to develop protocols and standards for using spectroscopic information such as reflected light from herbarium specimens, which can predict a suite of plant functional traits.
Cavender-Bares explained that plant trait data from the world’s herbaria can be upscaled and integrated with in-situ and air- and spaceborne observations. The coupled data can then be used to predict functional traits over large spatial areas or globally. Spectral tools, she added, can obtain common data types to help integrate biological variation across scale. She noted that spectral signatures of plant leaves obtained via airborne imagery are strongly associated with phylogenetic information. These phylogenetic signals persist across scales from leaves to canopies and can be used to model multiple measures of diversity, including functional, phylogenetic, and species diversity. These data can identify dominant species, provide information about species richness or evenness with submeter spatial resolution, and generate maps of different forest community types.
Cavender-Bares said in closing that this type of predicted biodiversity information can provide an understanding of ecological integrity and how well conservation efforts are doing over time. With in-situ monitoring information to validate model predictions, this type of analysis can also track invasive species.
CONNECTING THE DOTS IN BIODIVERSITY WITH AI
In the forum’s introductory session, Andy Purvis stated that biodiversity is too complex to be represented by a single metric. To Anil Madhavapeddy, professor of planetary computing at the University of Cambridge, it seems strange, then, to try to create a single model that will serve as the basis for making complicated decisions. This is why he and his colleagues are trying to develop multimodal AI, a collection of models that can learn something specific and deeply and then interact with each other to form a meshed network of models that can inform highly accurate implementation of biodiversity decisions.
The focus of Madhavapeddy’s work is the LIFE metric for mapping global species persistence, which aims to be a globally comparable metric for terrestrial species’ persistence in the face of land use changes, either conversion or restoration. The idea here was to create a transparent, explainable algorithm that would engender trust in the model. In its first iteration, the resolution of the generated maps was only sufficient to produce ground-based estimates that were 70 to 80 percent accurate, which would not be that useful for reliable policymaking at the local level, he explained. To get closer to 100 percent accuracy, his team decided to combine observational data with information from the published literature.
The starting point of this effort was to use machine learning to compress petabytes of satellite observational data into gigabytes of label-efficient classifiers useful for a variety of downstream tasks. This type of geospatial foundation model allows for reusing processed data for downstream biodiversity datasets relevant to analyses such as land segmentation, canopy height estimate, land use changes, fungal biodiversity, crop yield analysis, species distribution modeling, and assessing above-ground biomass as a function of the distance to the forest edge.
What information from the literature can add is causality, or why changes are happening. Working with a Cambridge University librarian, his team downloaded 100 million full-text papers that they can now run through evidence pipelines using large language models and find hidden, causal connections.
For this type of AI-powered analysis to be of lasting value, it needs provenance and a reproducible data infrastructure to avoid AI contamination of pristine observations, run by multiple federated organizations that can cross-check data integrity. There also needs to be a regular and open biodiversity benchmark competition for technologies to compete and learn from each other, much like the structural biology community’s biannual competition in which computational teams predict structures of proteins that have been experimentally discovered but not yet released. “If we can figure out collectively how to do that in biodiversity, it gives us that kind of meta framework into which we can plug all of our data and our learning and our models together,” said Madhavapeddy.


