Load Rating of Segmental Bridges (2024)
Chapter: Appendix B: Live Load Models Based on National Weigh-in-Motion Data and Permit Data
APPENDIX B
Live Load Models Based on National Weigh-in-Motion Data and Permit Data
B.1 AASHTO Single-Unit Loads
Specialized hauling vehicles (SHVs) are single-unit trucks with closely spaced multiple axles. The number of axles is typically from four to seven and can be loaded up to 80-kip gross vehicle weight (GVW) without violating federal bridge formula even though they have short wheelbases.
In accordance with SHRP 2 Report: S2-R19B-RW-1, 32 WIM sites were selected (Modjeski and Masters, Inc. et al. 2015).
There are 32 WIM sites from 19 states, including Arizona, Arkansas, Colorado, Delaware, Illinois, Indiana, Kansas, Louisiana, Maine, Maryland, Minnesota, New Mexico, Pennsylvania, Tennessee, Virginia, Wisconsin, California, Florida, and Mississippi.
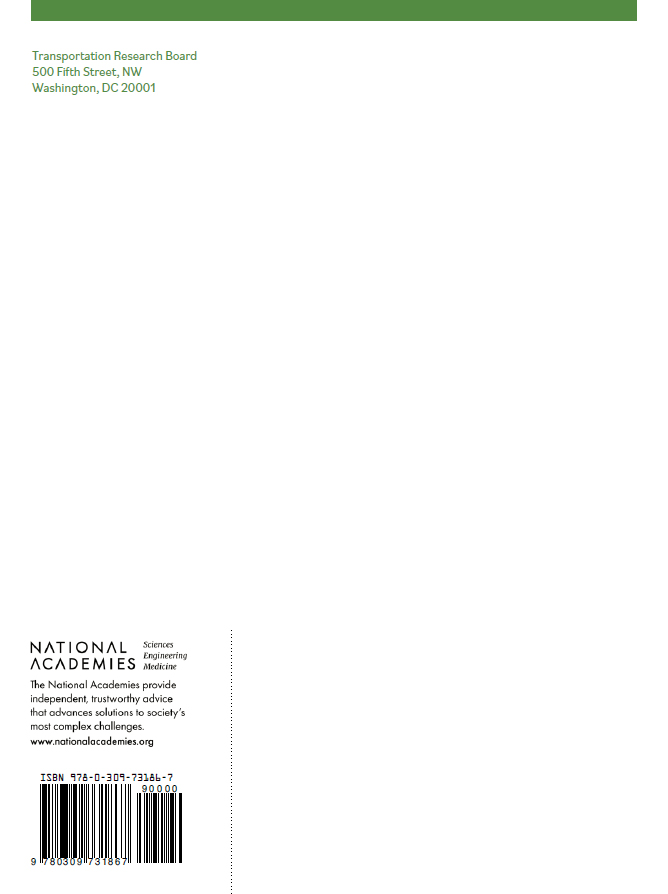
Lou et al. (2019) developed an algorithm to identify SHVs from the WIM data, as shown in Figure B-1. The algorithm consists of filtering out the erroneous and car readings, filtering out the overweight trucks, and screening the SHV traffic fleet based on the truck configurations (i.e., truck length and weight). Using the algorithm, the SHV’s traffic fleet is screened out from the qualified vehicle fleet. The statistics are summarized in Table B-1.
The load effects of SHVs are normalized by AASHTO’s single-unit family. However, owing to an insufficient number of seven-axle SHVs, the live load extrapolation was performed for four-axle, five-axle, and six-axle SHVs only.
The statistical live load model consists of the mean maximum bias factor (λ), V of the maximum load effects, and the distribution type of the maximum load effects.
The load effects are calculated for span lengths of 30 ft, 60 ft, 80 ft, 120 ft, and 200 ft. Figure B-3 through Figure B-7 show the normal probability paper (NPP) of the SHV gross vehicle weight (GVW) and the load effect ratios for five WIM sites (randomly selected for demonstration purposes).
The live load extrapolations were performed in two approaches, extrapolations using all SHVs’ load and the maximum daily loads, both plotted in the NPP. The Kolmogorov–Smirnov test was selected for different WIM sites and different span lengths due to its better performance than the Chi-Square test. Based on the analysis of goodness of fit, normal distribution can be used to describe all data, while generalized extreme value (GEV) distribution can be used to describe daily maximum data. However, the GEV extrapolations for some span lengths are not able to envelop the maximum observed values. In addition, the normal extrapolation gives more stable results. Therefore, the team decided to use the normal extrapolation.
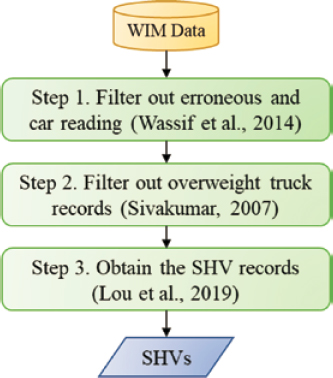
Table B-1. SHV counts from each WIM site.
| Source | Site ID | QV # | SHV4 # | SHV5 # | SHV6 # | SHV7 # |
|---|---|---|---|---|---|---|
| FHWA Data | AR2 | 1675235 | 59 | 13 | 0 | 0 |
| AZ1 | 35572 | 5 | 0 | 0 | 0 | |
| AZ2 | 1430424 | 11 | 8 | 0 | 0 | |
| CO2 | 343580 | 1 | 0 | 0 | 0 | |
| DE1 | 201673 | 50 | 0 | 0 | 0 | |
| IL6 | 854013 | 24 | 1 | 0 | 0 | |
| IN6 | 185263 | 14 | 17 | 0 | 0 | |
| KS2 | 477905 | 40 | 0 | 0 | 0 | |
| LA1 | 85692 | 10 | 0 | 0 | 0 | |
| MD5 | 328770 | 166 | 4 | 0 | 0 | |
| ME5 | 366488 | 4 | 0 | 0 | 0 | |
| MN5 | 55538 | 104 | 68 | 0 | 0 | |
| NM1 | 117095 | 1 | 0 | 0 | 0 | |
| NM5 | 608275 | 0 | 0 | 0 | 0 | |
| PA6 | 1495705 | 13 | 0 | 0 | 0 | |
| TN6 | 1622282 | 97 | 1 | 0 | 0 | |
| VA1 | 259180 | 83 | 18 | 0 | 0 | |
| WI1 | 226908 | 52 | 165 | 0 | 0 | |
| NCHRP Data | CA_AEB | 837667 | 17 | 2 | 0 | 0 |
| CA_AWB | 943147 | 51 | 11 | 0 | 0 | |
| CA_Bow | 651090 | 16 | 2 | 0 | 0 | |
| CA_LAN | 4092484 | 1351 | 6036 | 1 | 0 | |
| CA_LAS | 4661287 | 1469 | 1404 | 0 | 0 | |
| CA_Lodi | 2273143 | 59 | 15 | 0 | 0 | |
| FL_I10 | 1641480 | 90 | 14 | 0 | 0 | |
| FL_I95 | 2112518 | 4234 | 91 | 2 | 0 | |
| FL_US29 | 389164 | 761 | 1 | 0 | 0 | |
| MI_I10 | 1965022 | 132 | 69 | 5 | 0 | |
| MI_I55R | 1333268 | 38 | 128 | 0 | 0 | |
| MI_I55U | 1232223 | 36 | 95 | 0 | 0 | |
| MI_US49 | 1225138 | 200 | 102 | 0 | 0 | |
| MI_US61 | 159299 | 6 | 13 | 0 | 0 |
The load effect extrapolations were done for various return periods and different simulated ADTTs. The return periods included 1 day, 2 weeks, 1 month, 2 months, 6 months, 1 year, 5 years, 50 years, 75 years, and 100 years; the ADTTs include 250, 1,000, 2,500, 5,000, and 10,000. After the load extrapolation for each site, the mean, V, and distribution types of the maximum load effects were determined for the reliability analysis, as tabulated in Table B-2 through Table B-46.
Table B-2. Four-axle SHV statistical parameters of live load moment for ADTT = 250.
| Moment | 30 ft | 60 ft | 80 ft | 120 ft | 200 ft | |||||
|---|---|---|---|---|---|---|---|---|---|---|
| Bias | V | Bias | V | Bias | V | Bias | V | Bias | V | |
| 1 day | 0.81 | 0.06 | 0.84 | 0.07 | 0.86 | 0.07 | 0.87 | 0.07 | 0.86 | 0.08 |
| 2 weeks | 0.86 | 0.05 | 0.88 | 0.06 | 0.91 | 0.05 | 0.92 | 0.05 | 0.92 | 0.06 |
| 1 month | 0.87 | 0.04 | 0.90 | 0.05 | 0.92 | 0.05 | 0.94 | 0.04 | 0.94 | 0.05 |
| 2 months | 0.89 | 0.04 | 0.91 | 0.05 | 0.94 | 0.04 | 0.95 | 0.04 | 0.96 | 0.04 |
| 6 months | 0.91 | 0.04 | 0.94 | 0.04 | 0.96 | 0.03 | 0.98 | 0.03 | 0.99 | 0.04 |
| 1 year | 0.92 | 0.03 | 0.95 | 0.03 | 0.97 | 0.03 | 1.00 | 0.03 | 1.01 | 0.04 |
| 5 years | 0.95 | 0.03 | 0.98 | 0.03 | 1.00 | 0.03 | 1.03 | 0.03 | 1.05 | 0.04 |
| 50 years | 0.98 | 0.03 | 1.01 | 0.03 | 1.03 | 0.03 | 1.07 | 0.04 | 1.10 | 0.05 |
| 75 years | 0.99 | 0.03 | 1.02 | 0.03 | 1.04 | 0.03 | 1.07 | 0.05 | 1.10 | 0.06 |
| 100 years | 0.99 | 0.03 | 1.02 | 0.03 | 1.04 | 0.03 | 1.07 | 0.05 | 1.11 | 0.06 |
Table B-3. Four-axle SHV statistical parameters of live load moment for ADTT = 1,000.
| Moment | 30 ft | 60 ft | 80 ft | 120 ft | 200 ft | |||||
|---|---|---|---|---|---|---|---|---|---|---|
| Bias | V | Bias | V | Bias | V | Bias | V | Bias | V | |
| 1 day | 0.84 | 0.05 | 0.86 | 0.07 | 0.88 | 0.06 | 0.89 | 0.06 | 0.89 | 0.07 |
| 2 weeks | 0.89 | 0.04 | 0.91 | 0.05 | 0.93 | 0.04 | 0.95 | 0.04 | 0.96 | 0.05 |
| 1 month | 0.90 | 0.04 | 0.93 | 0.04 | 0.95 | 0.04 | 0.97 | 0.04 | 0.98 | 0.04 |
| 2 months | 0.92 | 0.03 | 0.94 | 0.04 | 0.96 | 0.03 | 0.99 | 0.03 | 1.00 | 0.04 |
| 6 months | 0.94 | 0.03 | 0.96 | 0.03 | 0.98 | 0.03 | 1.01 | 0.03 | 1.03 | 0.04 |
| 1 year | 0.95 | 0.03 | 0.97 | 0.03 | 1.00 | 0.03 | 1.02 | 0.03 | 1.05 | 0.04 |
| 5 years | 0.97 | 0.03 | 1.00 | 0.02 | 1.02 | 0.03 | 1.05 | 0.04 | 1.08 | 0.05 |
| 50 years | 1.00 | 0.03 | 1.03 | 0.03 | 1.05 | 0.04 | 1.08 | 0.05 | 1.12 | 0.06 |
| 75 years | 1.00 | 0.04 | 1.03 | 0.03 | 1.05 | 0.04 | 1.09 | 0.05 | 1.12 | 0.06 |
| 100 years | 1.01 | 0.04 | 1.03 | 0.03 | 1.05 | 0.04 | 1.09 | 0.05 | 1.13 | 0.07 |
Table B-4. Four-axle SHV statistical parameters of live load moment for ADTT = 2,500.
| Moment | 30 ft | 60 ft | 80 ft | 120 ft | 200 ft | |||||
|---|---|---|---|---|---|---|---|---|---|---|
| Bias | V | Bias | V | Bias | V | Bias | V | Bias | V | |
| 1 day | 0.85 | 0.05 | 0.88 | 0.06 | 0.90 | 0.05 | 0.91 | 0.05 | 0.91 | 0.06 |
| 2 weeks | 0.91 | 0.04 | 0.93 | 0.04 | 0.95 | 0.04 | 0.97 | 0.04 | 0.99 | 0.04 |
| 1 month | 0.92 | 0.03 | 0.95 | 0.04 | 0.97 | 0.03 | 0.99 | 0.03 | 1.01 | 0.04 |
| 2 months | 0.93 | 0.03 | 0.96 | 0.03 | 0.98 | 0.03 | 1.01 | 0.03 | 1.03 | 0.04 |
| 6 months | 0.95 | 0.03 | 0.98 | 0.03 | 1.00 | 0.03 | 1.03 | 0.03 | 1.05 | 0.04 |
| 1 year | 0.96 | 0.03 | 0.99 | 0.02 | 1.01 | 0.03 | 1.04 | 0.04 | 1.07 | 0.04 |
| 5 years | 0.98 | 0.03 | 1.01 | 0.03 | 1.03 | 0.03 | 1.07 | 0.04 | 1.10 | 0.05 |
| 50 years | 1.01 | 0.04 | 1.04 | 0.03 | 1.06 | 0.04 | 1.09 | 0.05 | 1.13 | 0.07 |
| 75 years | 1.01 | 0.04 | 1.04 | 0.04 | 1.06 | 0.04 | 1.10 | 0.06 | 1.14 | 0.07 |
| 100 years | 1.02 | 0.04 | 1.04 | 0.04 | 1.06 | 0.04 | 1.10 | 0.06 | 1.14 | 0.07 |
Table B-5. Four-axle SHV statistical parameters of live load moment for ADTT = 5,000.
| Moment | 30 ft | 60 ft | 80 ft | 120 ft | 200 ft | |||||
|---|---|---|---|---|---|---|---|---|---|---|
| Bias | V | Bias | V | Bias | V | Bias | V | Bias | V | |
| 1 day | 0.87 | 0.05 | 0.89 | 0.06 | 0.91 | 0.05 | 0.93 | 0.05 | 0.93 | 0.05 |
| 2 weeks | 0.92 | 0.03 | 0.94 | 0.04 | 0.97 | 0.03 | 0.99 | 0.03 | 1.01 | 0.04 |
| 1 month | 0.93 | 0.03 | 0.96 | 0.03 | 0.98 | 0.03 | 1.01 | 0.03 | 1.03 | 0.04 |
| 2 months | 0.95 | 0.03 | 0.97 | 0.03 | 0.99 | 0.03 | 1.02 | 0.03 | 1.04 | 0.04 |
| 6 months | 0.96 | 0.03 | 0.99 | 0.02 | 1.01 | 0.03 | 1.04 | 0.04 | 1.07 | 0.04 |
| 1 year | 0.97 | 0.03 | 1.00 | 0.02 | 1.02 | 0.03 | 1.05 | 0.04 | 1.08 | 0.05 |
| 5 years | 0.99 | 0.03 | 1.02 | 0.03 | 1.04 | 0.03 | 1.07 | 0.05 | 1.11 | 0.06 |
| 50 years | 1.02 | 0.04 | 1.04 | 0.04 | 1.06 | 0.04 | 1.10 | 0.06 | 1.14 | 0.07 |
| 75 years | 1.02 | 0.04 | 1.05 | 0.04 | 1.07 | 0.04 | 1.11 | 0.06 | 1.15 | 0.07 |
| 100 years | 1.02 | 0.04 | 1.05 | 0.04 | 1.07 | 0.04 | 1.11 | 0.06 | 1.15 | 0.07 |
Table B-6. Four-axle SHV statistical parameters of live load moment for ADTT = 10,000.
| Moment | 30 ft | 60 ft | 80 ft | 120 ft | 200 ft | |||||
|---|---|---|---|---|---|---|---|---|---|---|
| Bias | V | Bias | V | Bias | V | Bias | V | Bias | V | |
| 1 day | 0.88 | 0.04 | 0.90 | 0.05 | 0.93 | 0.05 | 0.94 | 0.04 | 0.95 | 0.05 |
| 2 weeks | 0.93 | 0.03 | 0.96 | 0.03 | 0.98 | 0.03 | 1.00 | 0.03 | 1.03 | 0.04 |
| 1 month | 0.95 | 0.03 | 0.97 | 0.03 | 0.99 | 0.03 | 1.02 | 0.03 | 1.04 | 0.04 |
| 2 months | 0.96 | 0.03 | 0.98 | 0.02 | 1.00 | 0.03 | 1.03 | 0.03 | 1.06 | 0.04 |
| 6 months | 0.97 | 0.03 | 1.00 | 0.02 | 1.02 | 0.03 | 1.05 | 0.04 | 1.08 | 0.05 |
| 1 year | 0.98 | 0.03 | 1.01 | 0.03 | 1.03 | 0.03 | 1.06 | 0.04 | 1.09 | 0.05 |
| 5 years | 1.00 | 0.03 | 1.03 | 0.03 | 1.05 | 0.04 | 1.08 | 0.05 | 1.12 | 0.06 |
| 50 years | 1.02 | 0.04 | 1.05 | 0.04 | 1.07 | 0.04 | 1.11 | 0.06 | 1.15 | 0.07 |
| 75 years | 1.03 | 0.04 | 1.05 | 0.04 | 1.07 | 0.05 | 1.11 | 0.06 | 1.16 | 0.08 |
| 100 years | 1.03 | 0.04 | 1.05 | 0.04 | 1.08 | 0.05 | 1.12 | 0.06 | 1.16 | 0.08 |
Table B-7. Four-axle SHV statistical parameters of live load reaction for ADTT = 250.
| Reaction | 30 ft | 60 ft | 80 ft | 120 ft | 200 ft | |||||
|---|---|---|---|---|---|---|---|---|---|---|
| Bias | V | Bias | V | Bias | V | Bias | V | Bias | V | |
| 1 day | 0.80 | 0.08 | 0.87 | 0.06 | 0.89 | 0.06 | 0.88 | 0.06 | 0.87 | 0.08 |
| 2 weeks | 0.85 | 0.07 | 0.91 | 0.05 | 0.93 | 0.04 | 0.93 | 0.05 | 0.93 | 0.06 |
| 1 month | 0.87 | 0.06 | 0.93 | 0.04 | 0.94 | 0.04 | 0.95 | 0.04 | 0.95 | 0.05 |
| 2 months | 0.88 | 0.06 | 0.94 | 0.04 | 0.96 | 0.04 | 0.97 | 0.04 | 0.97 | 0.05 |
| 6 months | 0.91 | 0.05 | 0.96 | 0.03 | 0.98 | 0.03 | 0.99 | 0.03 | 1.00 | 0.04 |
| 1 year | 0.92 | 0.05 | 0.97 | 0.03 | 0.99 | 0.03 | 1.01 | 0.03 | 1.02 | 0.04 |
| 5 years | 0.96 | 0.04 | 1.00 | 0.03 | 1.02 | 0.03 | 1.04 | 0.03 | 1.06 | 0.04 |
| 50 years | 0.99 | 0.05 | 1.03 | 0.04 | 1.05 | 0.04 | 1.08 | 0.04 | 1.10 | 0.05 |
| 75 years | 1.00 | 0.05 | 1.03 | 0.04 | 1.05 | 0.04 | 1.08 | 0.04 | 1.11 | 0.05 |
| 100 years | 1.00 | 0.05 | 1.04 | 0.04 | 1.05 | 0.04 | 1.08 | 0.05 | 1.11 | 0.06 |
Table B-8. Four-axle SHV statistical parameters of live load reaction for ADTT = 1,000.
| Reaction | 30 ft | 60 ft | 80 ft | 120 ft | 200 ft | |||||
|---|---|---|---|---|---|---|---|---|---|---|
| Bias | V | Bias | V | Bias | V | Bias | V | Bias | V | |
| 1 day | 0.82 | 0.07 | 0.89 | 0.05 | 0.91 | 0.05 | 0.91 | 0.06 | 0.90 | 0.07 |
| 2 weeks | 0.88 | 0.06 | 0.94 | 0.04 | 0.95 | 0.04 | 0.96 | 0.04 | 0.97 | 0.05 |
| 1 month | 0.90 | 0.06 | 0.95 | 0.04 | 0.97 | 0.03 | 0.98 | 0.04 | 0.99 | 0.04 |
| 2 months | 0.91 | 0.05 | 0.97 | 0.03 | 0.98 | 0.03 | 1.00 | 0.03 | 1.01 | 0.04 |
| 6 months | 0.94 | 0.05 | 0.98 | 0.03 | 1.00 | 0.03 | 1.02 | 0.03 | 1.04 | 0.04 |
| 1 year | 0.95 | 0.04 | 1.00 | 0.03 | 1.01 | 0.03 | 1.04 | 0.03 | 1.05 | 0.04 |
| 5 years | 0.98 | 0.04 | 1.02 | 0.03 | 1.04 | 0.04 | 1.06 | 0.04 | 1.09 | 0.05 |
| 50 years | 1.01 | 0.05 | 1.04 | 0.04 | 1.06 | 0.05 | 1.09 | 0.05 | 1.12 | 0.06 |
| 75 years | 1.01 | 0.05 | 1.05 | 0.04 | 1.06 | 0.05 | 1.10 | 0.05 | 1.13 | 0.06 |
| 100 years | 1.02 | 0.05 | 1.05 | 0.04 | 1.07 | 0.05 | 1.10 | 0.05 | 1.13 | 0.06 |
Table B-9. Four-axle SHV statistical parameters of live load reaction for ADTT = 2,500.
| Reaction | 30 ft | 60 ft | 80 ft | 120 ft | 200 ft | |||||
|---|---|---|---|---|---|---|---|---|---|---|
| Bias | V | Bias | V | Bias | V | Bias | V | Bias | V | |
| 1 day | 0.84 | 0.07 | 0.91 | 0.05 | 0.92 | 0.05 | 0.92 | 0.05 | 0.92 | 0.06 |
| 2 weeks | 0.90 | 0.05 | 0.96 | 0.03 | 0.97 | 0.03 | 0.99 | 0.04 | 0.99 | 0.04 |
| 1 month | 0.92 | 0.05 | 0.97 | 0.03 | 0.99 | 0.03 | 1.00 | 0.03 | 1.02 | 0.04 |
| 2 months | 0.93 | 0.05 | 0.98 | 0.03 | 1.00 | 0.03 | 1.02 | 0.03 | 1.03 | 0.04 |
| 6 months | 0.96 | 0.04 | 1.00 | 0.03 | 1.02 | 0.03 | 1.04 | 0.03 | 1.06 | 0.04 |
| 1 year | 0.97 | 0.04 | 1.01 | 0.03 | 1.03 | 0.03 | 1.05 | 0.04 | 1.07 | 0.04 |
| 5 years | 0.99 | 0.05 | 1.03 | 0.04 | 1.05 | 0.04 | 1.08 | 0.04 | 1.10 | 0.05 |
| 50 years | 1.02 | 0.05 | 1.05 | 0.04 | 1.07 | 0.05 | 1.10 | 0.05 | 1.14 | 0.07 |
| 75 years | 1.02 | 0.06 | 1.06 | 0.05 | 1.07 | 0.05 | 1.11 | 0.06 | 1.14 | 0.07 |
| 100 years | 1.03 | 0.06 | 1.06 | 0.05 | 1.08 | 0.05 | 1.11 | 0.06 | 1.15 | 0.07 |
Table B-10. Four-axle SHV statistical parameters of live load reaction for ADTT = 5,000.
| Reaction | 30 ft | 60 ft | 80 ft | 120 ft | 200 ft | |||||
|---|---|---|---|---|---|---|---|---|---|---|
| Bias | V | Bias | V | Bias | V | Bias | V | Bias | V | |
| 1 day | 0.86 | 0.07 | 0.92 | 0.04 | 0.94 | 0.04 | 0.94 | 0.05 | 0.94 | 0.05 |
| 2 weeks | 0.92 | 0.05 | 0.97 | 0.03 | 0.99 | 0.03 | 1.00 | 0.03 | 1.01 | 0.04 |
| 1 month | 0.93 | 0.05 | 0.98 | 0.03 | 1.00 | 0.03 | 1.02 | 0.03 | 1.03 | 0.04 |
| 2 months | 0.95 | 0.04 | 0.99 | 0.03 | 1.01 | 0.03 | 1.03 | 0.03 | 1.05 | 0.04 |
| 6 months | 0.97 | 0.04 | 1.01 | 0.03 | 1.03 | 0.03 | 1.05 | 0.04 | 1.07 | 0.04 |
| 1 year | 0.98 | 0.04 | 1.02 | 0.03 | 1.04 | 0.04 | 1.06 | 0.04 | 1.09 | 0.05 |
| 5 years | 1.00 | 0.05 | 1.04 | 0.04 | 1.05 | 0.04 | 1.08 | 0.05 | 1.11 | 0.06 |
| 50 years | 1.03 | 0.06 | 1.06 | 0.05 | 1.08 | 0.05 | 1.11 | 0.06 | 1.15 | 0.07 |
| 75 years | 1.03 | 0.06 | 1.06 | 0.05 | 1.08 | 0.05 | 1.12 | 0.06 | 1.15 | 0.07 |
| 100 years | 1.03 | 0.06 | 1.06 | 0.05 | 1.08 | 0.05 | 1.12 | 0.06 | 1.16 | 0.07 |
Table B-11. Four-axle SHV statistical parameters of live load reaction for ADTT = 10,000.
| Reaction | 30 ft | 60 ft | 80 ft | 120 ft | 200 ft | |||||
|---|---|---|---|---|---|---|---|---|---|---|
| Bias | V | Bias | V | Bias | V | Bias | V | Bias | V | |
| 1 day | 0.87 | 0.06 | 0.93 | 0.04 | 0.95 | 0.04 | 0.96 | 0.04 | 0.96 | 0.05 |
| 2 weeks | 0.93 | 0.05 | 0.98 | 0.03 | 1.00 | 0.03 | 1.02 | 0.03 | 1.03 | 0.04 |
| 1 month | 0.95 | 0.04 | 0.99 | 0.03 | 1.01 | 0.03 | 1.03 | 0.03 | 1.05 | 0.04 |
| 2 months | 0.96 | 0.04 | 1.00 | 0.03 | 1.02 | 0.03 | 1.04 | 0.03 | 1.07 | 0.04 |
| 6 months | 0.98 | 0.04 | 1.02 | 0.03 | 1.03 | 0.04 | 1.06 | 0.04 | 1.09 | 0.05 |
| 1 year | 0.99 | 0.05 | 1.03 | 0.04 | 1.04 | 0.04 | 1.07 | 0.04 | 1.10 | 0.05 |
| 5 years | 1.01 | 0.05 | 1.04 | 0.04 | 1.06 | 0.05 | 1.09 | 0.05 | 1.12 | 0.06 |
| 50 years | 1.03 | 0.06 | 1.06 | 0.05 | 1.08 | 0.05 | 1.12 | 0.06 | 1.16 | 0.07 |
| 75 years | 1.04 | 0.06 | 1.07 | 0.05 | 1.08 | 0.06 | 1.12 | 0.06 | 1.16 | 0.07 |
| 100 years | 1.04 | 0.06 | 1.07 | 0.05 | 1.09 | 0.06 | 1.13 | 0.06 | 1.16 | 0.08 |
Table B-12. Four-axle SHV statistical parameters of live load negative moment for ADTT = 250.
| Negative Moment | 30 ft | 60 ft | 80 ft | 120 ft | 200 ft | |||||
|---|---|---|---|---|---|---|---|---|---|---|
| Bias | V | Bias | V | Bias | V | Bias | V | Bias | V | |
| 1 day | 0.87 | 0.12 | 0.88 | 0.06 | 0.88 | 0.06 | 0.86 | 0.08 | 0.85 | 0.09 |
| 2 weeks | 0.97 | 0.09 | 0.92 | 0.05 | 0.93 | 0.05 | 0.93 | 0.06 | 0.92 | 0.07 |
| 1 month | 1.01 | 0.08 | 0.93 | 0.05 | 0.95 | 0.05 | 0.95 | 0.05 | 0.95 | 0.06 |
| 2 months | 1.04 | 0.07 | 0.95 | 0.04 | 0.96 | 0.04 | 0.97 | 0.05 | 0.97 | 0.05 |
| 6 months | 1.08 | 0.06 | 0.97 | 0.04 | 0.99 | 0.04 | 1.01 | 0.04 | 1.01 | 0.05 |
| 1 year | 1.11 | 0.06 | 0.98 | 0.03 | 1.01 | 0.03 | 1.03 | 0.04 | 1.04 | 0.05 |
| 5 years | 1.18 | 0.06 | 1.01 | 0.03 | 1.04 | 0.03 | 1.07 | 0.04 | 1.08 | 0.05 |
| 50 years | 1.24 | 0.07 | 1.04 | 0.03 | 1.08 | 0.04 | 1.12 | 0.06 | 1.14 | 0.07 |
| 75 years | 1.25 | 0.08 | 1.05 | 0.03 | 1.09 | 0.05 | 1.12 | 0.06 | 1.14 | 0.07 |
| 100 years | 1.26 | 0.08 | 1.05 | 0.03 | 1.09 | 0.05 | 1.13 | 0.06 | 1.15 | 0.07 |
Table B-13. Four-axle SHV statistical parameters of live load negative moment for ADTT = 1,000.
| Negative Moment | 30 ft | 60 ft | 80 ft | 120 ft | 200 ft | |||||
|---|---|---|---|---|---|---|---|---|---|---|
| Bias | V | Bias | V | Bias | V | Bias | V | Bias | V | |
| 1 day | 0.92 | 0.10 | 0.90 | 0.06 | 0.90 | 0.06 | 0.89 | 0.07 | 0.88 | 0.08 |
| 2 weeks | 1.03 | 0.08 | 0.95 | 0.04 | 0.96 | 0.04 | 0.97 | 0.05 | 0.97 | 0.05 |
| 1 month | 1.07 | 0.07 | 0.96 | 0.04 | 0.98 | 0.04 | 0.99 | 0.04 | 1.00 | 0.05 |
| 2 months | 1.10 | 0.06 | 0.98 | 0.03 | 1.00 | 0.03 | 1.01 | 0.04 | 1.02 | 0.05 |
| 6 months | 1.14 | 0.06 | 1.00 | 0.03 | 1.02 | 0.03 | 1.05 | 0.04 | 1.06 | 0.05 |
| 1 year | 1.17 | 0.06 | 1.01 | 0.03 | 1.04 | 0.03 | 1.06 | 0.04 | 1.08 | 0.05 |
| 5 years | 1.22 | 0.07 | 1.03 | 0.03 | 1.07 | 0.04 | 1.10 | 0.05 | 1.12 | 0.06 |
| 50 years | 1.28 | 0.08 | 1.06 | 0.04 | 1.10 | 0.05 | 1.14 | 0.06 | 1.16 | 0.07 |
| 75 years | 1.29 | 0.09 | 1.06 | 0.04 | 1.10 | 0.05 | 1.15 | 0.07 | 1.17 | 0.08 |
| 100 years | 1.29 | 0.09 | 1.07 | 0.04 | 1.11 | 0.05 | 1.15 | 0.07 | 1.17 | 0.08 |
Table B-14. Four-axle SHV statistical parameters of live load negative moment for ADTT = 2,500.
| Negative Moment | 30 ft | 60 ft | 80 ft | 120 ft | 200 ft | |||||
|---|---|---|---|---|---|---|---|---|---|---|
| Bias | V | Bias | V | Bias | V | Bias | V | Bias | V | |
| 1 day | 0.96 | 0.09 | 0.91 | 0.05 | 0.92 | 0.05 | 0.92 | 0.06 | 0.91 | 0.07 |
| 2 weeks | 1.07 | 0.07 | 0.97 | 0.04 | 0.99 | 0.04 | 1.00 | 0.04 | 1.00 | 0.05 |
| 1 month | 1.11 | 0.06 | 0.98 | 0.03 | 1.00 | 0.03 | 1.02 | 0.04 | 1.03 | 0.05 |
| 2 months | 1.13 | 0.06 | 0.99 | 0.03 | 1.02 | 0.03 | 1.04 | 0.04 | 1.05 | 0.05 |
| 6 months | 1.17 | 0.06 | 1.01 | 0.03 | 1.04 | 0.03 | 1.07 | 0.04 | 1.08 | 0.05 |
| 1 year | 1.20 | 0.06 | 1.02 | 0.03 | 1.05 | 0.04 | 1.08 | 0.05 | 1.10 | 0.05 |
| 5 years | 1.24 | 0.07 | 1.04 | 0.03 | 1.08 | 0.04 | 1.12 | 0.06 | 1.14 | 0.07 |
| 50 years | 1.30 | 0.09 | 1.07 | 0.04 | 1.11 | 0.05 | 1.15 | 0.07 | 1.18 | 0.08 |
| 75 years | 1.31 | 0.09 | 1.07 | 0.04 | 1.11 | 0.06 | 1.16 | 0.07 | 1.18 | 0.08 |
| 100 years | 1.31 | 0.10 | 1.08 | 0.04 | 1.12 | 0.06 | 1.16 | 0.07 | 1.19 | 0.09 |
Table B-15. Four-axle SHV statistical parameters of live load negative moment for ADTT = 5,000.
| Negative Moment | 30 ft | 60 ft | 80 ft | 120 ft | 200 ft | |||||
|---|---|---|---|---|---|---|---|---|---|---|
| Bias | V | Bias | V | Bias | V | Bias | V | Bias | V | |
| 1 day | 0.99 | 0.09 | 0.93 | 0.05 | 0.94 | 0.05 | 0.94 | 0.06 | 0.94 | 0.06 |
| 2 weeks | 1.10 | 0.06 | 0.98 | 0.03 | 1.00 | 0.03 | 1.02 | 0.04 | 1.03 | 0.05 |
| 1 month | 1.13 | 0.06 | 0.99 | 0.03 | 1.02 | 0.03 | 1.04 | 0.04 | 1.05 | 0.05 |
| 2 months | 1.16 | 0.06 | 1.01 | 0.03 | 1.03 | 0.03 | 1.06 | 0.04 | 1.07 | 0.05 |
| 6 months | 1.20 | 0.06 | 1.02 | 0.03 | 1.05 | 0.04 | 1.08 | 0.05 | 1.10 | 0.05 |
| 1 year | 1.22 | 0.07 | 1.03 | 0.03 | 1.07 | 0.04 | 1.10 | 0.05 | 1.12 | 0.06 |
| 5 years | 1.26 | 0.08 | 1.05 | 0.03 | 1.09 | 0.05 | 1.13 | 0.06 | 1.15 | 0.07 |
| 50 years | 1.31 | 0.10 | 1.08 | 0.04 | 1.12 | 0.06 | 1.16 | 0.07 | 1.19 | 0.09 |
| 75 years | 1.32 | 0.10 | 1.08 | 0.04 | 1.12 | 0.06 | 1.17 | 0.08 | 1.19 | 0.09 |
| 100 years | 1.33 | 0.10 | 1.08 | 0.04 | 1.13 | 0.06 | 1.17 | 0.08 | 1.20 | 0.09 |
Table B-16. Four-axle SHV statistical parameters of live load negative moment for ADTT = 10,000.
| Negative Moment | 30 ft | 60 ft | 80 ft | 120 ft | 200 ft | |||||
|---|---|---|---|---|---|---|---|---|---|---|
| Bias | V | Bias | V | Bias | V | Bias | V | Bias | V | |
| 1 day | 1.02 | 0.08 | 0.94 | 0.04 | 0.95 | 0.04 | 0.96 | 0.05 | 0.96 | 0.06 |
| 2 weeks | 1.13 | 0.06 | 0.99 | 0.03 | 1.02 | 0.03 | 1.04 | 0.04 | 1.05 | 0.05 |
| 1 month | 1.16 | 0.06 | 1.01 | 0.03 | 1.03 | 0.03 | 1.06 | 0.04 | 1.07 | 0.05 |
| 2 months | 1.18 | 0.06 | 1.02 | 0.03 | 1.05 | 0.04 | 1.08 | 0.05 | 1.09 | 0.05 |
| 6 months | 1.22 | 0.07 | 1.03 | 0.03 | 1.07 | 0.04 | 1.10 | 0.05 | 1.12 | 0.06 |
| 1 year | 1.24 | 0.07 | 1.04 | 0.03 | 1.08 | 0.04 | 1.11 | 0.06 | 1.13 | 0.06 |
| 5 years | 1.28 | 0.08 | 1.06 | 0.04 | 1.10 | 0.05 | 1.14 | 0.06 | 1.16 | 0.07 |
| 50 years | 1.33 | 0.10 | 1.08 | 0.04 | 1.13 | 0.06 | 1.17 | 0.08 | 1.20 | 0.09 |
| 75 years | 1.33 | 0.10 | 1.09 | 0.05 | 1.13 | 0.06 | 1.18 | 0.08 | 1.20 | 0.09 |
| 100 years | 1.34 | 0.11 | 1.09 | 0.05 | 1.13 | 0.06 | 1.18 | 0.08 | 1.21 | 0.09 |
Table B-17. Five-axle SHV statistical parameters of live load moment for ADTT = 250.
| Moment | 30 ft | 60 ft | 80 ft | 120 ft | 200 ft | |||||
|---|---|---|---|---|---|---|---|---|---|---|
| Bias | V | Bias | V | Bias | V | Bias | V | Bias | V | |
| 1 day | 0.63 | 0.14 | 0.78 | 0.06 | 0.83 | 0.06 | 0.87 | 0.07 | 0.88 | 0.07 |
| 2 weeks | 0.71 | 0.12 | 0.83 | 0.05 | 0.88 | 0.05 | 0.91 | 0.05 | 0.92 | 0.05 |
| 1 month | 0.73 | 0.12 | 0.85 | 0.05 | 0.89 | 0.05 | 0.92 | 0.05 | 0.94 | 0.05 |
| 2 months | 0.76 | 0.11 | 0.86 | 0.05 | 0.90 | 0.05 | 0.93 | 0.05 | 0.95 | 0.05 |
| 6 months | 0.80 | 0.11 | 0.89 | 0.05 | 0.93 | 0.05 | 0.96 | 0.04 | 0.98 | 0.04 |
| 1 year | 0.82 | 0.11 | 0.91 | 0.06 | 0.94 | 0.04 | 0.97 | 0.04 | 0.99 | 0.04 |
| 5 years | 0.88 | 0.11 | 0.94 | 0.06 | 0.97 | 0.04 | 1.00 | 0.03 | 1.02 | 0.03 |
| 50 years | 0.94 | 0.11 | 0.97 | 0.07 | 1.00 | 0.05 | 1.03 | 0.03 | 1.06 | 0.03 |
| 75 years | 0.95 | 0.12 | 0.98 | 0.07 | 1.00 | 0.05 | 1.03 | 0.03 | 1.06 | 0.03 |
| 100 years | 0.95 | 0.12 | 0.98 | 0.07 | 1.00 | 0.05 | 1.04 | 0.04 | 1.07 | 0.03 |
Table B-18. Five-axle SHV statistical parameters of live load moment for ADTT = 1,000.
| Moment | 30 ft | 60 ft | 80 ft | 120 ft | 200 ft | |||||
|---|---|---|---|---|---|---|---|---|---|---|
| Bias | V | Bias | V | Bias | V | Bias | V | Bias | V | |
| 1 day | 0.67 | 0.13 | 0.81 | 0.05 | 0.85 | 0.06 | 0.89 | 0.06 | 0.90 | 0.06 |
| 2 weeks | 0.75 | 0.11 | 0.86 | 0.05 | 0.90 | 0.05 | 0.93 | 0.05 | 0.95 | 0.05 |
| 1 month | 0.78 | 0.11 | 0.88 | 0.05 | 0.92 | 0.05 | 0.95 | 0.04 | 0.97 | 0.04 |
| 2 months | 0.81 | 0.11 | 0.90 | 0.05 | 0.93 | 0.05 | 0.96 | 0.04 | 0.98 | 0.04 |
| 6 months | 0.85 | 0.11 | 0.92 | 0.06 | 0.95 | 0.04 | 0.98 | 0.04 | 1.00 | 0.04 |
| 1 year | 0.87 | 0.11 | 0.93 | 0.06 | 0.96 | 0.04 | 0.99 | 0.03 | 1.02 | 0.03 |
| 5 years | 0.91 | 0.11 | 0.96 | 0.06 | 0.99 | 0.04 | 1.02 | 0.03 | 1.04 | 0.03 |
| 50 years | 0.97 | 0.12 | 0.99 | 0.07 | 1.01 | 0.05 | 1.04 | 0.04 | 1.07 | 0.04 |
| 75 years | 0.97 | 0.12 | 1.00 | 0.07 | 1.02 | 0.05 | 1.05 | 0.04 | 1.08 | 0.04 |
| 100 years | 0.98 | 0.13 | 1.00 | 0.07 | 1.02 | 0.05 | 1.05 | 0.04 | 1.08 | 0.04 |
Table B-19. Five-axle SHV statistical parameters of live load moment for ADTT = 2,500.
| Moment | 30 ft | 60 ft | 80 ft | 120 ft | 200 ft | |||||
|---|---|---|---|---|---|---|---|---|---|---|
| Bias | V | Bias | V | Bias | V | Bias | V | Bias | V | |
| 1 day | 0.69 | 0.12 | 0.82 | 0.05 | 0.87 | 0.05 | 0.90 | 0.06 | 0.92 | 0.06 |
| 2 weeks | 0.79 | 0.11 | 0.88 | 0.05 | 0.92 | 0.05 | 0.95 | 0.04 | 0.97 | 0.04 |
| 1 month | 0.82 | 0.11 | 0.90 | 0.05 | 0.93 | 0.04 | 0.97 | 0.04 | 0.99 | 0.04 |
| 2 months | 0.84 | 0.11 | 0.92 | 0.06 | 0.95 | 0.04 | 0.98 | 0.04 | 1.00 | 0.04 |
| 6 months | 0.87 | 0.11 | 0.94 | 0.06 | 0.97 | 0.04 | 1.00 | 0.03 | 1.02 | 0.03 |
| 1 year | 0.90 | 0.11 | 0.95 | 0.06 | 0.98 | 0.04 | 1.01 | 0.03 | 1.03 | 0.03 |
| 5 years | 0.94 | 0.11 | 0.97 | 0.07 | 1.00 | 0.05 | 1.03 | 0.03 | 1.06 | 0.03 |
| 50 years | 0.98 | 0.13 | 1.00 | 0.07 | 1.02 | 0.05 | 1.05 | 0.04 | 1.08 | 0.04 |
| 75 years | 0.99 | 0.13 | 1.01 | 0.08 | 1.03 | 0.05 | 1.06 | 0.04 | 1.09 | 0.04 |
| 100 years | 1.00 | 0.13 | 1.01 | 0.08 | 1.03 | 0.06 | 1.06 | 0.04 | 1.09 | 0.04 |
Table B-20. Five-axle SHV statistical parameters of live load moment for ADTT = 5,000.
| Moment | 30 ft | 60 ft | 80 ft | 120 ft | 200 ft | |||||
|---|---|---|---|---|---|---|---|---|---|---|
| Bias | V | Bias | V | Bias | V | Bias | V | Bias | V | |
| 1 day | 0.72 | 0.12 | 0.84 | 0.05 | 0.88 | 0.05 | 0.91 | 0.05 | 0.93 | 0.05 |
| 2 weeks | 0.81 | 0.11 | 0.90 | 0.05 | 0.93 | 0.04 | 0.96 | 0.04 | 0.99 | 0.04 |
| 1 month | 0.84 | 0.11 | 0.92 | 0.06 | 0.95 | 0.04 | 0.98 | 0.04 | 1.00 | 0.04 |
| 2 months | 0.86 | 0.11 | 0.93 | 0.06 | 0.96 | 0.04 | 0.99 | 0.03 | 1.01 | 0.03 |
| 6 months | 0.90 | 0.11 | 0.95 | 0.06 | 0.98 | 0.04 | 1.01 | 0.03 | 1.03 | 0.03 |
| 1 year | 0.91 | 0.11 | 0.96 | 0.06 | 0.99 | 0.04 | 1.02 | 0.03 | 1.04 | 0.03 |
| 5 years | 0.95 | 0.12 | 0.98 | 0.07 | 1.00 | 0.05 | 1.04 | 0.04 | 1.07 | 0.03 |
| 50 years | 1.00 | 0.13 | 1.01 | 0.08 | 1.03 | 0.06 | 1.06 | 0.04 | 1.09 | 0.04 |
| 75 years | 1.00 | 0.13 | 1.01 | 0.08 | 1.03 | 0.06 | 1.06 | 0.04 | 1.10 | 0.04 |
| 100 years | 1.01 | 0.14 | 1.02 | 0.08 | 1.03 | 0.06 | 1.06 | 0.04 | 1.10 | 0.04 |
Table B-21. Five-axle SHV statistical parameters of live load moment for ADTT = 10,000.
| Moment | 30 ft | 60 ft | 80 ft | 120 ft | 200 ft | |||||
|---|---|---|---|---|---|---|---|---|---|---|
| Bias | V | Bias | V | Bias | V | Bias | V | Bias | V | |
| 1 day | 0.74 | 0.12 | 0.86 | 0.05 | 0.90 | 0.05 | 0.93 | 0.05 | 0.94 | 0.05 |
| 2 weeks | 0.84 | 0.11 | 0.91 | 0.06 | 0.95 | 0.04 | 0.98 | 0.04 | 1.00 | 0.04 |
| 1 month | 0.86 | 0.11 | 0.93 | 0.06 | 0.96 | 0.04 | 0.99 | 0.03 | 1.01 | 0.03 |
| 2 months | 0.88 | 0.11 | 0.94 | 0.06 | 0.97 | 0.04 | 1.00 | 0.03 | 1.03 | 0.03 |
| 6 months | 0.91 | 0.11 | 0.96 | 0.06 | 0.99 | 0.04 | 1.02 | 0.03 | 1.04 | 0.03 |
| 1 year | 0.93 | 0.11 | 0.97 | 0.06 | 0.99 | 0.05 | 1.02 | 0.03 | 1.05 | 0.03 |
| 5 years | 0.97 | 0.12 | 0.99 | 0.07 | 1.01 | 0.05 | 1.04 | 0.04 | 1.07 | 0.04 |
| 50 years | 1.01 | 0.14 | 1.02 | 0.08 | 1.03 | 0.06 | 1.06 | 0.04 | 1.10 | 0.04 |
| 75 years | 1.02 | 0.14 | 1.02 | 0.08 | 1.04 | 0.06 | 1.07 | 0.05 | 1.10 | 0.05 |
| 100 years | 1.02 | 0.14 | 1.02 | 0.08 | 1.04 | 0.06 | 1.07 | 0.05 | 1.11 | 0.05 |
Table B-22. Five-axle SHV statistical parameters of live load reaction for ADTT = 250.
| Reaction | 30 ft | 60 ft | 80 ft | 120 ft | 200 ft | |||||
|---|---|---|---|---|---|---|---|---|---|---|
| Bias | V | Bias | V | Bias | V | Bias | V | Bias | V | |
| 1 day | 0.72 | 0.12 | 0.84 | 0.05 | 0.86 | 0.05 | 0.87 | 0.06 | 0.88 | 0.07 |
| 2 weeks | 0.77 | 0.10 | 0.88 | 0.05 | 0.90 | 0.04 | 0.92 | 0.05 | 0.93 | 0.06 |
| 1 month | 0.79 | 0.10 | 0.89 | 0.04 | 0.91 | 0.04 | 0.93 | 0.04 | 0.94 | 0.05 |
| 2 months | 0.80 | 0.09 | 0.90 | 0.04 | 0.93 | 0.04 | 0.94 | 0.04 | 0.96 | 0.05 |
| 6 months | 0.83 | 0.08 | 0.92 | 0.04 | 0.95 | 0.03 | 0.97 | 0.04 | 0.98 | 0.04 |
| 1 year | 0.85 | 0.08 | 0.93 | 0.03 | 0.96 | 0.03 | 0.98 | 0.03 | 1.00 | 0.04 |
| 5 years | 0.88 | 0.06 | 0.96 | 0.03 | 0.98 | 0.03 | 1.01 | 0.03 | 1.03 | 0.03 |
| 50 years | 0.93 | 0.06 | 0.99 | 0.03 | 1.01 | 0.03 | 1.04 | 0.03 | 1.07 | 0.03 |
| 75 years | 0.93 | 0.06 | 0.99 | 0.03 | 1.02 | 0.03 | 1.05 | 0.03 | 1.07 | 0.03 |
| 100 years | 0.94 | 0.06 | 1.00 | 0.03 | 1.02 | 0.03 | 1.05 | 0.03 | 1.08 | 0.03 |
Table B-23. Five-axle SHV statistical parameters of live load reaction for ADTT = 1,000.
| Reaction | 30 ft | 60 ft | 80 ft | 120 ft | 200 ft | |||||
|---|---|---|---|---|---|---|---|---|---|---|
| Bias | V | Bias | V | Bias | V | Bias | V | Bias | V | |
| 1 day | 0.74 | 0.11 | 0.86 | 0.05 | 0.88 | 0.05 | 0.89 | 0.05 | 0.90 | 0.06 |
| 2 weeks | 0.80 | 0.09 | 0.90 | 0.04 | 0.92 | 0.04 | 0.94 | 0.04 | 0.96 | 0.05 |
| 1 month | 0.82 | 0.09 | 0.91 | 0.04 | 0.94 | 0.03 | 0.96 | 0.04 | 0.97 | 0.04 |
| 2 months | 0.84 | 0.08 | 0.93 | 0.04 | 0.95 | 0.03 | 0.97 | 0.03 | 0.99 | 0.04 |
| 6 months | 0.86 | 0.07 | 0.94 | 0.03 | 0.97 | 0.03 | 0.99 | 0.03 | 1.01 | 0.03 |
| 1 year | 0.88 | 0.06 | 0.96 | 0.03 | 0.98 | 0.03 | 1.01 | 0.03 | 1.03 | 0.03 |
| 5 years | 0.91 | 0.06 | 0.98 | 0.03 | 1.00 | 0.03 | 1.03 | 0.03 | 1.05 | 0.03 |
| 50 years | 0.95 | 0.06 | 1.00 | 0.03 | 1.03 | 0.03 | 1.06 | 0.03 | 1.09 | 0.03 |
| 75 years | 0.96 | 0.07 | 1.01 | 0.03 | 1.03 | 0.03 | 1.06 | 0.03 | 1.09 | 0.04 |
| 100 years | 0.96 | 0.07 | 1.01 | 0.04 | 1.03 | 0.03 | 1.07 | 0.03 | 1.10 | 0.04 |
Table B-24. Five-axle SHV statistical parameters of live load reaction for ADTT = 2,500.
| Reaction | 30 ft | 60 ft | 80 ft | 120 ft | 200 ft | |||||
|---|---|---|---|---|---|---|---|---|---|---|
| Bias | V | Bias | V | Bias | V | Bias | V | Bias | V | |
| 1 day | 0.76 | 0.11 | 0.87 | 0.05 | 0.90 | 0.05 | 0.91 | 0.05 | 0.92 | 0.06 |
| 2 weeks | 0.82 | 0.09 | 0.92 | 0.04 | 0.94 | 0.03 | 0.96 | 0.04 | 0.98 | 0.04 |
| 1 month | 0.84 | 0.08 | 0.93 | 0.03 | 0.95 | 0.03 | 0.98 | 0.03 | 0.99 | 0.04 |
| 2 months | 0.86 | 0.07 | 0.94 | 0.03 | 0.97 | 0.03 | 0.99 | 0.03 | 1.01 | 0.03 |
| 6 months | 0.88 | 0.06 | 0.96 | 0.03 | 0.98 | 0.03 | 1.01 | 0.03 | 1.03 | 0.03 |
| 1 year | 0.90 | 0.06 | 0.97 | 0.03 | 0.99 | 0.03 | 1.02 | 0.03 | 1.04 | 0.03 |
| 5 years | 0.93 | 0.06 | 0.99 | 0.03 | 1.01 | 0.03 | 1.04 | 0.03 | 1.07 | 0.03 |
| 50 years | 0.96 | 0.07 | 1.01 | 0.04 | 1.03 | 0.04 | 1.07 | 0.03 | 1.10 | 0.04 |
| 75 years | 0.97 | 0.07 | 1.01 | 0.04 | 1.04 | 0.04 | 1.07 | 0.04 | 1.10 | 0.04 |
| 100 years | 0.97 | 0.07 | 1.02 | 0.04 | 1.04 | 0.04 | 1.07 | 0.04 | 1.11 | 0.04 |
Table B-25. Five-axle SHV statistical parameters of live load reaction for ADTT = 5,000.
| Reaction | 30 ft | 60 ft | 80 ft | 120 ft | 200 ft | |||||
|---|---|---|---|---|---|---|---|---|---|---|
| Bias | V | Bias | V | Bias | V | Bias | V | Bias | V | |
| 1 day | 0.78 | 0.10 | 0.88 | 0.04 | 0.91 | 0.04 | 0.92 | 0.05 | 0.93 | 0.05 |
| 2 weeks | 0.84 | 0.08 | 0.93 | 0.04 | 0.95 | 0.03 | 0.98 | 0.03 | 0.99 | 0.04 |
| 1 month | 0.86 | 0.07 | 0.94 | 0.03 | 0.97 | 0.03 | 0.99 | 0.03 | 1.01 | 0.03 |
| 2 months | 0.88 | 0.07 | 0.95 | 0.03 | 0.98 | 0.03 | 1.00 | 0.03 | 1.02 | 0.03 |
| 6 months | 0.90 | 0.06 | 0.97 | 0.03 | 0.99 | 0.03 | 1.02 | 0.03 | 1.04 | 0.03 |
| 1 year | 0.91 | 0.06 | 0.98 | 0.03 | 1.00 | 0.03 | 1.03 | 0.03 | 1.05 | 0.03 |
| 5 years | 0.94 | 0.06 | 1.00 | 0.03 | 1.02 | 0.03 | 1.05 | 0.03 | 1.08 | 0.03 |
| 50 years | 0.97 | 0.07 | 1.02 | 0.04 | 1.04 | 0.04 | 1.07 | 0.04 | 1.11 | 0.04 |
| 75 years | 0.98 | 0.08 | 1.02 | 0.04 | 1.04 | 0.04 | 1.08 | 0.04 | 1.11 | 0.04 |
| 100 years | 0.98 | 0.08 | 1.02 | 0.04 | 1.05 | 0.04 | 1.08 | 0.04 | 1.11 | 0.04 |
Table B-26. Five-axle SHV statistical parameters of live load reaction for ADTT = 10,000.
| Reaction | 30 ft | 60 ft | 80 ft | 120 ft | 200 ft | |||||
|---|---|---|---|---|---|---|---|---|---|---|
| Bias | V | Bias | V | Bias | V | Bias | V | Bias | V | |
| 1 day | 0.79 | 0.10 | 0.89 | 0.04 | 0.92 | 0.04 | 0.94 | 0.04 | 0.95 | 0.05 |
| 2 weeks | 0.86 | 0.07 | 0.94 | 0.03 | 0.96 | 0.03 | 0.99 | 0.03 | 1.01 | 0.03 |
| 1 month | 0.88 | 0.07 | 0.95 | 0.03 | 0.98 | 0.03 | 1.00 | 0.03 | 1.02 | 0.03 |
| 2 months | 0.89 | 0.06 | 0.96 | 0.03 | 0.99 | 0.03 | 1.01 | 0.03 | 1.04 | 0.03 |
| 6 months | 0.91 | 0.06 | 0.98 | 0.03 | 1.00 | 0.03 | 1.03 | 0.03 | 1.05 | 0.03 |
| 1 year | 0.92 | 0.06 | 0.99 | 0.03 | 1.01 | 0.03 | 1.04 | 0.03 | 1.06 | 0.03 |
| 5 years | 0.95 | 0.06 | 1.00 | 0.03 | 1.03 | 0.03 | 1.06 | 0.03 | 1.09 | 0.03 |
| 50 years | 0.98 | 0.08 | 1.02 | 0.04 | 1.05 | 0.04 | 1.08 | 0.04 | 1.11 | 0.04 |
| 75 years | 0.98 | 0.08 | 1.03 | 0.04 | 1.05 | 0.04 | 1.08 | 0.04 | 1.12 | 0.04 |
| 100 years | 0.99 | 0.08 | 1.03 | 0.04 | 1.05 | 0.04 | 1.09 | 0.04 | 1.12 | 0.05 |
Table B-27. Five-axle SHV statistical parameters of live load negative moment for ADTT = 250.
| Negative Moment | 30 ft | 60 ft | 80 ft | 120 ft | 200 ft | |||||
|---|---|---|---|---|---|---|---|---|---|---|
| Bias | V | Bias | V | Bias | V | Bias | V | Bias | V | |
| 1 day | 0.82 | 0.14 | 0.86 | 0.06 | 0.88 | 0.06 | 0.88 | 0.07 | 0.88 | 0.08 |
| 2 weeks | 0.90 | 0.12 | 0.90 | 0.05 | 0.92 | 0.05 | 0.93 | 0.06 | 0.94 | 0.07 |
| 1 month | 0.92 | 0.11 | 0.91 | 0.05 | 0.94 | 0.05 | 0.95 | 0.05 | 0.95 | 0.06 |
| 2 months | 0.95 | 0.10 | 0.92 | 0.04 | 0.95 | 0.05 | 0.96 | 0.05 | 0.97 | 0.06 |
| 6 months | 0.99 | 0.09 | 0.94 | 0.04 | 0.97 | 0.04 | 0.99 | 0.04 | 1.00 | 0.05 |
| 1 year | 1.01 | 0.08 | 0.95 | 0.04 | 0.98 | 0.04 | 1.01 | 0.04 | 1.02 | 0.04 |
| 5 years | 1.07 | 0.06 | 0.98 | 0.04 | 1.01 | 0.03 | 1.04 | 0.03 | 1.05 | 0.03 |
| 50 years | 1.13 | 0.07 | 1.00 | 0.04 | 1.04 | 0.03 | 1.08 | 0.03 | 1.10 | 0.04 |
| 75 years | 1.14 | 0.08 | 1.01 | 0.04 | 1.04 | 0.03 | 1.08 | 0.03 | 1.10 | 0.04 |
| 100 years | 1.14 | 0.08 | 1.01 | 0.04 | 1.05 | 0.03 | 1.09 | 0.03 | 1.11 | 0.04 |
Table B-28. Five-axle SHV statistical parameters of live load negative moment for ADTT = 1,000.
| Negative Moment | 30 ft | 60 ft | 80 ft | 120 ft | 200 ft | |||||
|---|---|---|---|---|---|---|---|---|---|---|
| Bias | V | Bias | V | Bias | V | Bias | V | Bias | V | |
| 1 day | 0.86 | 0.13 | 0.88 | 0.05 | 0.90 | 0.06 | 0.91 | 0.07 | 0.91 | 0.07 |
| 2 weeks | 0.95 | 0.10 | 0.92 | 0.04 | 0.95 | 0.05 | 0.96 | 0.05 | 0.97 | 0.06 |
| 1 month | 0.97 | 0.09 | 0.93 | 0.04 | 0.96 | 0.04 | 0.98 | 0.05 | 0.99 | 0.05 |
| 2 months | 1.00 | 0.09 | 0.95 | 0.04 | 0.97 | 0.04 | 1.00 | 0.04 | 1.01 | 0.05 |
| 6 months | 1.04 | 0.07 | 0.96 | 0.04 | 0.99 | 0.03 | 1.02 | 0.04 | 1.03 | 0.04 |
| 1 year | 1.06 | 0.06 | 0.97 | 0.04 | 1.01 | 0.03 | 1.03 | 0.03 | 1.05 | 0.03 |
| 5 years | 1.11 | 0.06 | 0.99 | 0.04 | 1.03 | 0.03 | 1.06 | 0.03 | 1.08 | 0.03 |
| 50 years | 1.16 | 0.09 | 1.02 | 0.04 | 1.05 | 0.03 | 1.10 | 0.04 | 1.12 | 0.04 |
| 75 years | 1.17 | 0.09 | 1.02 | 0.04 | 1.06 | 0.03 | 1.10 | 0.04 | 1.12 | 0.04 |
| 100 years | 1.17 | 0.10 | 1.02 | 0.04 | 1.06 | 0.03 | 1.10 | 0.04 | 1.13 | 0.05 |
Table B-29. Five-axle SHV statistical parameters of live load negative moment for ADTT = 2,500.
| Negative Moment | 30 ft | 60 ft | 80 ft | 120 ft | 200 ft | |||||
|---|---|---|---|---|---|---|---|---|---|---|
| Bias | V | Bias | V | Bias | V | Bias | V | Bias | V | |
| 1 day | 0.89 | 0.12 | 0.89 | 0.05 | 0.92 | 0.05 | 0.92 | 0.06 | 0.93 | 0.07 |
| 2 weeks | 0.98 | 0.09 | 0.94 | 0.04 | 0.97 | 0.04 | 0.98 | 0.05 | 0.99 | 0.05 |
| 1 month | 1.01 | 0.08 | 0.95 | 0.04 | 0.98 | 0.04 | 1.00 | 0.04 | 1.01 | 0.04 |
| 2 months | 1.03 | 0.07 | 0.96 | 0.04 | 0.99 | 0.03 | 1.02 | 0.04 | 1.03 | 0.04 |
| 6 months | 1.07 | 0.06 | 0.98 | 0.04 | 1.01 | 0.03 | 1.04 | 0.03 | 1.05 | 0.03 |
| 1 year | 1.09 | 0.06 | 0.99 | 0.04 | 1.02 | 0.03 | 1.05 | 0.03 | 1.07 | 0.03 |
| 5 years | 1.13 | 0.07 | 1.00 | 0.04 | 1.04 | 0.03 | 1.08 | 0.03 | 1.10 | 0.04 |
| 50 years | 1.18 | 0.10 | 1.02 | 0.05 | 1.06 | 0.03 | 1.11 | 0.04 | 1.13 | 0.05 |
| 75 years | 1.18 | 0.10 | 1.03 | 0.05 | 1.07 | 0.04 | 1.11 | 0.04 | 1.14 | 0.05 |
| 100 years | 1.19 | 0.11 | 1.03 | 0.05 | 1.07 | 0.04 | 1.12 | 0.04 | 1.14 | 0.05 |
Table B-30. Five-axle SHV statistical parameters of live load negative moment for ADTT = 5,000.
| Negative Moment | 30 ft | 60 ft | 80 ft | 120 ft | 200 ft | |||||
|---|---|---|---|---|---|---|---|---|---|---|
| Bias | V | Bias | V | Bias | V | Bias | V | Bias | V | |
| 1 day | 0.91 | 0.12 | 0.90 | 0.05 | 0.93 | 0.05 | 0.94 | 0.06 | 0.94 | 0.06 |
| 2 weeks | 1.00 | 0.08 | 0.95 | 0.04 | 0.98 | 0.04 | 1.00 | 0.04 | 1.01 | 0.04 |
| 1 month | 1.03 | 0.07 | 0.96 | 0.04 | 0.99 | 0.03 | 1.02 | 0.04 | 1.03 | 0.04 |
| 2 months | 1.05 | 0.07 | 0.97 | 0.04 | 1.00 | 0.03 | 1.03 | 0.03 | 1.05 | 0.04 |
| 6 months | 1.09 | 0.06 | 0.98 | 0.04 | 1.02 | 0.03 | 1.05 | 0.03 | 1.07 | 0.03 |
| 1 year | 1.11 | 0.06 | 0.99 | 0.04 | 1.03 | 0.03 | 1.06 | 0.03 | 1.08 | 0.03 |
| 5 years | 1.14 | 0.08 | 1.01 | 0.04 | 1.05 | 0.03 | 1.09 | 0.03 | 1.11 | 0.04 |
| 50 years | 1.19 | 0.11 | 1.03 | 0.05 | 1.07 | 0.04 | 1.12 | 0.04 | 1.14 | 0.05 |
| 75 years | 1.20 | 0.11 | 1.03 | 0.05 | 1.07 | 0.04 | 1.12 | 0.04 | 1.14 | 0.05 |
| 100 years | 1.20 | 0.12 | 1.04 | 0.05 | 1.08 | 0.04 | 1.12 | 0.05 | 1.15 | 0.05 |
Table B-31. Five-axle SHV statistical parameters of live load negative moment for ADTT = 10,000.
| Negative Moment | 30 ft | 60 ft | 80 ft | 120 ft | 200 ft | |||||
|---|---|---|---|---|---|---|---|---|---|---|
| Bias | V | Bias | V | Bias | V | Bias | V | Bias | V | |
| 1 day | 0.93 | 0.11 | 0.92 | 0.04 | 0.94 | 0.05 | 0.95 | 0.05 | 0.96 | 0.06 |
| 2 weeks | 1.03 | 0.07 | 0.96 | 0.04 | 0.99 | 0.03 | 1.01 | 0.04 | 1.03 | 0.04 |
| 1 month | 1.05 | 0.07 | 0.97 | 0.04 | 1.00 | 0.03 | 1.03 | 0.03 | 1.05 | 0.04 |
| 2 months | 1.07 | 0.06 | 0.98 | 0.04 | 1.01 | 0.03 | 1.04 | 0.03 | 1.06 | 0.03 |
| 6 months | 1.10 | 0.06 | 0.99 | 0.04 | 1.03 | 0.03 | 1.06 | 0.03 | 1.08 | 0.03 |
| 1 year | 1.12 | 0.07 | 1.00 | 0.04 | 1.04 | 0.03 | 1.07 | 0.03 | 1.09 | 0.03 |
| 5 years | 1.16 | 0.09 | 1.02 | 0.04 | 1.05 | 0.03 | 1.10 | 0.04 | 1.12 | 0.04 |
| 50 years | 1.20 | 0.12 | 1.04 | 0.05 | 1.08 | 0.04 | 1.12 | 0.05 | 1.15 | 0.05 |
| 75 years | 1.21 | 0.12 | 1.04 | 0.05 | 1.08 | 0.04 | 1.13 | 0.05 | 1.15 | 0.06 |
| 100 years | 1.21 | 0.12 | 1.04 | 0.05 | 1.08 | 0.04 | 1.13 | 0.05 | 1.16 | 0.06 |
Table B-32. Six-axle SHV statistical parameters of live load moment for ADTT = 250.
| Moment | 30 ft | 60 ft | 80 ft | 120 ft | 200 ft | |||||
|---|---|---|---|---|---|---|---|---|---|---|
| Bias | V | Bias | V | Bias | V | Bias | V | Bias | V | |
| 1 day | 0.37 | 0.03 | 0.46 | 0.09 | 0.47 | 0.13 | 0.47 | 0.16 | 0.48 | 0.18 |
| 2 weeks | 0.45 | 0.02 | 0.54 | 0.08 | 0.55 | 0.11 | 0.57 | 0.13 | 0.58 | 0.15 |
| 1 month | 0.47 | 0.02 | 0.57 | 0.07 | 0.58 | 0.10 | 0.60 | 0.12 | 0.61 | 0.14 |
| 2 months | 0.50 | 0.02 | 0.60 | 0.07 | 0.61 | 0.09 | 0.63 | 0.11 | 0.64 | 0.13 |
| 6 months | 0.54 | 0.01 | 0.65 | 0.06 | 0.67 | 0.08 | 0.68 | 0.10 | 0.70 | 0.11 |
| 1 year | 0.58 | 0.01 | 0.68 | 0.06 | 0.70 | 0.07 | 0.72 | 0.09 | 0.74 | 0.10 |
| 5 years | 0.67 | 0.00 | 0.78 | 0.04 | 0.80 | 0.05 | 0.83 | 0.05 | 0.85 | 0.06 |
| 50 years | 0.80 | 0.03 | 0.91 | 0.00 | 0.95 | 0.00 | 0.99 | 0.01 | 1.01 | 0.01 |
| 75 years | 0.82 | 0.03 | 0.94 | 0.00 | 0.98 | 0.01 | 1.01 | 0.02 | 1.04 | 0.02 |
| 100 years | 0.83 | 0.04 | 0.95 | 0.01 | 0.99 | 0.02 | 1.03 | 0.02 | 1.06 | 0.03 |
Table B-33. Six-axle SHV statistical parameters of live load moment for ADTT = 1,000.
| Moment | 30 ft | 60 ft | 80 ft | 120 ft | 200 ft | |||||
|---|---|---|---|---|---|---|---|---|---|---|
| Bias | V | Bias | V | Bias | V | Bias | V | Bias | V | |
| 1 day | 0.41 | 0.03 | 0.50 | 0.09 | 0.51 | 0.12 | 0.52 | 0.15 | 0.53 | 0.17 |
| 2 weeks | 0.50 | 0.02 | 0.59 | 0.07 | 0.61 | 0.09 | 0.63 | 0.11 | 0.64 | 0.13 |
| 1 month | 0.53 | 0.01 | 0.63 | 0.06 | 0.65 | 0.09 | 0.66 | 0.10 | 0.67 | 0.12 |
| 2 months | 0.56 | 0.01 | 0.66 | 0.06 | 0.68 | 0.08 | 0.70 | 0.09 | 0.71 | 0.10 |
| 6 months | 0.61 | 0.01 | 0.72 | 0.05 | 0.74 | 0.06 | 0.77 | 0.07 | 0.78 | 0.08 |
| 1 year | 0.65 | 0.00 | 0.76 | 0.04 | 0.79 | 0.05 | 0.81 | 0.06 | 0.83 | 0.06 |
| 5 years | 0.75 | 0.02 | 0.86 | 0.02 | 0.90 | 0.02 | 0.93 | 0.02 | 0.95 | 0.02 |
| 50 years | 0.86 | 0.04 | 0.98 | 0.02 | 1.03 | 0.03 | 1.07 | 0.04 | 1.10 | 0.05 |
| 75 years | 0.88 | 0.05 | 1.00 | 0.02 | 1.05 | 0.03 | 1.09 | 0.05 | 1.12 | 0.06 |
| 100 years | 0.89 | 0.05 | 1.01 | 0.02 | 1.06 | 0.04 | 1.10 | 0.05 | 1.13 | 0.06 |
Table B-34. Six-axle SHV statistical parameters of live load moment for ADTT = 2,500.
| Moment | 30 ft | 60 ft | 80 ft | 120 ft | 200 ft | |||||
|---|---|---|---|---|---|---|---|---|---|---|
| Bias | V | Bias | V | Bias | V | Bias | V | Bias | V | |
| 1 day | 0.43 | 0.02 | 0.53 | 0.08 | 0.54 | 0.11 | 0.55 | 0.14 | 0.56 | 0.15 |
| 2 weeks | 0.53 | 0.01 | 0.63 | 0.06 | 0.65 | 0.08 | 0.67 | 0.10 | 0.68 | 0.11 |
| 1 month | 0.57 | 0.01 | 0.67 | 0.06 | 0.69 | 0.07 | 0.71 | 0.09 | 0.73 | 0.10 |
| 2 months | 0.60 | 0.01 | 0.71 | 0.05 | 0.73 | 0.06 | 0.75 | 0.08 | 0.77 | 0.09 |
| 6 months | 0.67 | 0.00 | 0.77 | 0.04 | 0.80 | 0.05 | 0.83 | 0.05 | 0.85 | 0.06 |
| 1 year | 0.71 | 0.01 | 0.82 | 0.03 | 0.85 | 0.03 | 0.88 | 0.04 | 0.90 | 0.04 |
| 5 years | 0.80 | 0.03 | 0.91 | 0.00 | 0.95 | 0.00 | 0.99 | 0.01 | 1.01 | 0.01 |
| 50 years | 0.90 | 0.05 | 1.02 | 0.03 | 1.07 | 0.04 | 1.11 | 0.06 | 1.14 | 0.07 |
| 75 years | 0.92 | 0.06 | 1.04 | 0.03 | 1.09 | 0.05 | 1.13 | 0.06 | 1.16 | 0.07 |
| 100 years | 0.93 | 0.06 | 1.05 | 0.03 | 1.10 | 0.05 | 1.14 | 0.07 | 1.17 | 0.08 |
Table B-35. Six-axle SHV statistical parameters of live load moment for ADTT = 5,000.
| Moment | 30 ft | 60 ft | 80 ft | 120 ft | 200 ft | |||||
|---|---|---|---|---|---|---|---|---|---|---|
| Bias | V | Bias | V | Bias | V | Bias | V | Bias | V | |
| 1 day | 0.46 | 0.02 | 0.55 | 0.08 | 0.57 | 0.10 | 0.58 | 0.13 | 0.59 | 0.15 |
| 2 weeks | 0.57 | 0.01 | 0.67 | 0.06 | 0.69 | 0.08 | 0.71 | 0.09 | 0.72 | 0.10 |
| 1 month | 0.60 | 0.01 | 0.71 | 0.05 | 0.73 | 0.06 | 0.75 | 0.08 | 0.77 | 0.09 |
| 2 months | 0.64 | 0.00 | 0.75 | 0.04 | 0.78 | 0.05 | 0.80 | 0.06 | 0.82 | 0.07 |
| 6 months | 0.71 | 0.01 | 0.82 | 0.03 | 0.85 | 0.03 | 0.88 | 0.04 | 0.90 | 0.04 |
| 1 year | 0.75 | 0.02 | 0.86 | 0.02 | 0.90 | 0.02 | 0.93 | 0.02 | 0.95 | 0.02 |
| 5 years | 0.83 | 0.04 | 0.95 | 0.01 | 0.99 | 0.02 | 1.03 | 0.02 | 1.06 | 0.03 |
| 50 years | 0.93 | 0.06 | 1.05 | 0.03 | 1.10 | 0.05 | 1.14 | 0.07 | 1.17 | 0.08 |
| 75 years | 0.94 | 0.06 | 1.06 | 0.04 | 1.11 | 0.06 | 1.16 | 0.08 | 1.19 | 0.09 |
| 100 years | 0.95 | 0.06 | 1.07 | 0.04 | 1.12 | 0.06 | 1.17 | 0.08 | 1.20 | 0.09 |
Table B-36. Six-axle SHV statistical parameters of live load moment for ADTT = 10,000.
| Moment | 30 ft | 60 ft | 80 ft | 120 ft | 200 ft | |||||
|---|---|---|---|---|---|---|---|---|---|---|
| Bias | V | Bias | V | Bias | V | Bias | V | Bias | V | |
| 1 day | 0.48 | 0.02 | 0.58 | 0.07 | 0.60 | 0.10 | 0.61 | 0.12 | 0.62 | 0.13 |
| 2 weeks | 0.60 | 0.01 | 0.70 | 0.05 | 0.73 | 0.07 | 0.75 | 0.08 | 0.77 | 0.09 |
| 1 month | 0.64 | 0.00 | 0.75 | 0.04 | 0.78 | 0.05 | 0.80 | 0.06 | 0.82 | 0.07 |
| 2 months | 0.68 | 0.00 | 0.79 | 0.04 | 0.82 | 0.04 | 0.85 | 0.05 | 0.87 | 0.05 |
| 6 months | 0.75 | 0.02 | 0.86 | 0.02 | 0.90 | 0.02 | 0.93 | 0.02 | 0.95 | 0.02 |
| 1 year | 0.79 | 0.03 | 0.90 | 0.01 | 0.94 | 0.00 | 0.97 | 0.00 | 1.00 | 0.00 |
| 5 years | 0.86 | 0.04 | 0.98 | 0.02 | 1.03 | 0.03 | 1.07 | 0.04 | 1.10 | 0.05 |
| 50 years | 0.95 | 0.06 | 1.07 | 0.04 | 1.12 | 0.06 | 1.17 | 0.08 | 1.20 | 0.09 |
| 75 years | 0.96 | 0.07 | 1.09 | 0.04 | 1.14 | 0.07 | 1.18 | 0.09 | 1.22 | 0.10 |
| 100 years | 0.97 | 0.07 | 1.10 | 0.05 | 1.15 | 0.07 | 1.20 | 0.09 | 1.23 | 0.10 |
Table B-37. Six-axle SHV statistical parameters of live load reaction for ADTT = 250.
| Reaction | 30 ft | 60 ft | 80 ft | 120 ft | 200 ft | |||||
|---|---|---|---|---|---|---|---|---|---|---|
| Bias | V | Bias | V | Bias | V | Bias | V | Bias | V | |
| 1 day | 0.39 | 0.09 | 0.46 | 0.14 | 0.47 | 0.16 | 0.48 | 0.18 | 0.48 | 0.20 |
| 2 weeks | 0.49 | 0.06 | 0.56 | 0.11 | 0.57 | 0.13 | 0.57 | 0.15 | 0.58 | 0.16 |
| 1 month | 0.52 | 0.06 | 0.59 | 0.10 | 0.60 | 0.12 | 0.61 | 0.14 | 0.61 | 0.15 |
| 2 months | 0.56 | 0.05 | 0.62 | 0.10 | 0.63 | 0.11 | 0.64 | 0.13 | 0.65 | 0.14 |
| 6 months | 0.61 | 0.03 | 0.68 | 0.08 | 0.69 | 0.09 | 0.70 | 0.11 | 0.71 | 0.11 |
| 1 year | 0.66 | 0.02 | 0.72 | 0.07 | 0.73 | 0.08 | 0.74 | 0.09 | 0.75 | 0.10 |
| 5 years | 0.77 | 0.00 | 0.83 | 0.04 | 0.84 | 0.04 | 0.85 | 0.05 | 0.86 | 0.06 |
| 50 years | 0.94 | 0.06 | 1.00 | 0.02 | 1.01 | 0.02 | 1.02 | 0.02 | 1.03 | 0.02 |
| 75 years | 0.96 | 0.07 | 1.02 | 0.03 | 1.04 | 0.03 | 1.05 | 0.03 | 1.06 | 0.03 |
| 100 years | 0.98 | 0.07 | 1.04 | 0.04 | 1.05 | 0.04 | 1.07 | 0.04 | 1.08 | 0.04 |
Table B-38. Six-axle SHV statistical parameters of live load reaction for ADTT = 1,000.
| Reaction | 30 ft | 60 ft | 80 ft | 120 ft | 200 ft | |||||
|---|---|---|---|---|---|---|---|---|---|---|
| Bias | V | Bias | V | Bias | V | Bias | V | Bias | V | |
| 1 day | 0.44 | 0.08 | 0.51 | 0.13 | 0.52 | 0.15 | 0.53 | 0.17 | 0.53 | 0.18 |
| 2 weeks | 0.55 | 0.05 | 0.62 | 0.10 | 0.63 | 0.11 | 0.64 | 0.13 | 0.64 | 0.14 |
| 1 month | 0.59 | 0.04 | 0.66 | 0.09 | 0.67 | 0.10 | 0.68 | 0.11 | 0.68 | 0.12 |
| 2 months | 0.63 | 0.03 | 0.70 | 0.08 | 0.71 | 0.09 | 0.72 | 0.10 | 0.72 | 0.11 |
| 6 months | 0.70 | 0.01 | 0.77 | 0.06 | 0.78 | 0.07 | 0.79 | 0.08 | 0.79 | 0.08 |
| 1 year | 0.75 | 0.00 | 0.82 | 0.04 | 0.83 | 0.05 | 0.84 | 0.06 | 0.85 | 0.06 |
| 5 years | 0.87 | 0.04 | 0.93 | 0.00 | 0.95 | 0.00 | 0.96 | 0.01 | 0.97 | 0.01 |
| 50 years | 1.02 | 0.09 | 1.08 | 0.06 | 1.09 | 0.06 | 1.11 | 0.06 | 1.12 | 0.06 |
| 75 years | 1.04 | 0.09 | 1.10 | 0.07 | 1.12 | 0.07 | 1.13 | 0.07 | 1.14 | 0.07 |
| 100 years | 1.06 | 0.10 | 1.11 | 0.07 | 1.13 | 0.07 | 1.15 | 0.07 | 1.16 | 0.07 |
Table B-39. Six-axle SHV statistical parameters of live load reaction for ADTT = 2,500.
| Reaction | 30 ft | 60 ft | 80 ft | 120 ft | 200 ft | |||||
|---|---|---|---|---|---|---|---|---|---|---|
| Bias | V | Bias | V | Bias | V | Bias | V | Bias | V | |
| 1 day | 0.48 | 0.07 | 0.55 | 0.12 | 0.55 | 0.14 | 0.56 | 0.15 | 0.57 | 0.16 |
| 2 weeks | 0.60 | 0.04 | 0.67 | 0.08 | 0.68 | 0.10 | 0.69 | 0.11 | 0.69 | 0.12 |
| 1 month | 0.65 | 0.03 | 0.71 | 0.07 | 0.72 | 0.08 | 0.73 | 0.10 | 0.74 | 0.10 |
| 2 months | 0.69 | 0.02 | 0.75 | 0.06 | 0.77 | 0.07 | 0.77 | 0.08 | 0.78 | 0.09 |
| 6 months | 0.77 | 0.00 | 0.83 | 0.04 | 0.84 | 0.04 | 0.85 | 0.05 | 0.86 | 0.06 |
| 1 year | 0.82 | 0.02 | 0.88 | 0.02 | 0.90 | 0.03 | 0.91 | 0.03 | 0.92 | 0.04 |
| 5 years | 0.94 | 0.06 | 1.00 | 0.02 | 1.01 | 0.02 | 1.02 | 0.02 | 1.03 | 0.02 |
| 50 years | 1.07 | 0.10 | 1.12 | 0.08 | 1.14 | 0.08 | 1.16 | 0.08 | 1.17 | 0.08 |
| 75 years | 1.09 | 0.11 | 1.14 | 0.08 | 1.16 | 0.08 | 1.18 | 0.09 | 1.19 | 0.09 |
| 100 years | 1.10 | 0.11 | 1.15 | 0.09 | 1.17 | 0.09 | 1.19 | 0.09 | 1.20 | 0.09 |
Table B-40. Six-axle SHV statistical parameters of live load reaction for ADTT = 5,000.
| Reaction | 30 ft | 60 ft | 80 ft | 120 ft | 200 ft | |||||
|---|---|---|---|---|---|---|---|---|---|---|
| Bias | V | Bias | V | Bias | V | Bias | V | Bias | V | |
| 1 day | 0.51 | 0.06 | 0.57 | 0.11 | 0.58 | 0.13 | 0.59 | 0.14 | 0.59 | 0.15 |
| 2 weeks | 0.64 | 0.03 | 0.71 | 0.07 | 0.72 | 0.09 | 0.73 | 0.10 | 0.73 | 0.11 |
| 1 month | 0.69 | 0.02 | 0.75 | 0.06 | 0.77 | 0.07 | 0.77 | 0.08 | 0.78 | 0.09 |
| 2 months | 0.74 | 0.00 | 0.80 | 0.05 | 0.81 | 0.05 | 0.82 | 0.06 | 0.83 | 0.07 |
| 6 months | 0.82 | 0.02 | 0.88 | 0.02 | 0.89 | 0.03 | 0.91 | 0.03 | 0.91 | 0.04 |
| 1 year | 0.87 | 0.04 | 0.93 | 0.00 | 0.95 | 0.00 | 0.96 | 0.01 | 0.97 | 0.01 |
| 5 years | 0.98 | 0.07 | 1.04 | 0.04 | 1.05 | 0.04 | 1.07 | 0.04 | 1.08 | 0.04 |
| 50 years | 1.10 | 0.11 | 1.15 | 0.09 | 1.17 | 0.09 | 1.19 | 0.09 | 1.20 | 0.09 |
| 75 years | 1.12 | 0.12 | 1.17 | 0.09 | 1.19 | 0.10 | 1.21 | 0.10 | 1.22 | 0.10 |
| 100 years | 1.13 | 0.12 | 1.18 | 0.10 | 1.20 | 0.10 | 1.22 | 0.11 | 1.23 | 0.11 |
Table B-41. Six-axle SHV statistical parameters of live load reaction for ADTT = 10,000.
| Reaction | 30 ft | 60 ft | 80 ft | 120 ft | 200 ft | |||||
|---|---|---|---|---|---|---|---|---|---|---|
| Bias | V | Bias | V | Bias | V | Bias | V | Bias | V | |
| 1 day | 0.54 | 0.05 | 0.61 | 0.10 | 0.61 | 0.12 | 0.62 | 0.13 | 0.63 | 0.14 |
| 2 weeks | 0.69 | 0.02 | 0.75 | 0.06 | 0.76 | 0.07 | 0.77 | 0.08 | 0.78 | 0.09 |
| 1 month | 0.74 | 0.00 | 0.80 | 0.05 | 0.81 | 0.05 | 0.82 | 0.06 | 0.83 | 0.07 |
| 2 months | 0.79 | 0.01 | 0.85 | 0.03 | 0.86 | 0.04 | 0.88 | 0.04 | 0.88 | 0.05 |
| 6 months | 0.87 | 0.03 | 0.93 | 0.00 | 0.95 | 0.01 | 0.96 | 0.01 | 0.97 | 0.01 |
| 1 year | 0.92 | 0.05 | 0.98 | 0.02 | 1.00 | 0.02 | 1.01 | 0.01 | 1.02 | 0.01 |
| 5 years | 1.02 | 0.09 | 1.08 | 0.06 | 1.09 | 0.06 | 1.11 | 0.06 | 1.12 | 0.06 |
| 50 years | 1.13 | 0.12 | 1.18 | 0.10 | 1.20 | 0.10 | 1.22 | 0.11 | 1.23 | 0.11 |
| 75 years | 1.14 | 0.13 | 1.20 | 0.10 | 1.22 | 0.11 | 1.24 | 0.11 | 1.25 | 0.12 |
| 100 years | 1.16 | 0.13 | 1.21 | 0.11 | 1.23 | 0.11 | 1.25 | 0.12 | 1.26 | 0.12 |
Table B-42. Six-axle SHV statistical parameters of live load negative moment for ADTT = 250.
| Negative Moment | 30 ft | 60 ft | 80 ft | 120 ft | 200 ft | |||||
|---|---|---|---|---|---|---|---|---|---|---|
| Bias | V | Bias | V | Bias | V | Bias | V | Bias | V | |
| 1 day | 0.51 | 0.10 | 0.49 | 0.14 | 0.49 | 0.17 | 0.49 | 0.19 | 0.49 | 0.21 |
| 2 weeks | 0.59 | 0.09 | 0.57 | 0.11 | 0.58 | 0.14 | 0.58 | 0.16 | 0.59 | 0.17 |
| 1 month | 0.62 | 0.08 | 0.60 | 0.11 | 0.61 | 0.13 | 0.62 | 0.15 | 0.62 | 0.16 |
| 2 months | 0.65 | 0.08 | 0.63 | 0.10 | 0.64 | 0.12 | 0.65 | 0.14 | 0.65 | 0.14 |
| 6 months | 0.70 | 0.08 | 0.69 | 0.09 | 0.70 | 0.10 | 0.71 | 0.12 | 0.71 | 0.12 |
| 1 year | 0.74 | 0.07 | 0.72 | 0.08 | 0.74 | 0.09 | 0.75 | 0.10 | 0.76 | 0.11 |
| 5 years | 0.84 | 0.06 | 0.82 | 0.05 | 0.85 | 0.06 | 0.86 | 0.06 | 0.87 | 0.06 |
| 50 years | 0.99 | 0.03 | 0.98 | 0.00 | 1.01 | 0.01 | 1.03 | 0.01 | 1.04 | 0.01 |
| 75 years | 1.01 | 0.03 | 1.00 | 0.01 | 1.03 | 0.02 | 1.06 | 0.02 | 1.07 | 0.02 |
| 100 years | 1.03 | 0.02 | 1.01 | 0.02 | 1.05 | 0.02 | 1.07 | 0.03 | 1.09 | 0.03 |
Table B-43. Six-axle SHV statistical parameters of live load negative moment for ADTT = 1,000.
| Negative Moment | 30 ft | 60 ft | 80 ft | 120 ft | 200 ft | |||||
|---|---|---|---|---|---|---|---|---|---|---|
| Bias | V | Bias | V | Bias | V | Bias | V | Bias | V | |
| 1 day | 0.55 | 0.09 | 0.53 | 0.13 | 0.53 | 0.16 | 0.53 | 0.18 | 0.54 | 0.19 |
| 2 weeks | 0.65 | 0.08 | 0.63 | 0.10 | 0.64 | 0.12 | 0.65 | 0.14 | 0.65 | 0.15 |
| 1 month | 0.68 | 0.08 | 0.66 | 0.09 | 0.68 | 0.11 | 0.69 | 0.12 | 0.69 | 0.13 |
| 2 months | 0.72 | 0.08 | 0.70 | 0.08 | 0.71 | 0.10 | 0.72 | 0.11 | 0.73 | 0.12 |
| 6 months | 0.78 | 0.07 | 0.76 | 0.07 | 0.78 | 0.08 | 0.79 | 0.09 | 0.80 | 0.09 |
| 1 year | 0.83 | 0.06 | 0.81 | 0.05 | 0.83 | 0.06 | 0.85 | 0.07 | 0.85 | 0.07 |
| 5 years | 0.93 | 0.04 | 0.92 | 0.02 | 0.95 | 0.02 | 0.97 | 0.02 | 0.98 | 0.02 |
| 50 years | 1.06 | 0.01 | 1.05 | 0.03 | 1.09 | 0.04 | 1.11 | 0.05 | 1.13 | 0.05 |
| 75 years | 1.08 | 0.01 | 1.07 | 0.04 | 1.11 | 0.05 | 1.14 | 0.06 | 1.15 | 0.06 |
| 100 years | 1.09 | 0.01 | 1.08 | 0.04 | 1.12 | 0.05 | 1.15 | 0.06 | 1.16 | 0.07 |
Table B-44. Six-axle SHV statistical parameters of live load negative moment for ADTT = 2,500.
| Negative Moment | 30 ft | 60 ft | 80 ft | 120 ft | 200 ft | |||||
|---|---|---|---|---|---|---|---|---|---|---|
| Bias | V | Bias | V | Bias | V | Bias | V | Bias | V | |
| 1 day | 0.58 | 0.09 | 0.56 | 0.12 | 0.57 | 0.14 | 0.57 | 0.16 | 0.57 | 0.17 |
| 2 weeks | 0.69 | 0.08 | 0.67 | 0.09 | 0.68 | 0.11 | 0.69 | 0.12 | 0.70 | 0.13 |
| 1 month | 0.73 | 0.07 | 0.71 | 0.08 | 0.73 | 0.09 | 0.74 | 0.11 | 0.74 | 0.11 |
| 2 months | 0.77 | 0.07 | 0.75 | 0.07 | 0.77 | 0.08 | 0.78 | 0.09 | 0.79 | 0.10 |
| 6 months | 0.84 | 0.06 | 0.82 | 0.05 | 0.85 | 0.06 | 0.86 | 0.06 | 0.87 | 0.06 |
| 1 year | 0.89 | 0.05 | 0.87 | 0.03 | 0.90 | 0.04 | 0.91 | 0.04 | 0.92 | 0.04 |
| 5 years | 0.99 | 0.03 | 0.98 | 0.00 | 1.01 | 0.01 | 1.03 | 0.01 | 1.04 | 0.01 |
| 50 years | 1.10 | 0.00 | 1.09 | 0.05 | 1.13 | 0.06 | 1.16 | 0.07 | 1.18 | 0.08 |
| 75 years | 1.12 | 0.00 | 1.11 | 0.05 | 1.15 | 0.07 | 1.18 | 0.08 | 1.20 | 0.08 |
| 100 years | 1.13 | 0.00 | 1.12 | 0.06 | 1.16 | 0.07 | 1.19 | 0.08 | 1.21 | 0.09 |
Table B-45. Six-axle SHV statistical parameters of live load negative moment for ADTT = 5,000.
| Negative Moment | 30 ft | 60 ft | 80 ft | 120 ft | 200 ft | |||||
|---|---|---|---|---|---|---|---|---|---|---|
| Bias | V | Bias | V | Bias | V | Bias | V | Bias V | ||
| 1 day | 0.61 | 0.09 | 0.59 | 0.11 | 0.59 | 0.14 | 0.60 | 0.15 | 0.60 | 0.16 |
| 2 weeks | 0.73 | 0.07 | 0.71 | 0.08 | 0.72 | 0.10 | 0.73 | 0.11 | 0.74 | 0.11 |
| 1 month | 0.77 | 0.07 | 0.75 | 0.07 | 0.77 | 0.08 | 0.78 | 0.09 | 0.79 | 0.10 |
| 2 months | 0.81 | 0.06 | 0.80 | 0.06 | 0.82 | 0.07 | 0.83 | 0.07 | 0.84 | 0.08 |
| 6 months | 0.89 | 0.05 | 0.87 | 0.04 | 0.90 | 0.04 | 0.91 | 0.04 | 0.92 | 0.04 |
| 1 year | 0.93 | 0.04 | 0.92 | 0.02 | 0.95 | 0.02 | 0.97 | 0.02 | 0.98 | 0.02 |
| 5 years | 1.03 | 0.02 | 1.01 | 0.02 | 1.05 | 0.02 | 1.07 | 0.03 | 1.09 | 0.03 |
| 50 years | 1.13 | 0.00 | 1.12 | 0.06 | 1.16 | 0.07 | 1.19 | 0.08 | 1.21 | 0.09 |
| 75 years | 1.15 | 0.00 | 1.14 | 0.06 | 1.18 | 0.08 | 1.21 | 0.09 | 1.23 | 0.10 |
| 100 years | 1.16 | 0.01 | 1.15 | 0.06 | 1.19 | 0.08 | 1.22 | 0.10 | 1.24 | 0.10 |
Table B-46. Six-axle SHV statistical parameters of live load negative moment for ADTT = 10,000.
| Negative Moment | 30 ft | 60 ft | 80 ft | 120 ft | 200 ft | |||||
|---|---|---|---|---|---|---|---|---|---|---|
| Bias | V | Bias | V | Bias | V | Bias | V | Bias | V | |
| 1 day | 0.64 | 0.08 | 0.62 | 0.10 | 0.62 | 0.13 | 0.63 | 0.14 | 0.63 | 0.15 |
| 2 weeks | 0.77 | 0.07 | 0.75 | 0.07 | 0.77 | 0.08 | 0.78 | 0.09 | 0.78 | 0.10 |
| 1 month | 0.81 | 0.06 | 0.80 | 0.06 | 0.82 | 0.07 | 0.83 | 0.07 | 0.84 | 0.08 |
| 2 months | 0.86 | 0.06 | 0.84 | 0.04 | 0.87 | 0.05 | 0.88 | 0.05 | 0.89 | 0.06 |
| 6 months | 0.93 | 0.04 | 0.92 | 0.02 | 0.94 | 0.02 | 0.96 | 0.02 | 0.97 | 0.02 |
| 1 year | 0.98 | 0.03 | 0.96 | 0.00 | 0.99 | 0.00 | 1.01 | 0.00 | 1.03 | 0.00 |
| 5 years | 1.06 | 0.01 | 1.05 | 0.03 | 1.09 | 0.04 | 1.11 | 0.05 | 1.13 | 0.05 |
| 50 years | 1.16 | 0.01 | 1.15 | 0.06 | 1.19 | 0.08 | 1.22 | 0.10 | 1.24 | 0.10 |
| 75 years | 1.17 | 0.01 | 1.16 | 0.07 | 1.21 | 0.09 | 1.24 | 0.10 | 1.26 | 0.11 |
| 100 years | 1.18 | 0.01 | 1.17 | 0.07 | 1.22 | 0.09 | 1.25 | 0.11 | 1.27 | 0.12 |
B.2 FAST Act Emergency Vehicles
Lou et al. (2021) developed an algorithm to identify emergency vehicles (EVs) from the WIM data, as shown in Figure B-2. The algorithm consists of filtering out the erroneous and car readings and identifying EV traffic fleet based on the axle spacings and weights. The potential EV fleet is screened based on the typical EV configurations provided by Emergency Vehicle Size and Weight Regulation Guideline (Fire Apparatus Manufacturers’ Association 2017), which is also the basis for FHWA to develop the FAST Act EV2 and EV3 (FHWA 2016). Table B-47 shows the counts of EV2 and EV3 from each WIM site.
The procedures to develop the live load statistics are the same as those described previously. For EVs, the development of the statistical live load model considered two loading scenarios: (1) single EV loading event and (2) multiple presence (MP) loading event. However, for the
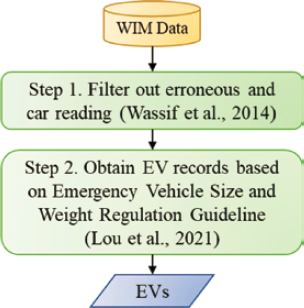
Table B-47. EV counts from each WIM site.
| Source | Site ID | Qualified Truck # | EV2 # | EV3 # |
|---|---|---|---|---|
| FHWA Data | AR2 | 1675235 | 146 | 612 |
| AZ1 | 35572 | 40 | 371 | |
| AZ2 | 1430424 | 472 | 1403 | |
| CO2 | 343580 | 34 | 450 | |
| DE1 | 201673 | 403 | 1872 | |
| IL6 | 854013 | 92 | 667 | |
| IN6 | 185263 | 74 | 516 | |
| KS2 | 477905 | 174 | 583 | |
| LA1 | 85692 | 150 | 1073 | |
| MD5 | 328770 | 362 | 1856 | |
| ME5 | 366488 | 410 | 1032 | |
| MN5 | 55538 | 64 | 141 | |
| NM1 | 117095 | 139 | 594 | |
| NM5 | 608275 | 346 | 1017 | |
| PA6 | 1495705 | 169 | 1580 | |
| TN6 | 1622282 | 136 | 779 | |
| VA1 | 259180 | 233 | 551 | |
| WI1 | 226908 | 90 | 304 | |
| NCHRP Data | CA_AEB | 837667 | 180 | 133 |
| CA_AWB | 943147 | 502 | 1063 | |
| CA_Bow | 651090 | 92 | 649 | |
| CA_LAN | 4092484 | 945 | 3884 | |
| CA_LAS | 4661287 | 820 | 6392 | |
| CA_Lodi | 2273143 | 801 | 2134 | |
| FL_I10 | 1641480 | 1707 | 3537 | |
| FL_I95 | 2112518 | 23 | 1262 | |
| FL_US29 | 389164 | 2216 | 4623 | |
| MI_I10 | 1965022 | 212 | 649 | |
| MI_I55R | 1333268 | 1642 | 7270 | |
| MI_I55U | 1232223 | 635 | 3043 | |
| MI_US49 | 1225138 | 11 | 765 | |
| MI_US61 | 159299 | 37 | 224 |
single EV loading event, due to the fidelity of the proposed filtering criteria, the load effects of any EV candidates should fall within a certain range, which is less or equal to the load effects of the FAST Act EVs (i.e., load effect ratio is equal or less than 1.0). In contrast, the MP scenario in which an EV passes through a bridge together with other random trucks can go beyond 1.0 because the weight of the non-EV truck is essentially a random variable. This study analyzed two MP scenarios: (1) an EV and an unrestricted legal load traveling on the same lane, and (2) an EV and an unrestricted legal load traveling side-by-side.
The same 32 WIM sites were used to analyze the live load statistics of the single EV loading event. However, to identify the MP events from WIM data, the timestamp of each vehicle needed to be accurate to 0.01s. None of the 32 WIM systems satisfies this requirement. Due to this constraint, another eight WIM sites from New York were deployed for the MP cases.
For the two-lane loaded side-by-side event, the girder distribution factors were determined based on 131 existing steel girder bridges collected by the NCHRP Project 12-26 (1991). The NPP is used to extrapolate the maximum load effect for a 5-year return period. From the NPP, it is observed that for all the sites, the upper 50% tail of the load effects generally followed a straight line, indicating that a normal distribution can be used to describe the upper-tail data.
The final live load statistical models were taken as the governing value from (1) a single EV loading event, (2) an EV traveling with an unrestricted legal load on the same lane, and (3) an EV and an unrestricted legal load traveling side-by-side. Generally, on a short span (e.g., 30 ft), the single EV loading event governs; on a long span (e.g., 120 ft, 200 ft), the single-lane MP event governs.
Figure B-8 through Figure B-12 show the NPP for five sites (randomly selected). Table B-48 through Table B-77 present the live load statistics developed for different return periods and ADTTs.

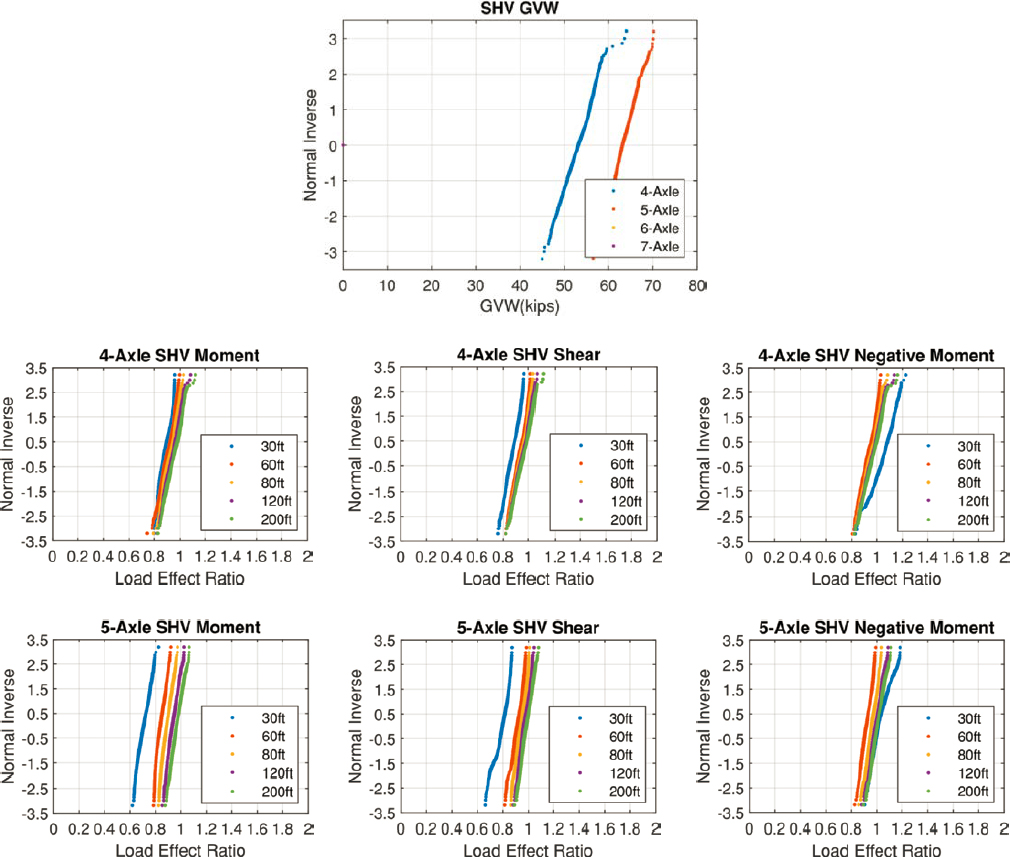
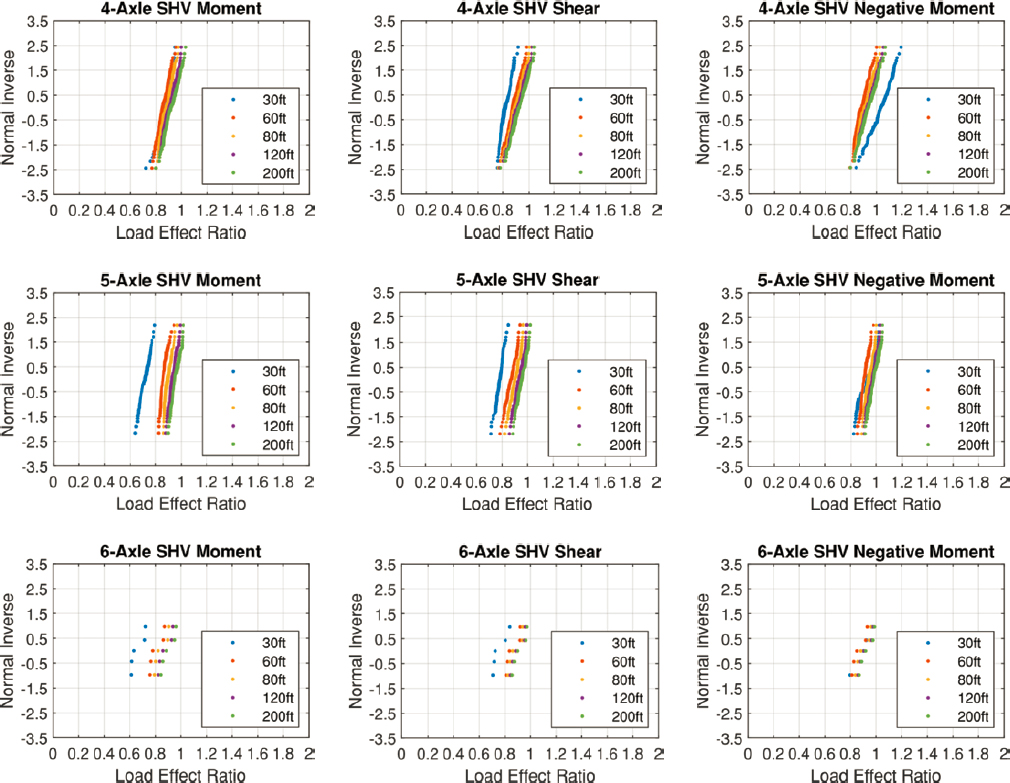

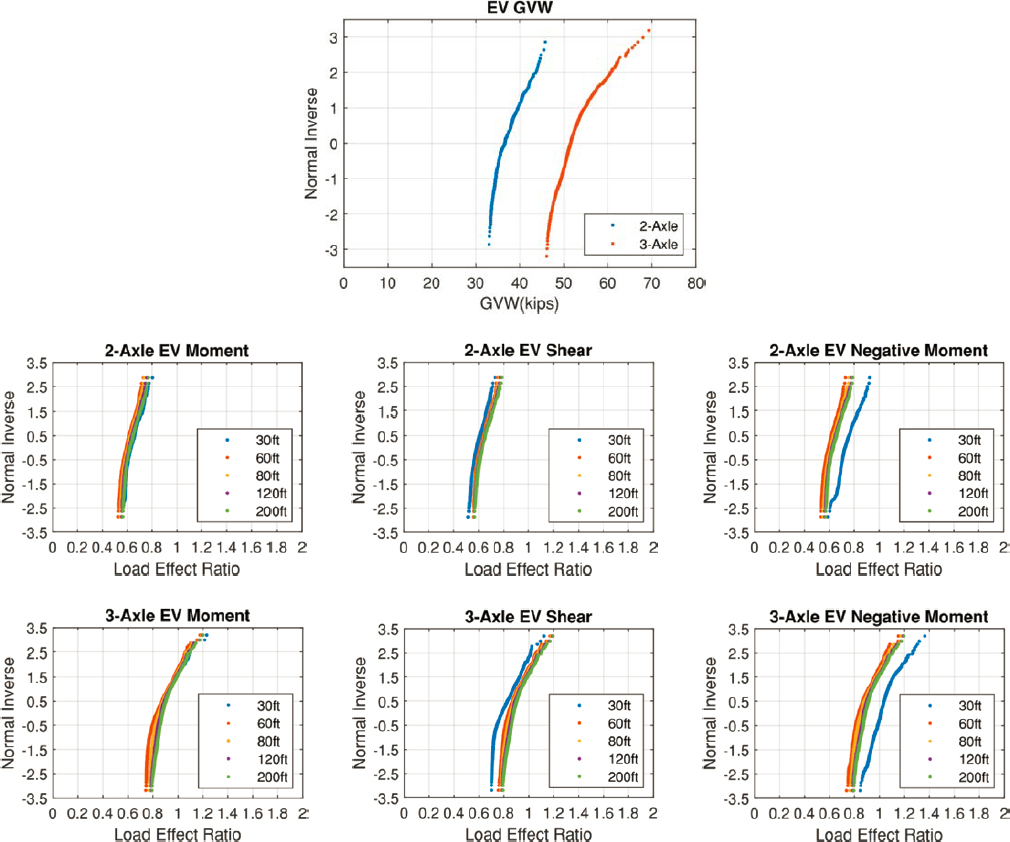


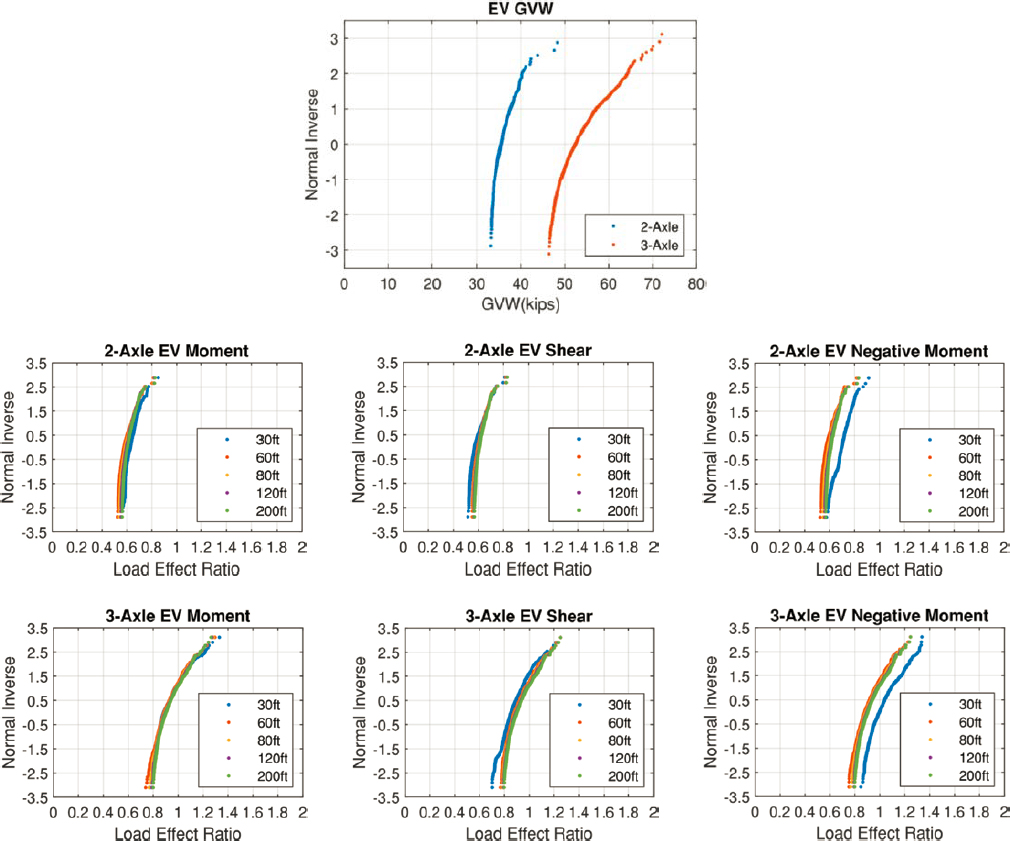
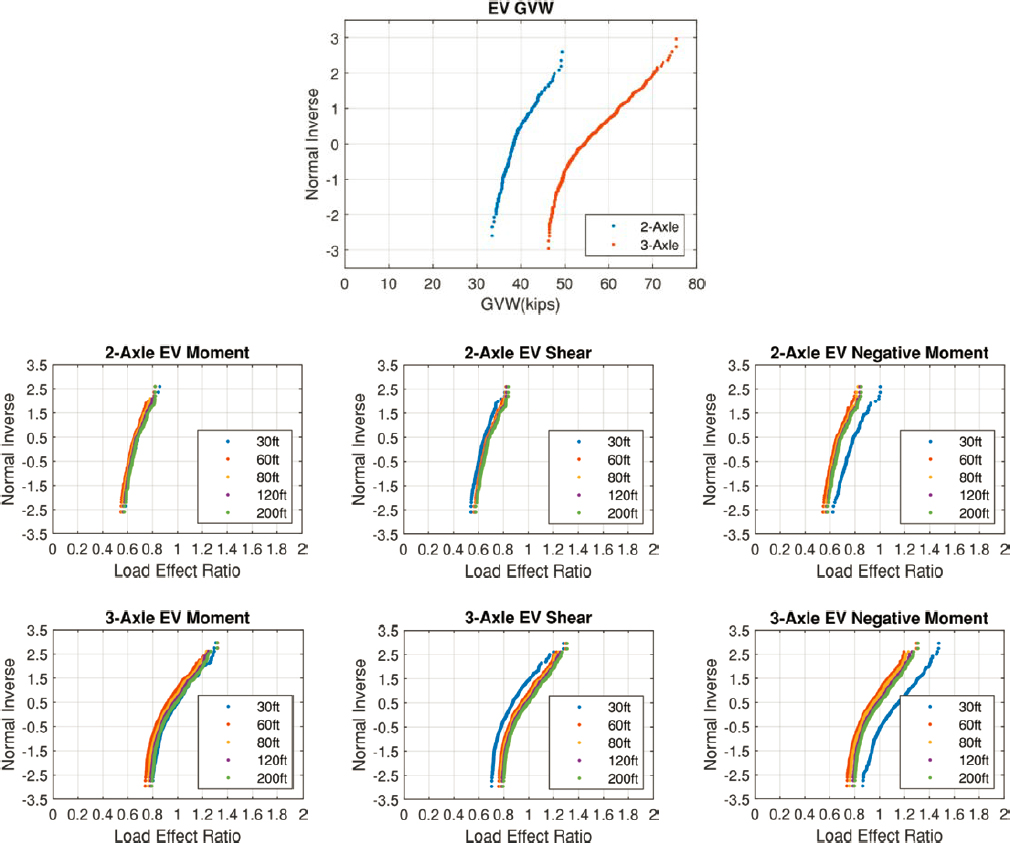
Table B-48. Two-axle EV statistical parameters of live load moment for ADTT = 250.
| Moment | 30 ft | 60 ft | 80 ft | 120 ft | 200 ft | |||||
|---|---|---|---|---|---|---|---|---|---|---|
| Bias | V | Bias | V | Bias | V | Bias | V | Bias | V | |
| 1 day | 0.47 | 0.17 | 0.46 | 0.16 | 0.48 | 0.15 | 0.49 | 0.14 | 0.49 | 0.14 |
| 2 weeks | 0.61 | 0.13 | 0.58 | 0.12 | 0.59 | 0.11 | 0.60 | 0.11 | 0.63 | 0.29 |
| 1 month | 0.65 | 0.12 | 0.62 | 0.11 | 0.66 | 0.06 | 0.64 | 0.10 | 0.74 | 0.27 |
| 2 months | 0.69 | 0.10 | 0.65 | 0.10 | 0.73 | 0.06 | 0.67 | 0.09 | 0.83 | 0.25 |
| 6 months | 0.74 | 0.09 | 0.70 | 0.08 | 0.83 | 0.08 | 0.76 | 0.26 | 0.98 | 0.21 |
| 1 year | 0.77 | 0.09 | 0.73 | 0.08 | 0.89 | 0.09 | 0.85 | 0.22 | 1.07 | 0.18 |
| 5 years | 0.83 | 0.08 | 0.81 | 0.07 | 1.00 | 0.11 | 1.02 | 0.15 | 1.25 | 0.14 |
| 50 years | 0.90 | 0.09 | 0.93 | 0.08 | 1.13 | 0.14 | 1.23 | 0.14 | 1.45 | 0.13 |
| 75 years | 0.91 | 0.10 | 0.95 | 0.08 | 1.15 | 0.14 | 1.26 | 0.15 | 1.48 | 0.13 |
| 100 years | 0.92 | 0.10 | 0.96 | 0.08 | 1.16 | 0.15 | 1.28 | 0.15 | 1.50 | 0.13 |
Table B-49. Two-axle EV statistical parameters of live load moment for ADTT = 1,000.
| Moment | 30 ft | 60 ft | 80 ft | 120 ft | 200 ft | |||||
|---|---|---|---|---|---|---|---|---|---|---|
| Bias | V | Bias | V | Bias | V | Bias | V | Bias | V | |
| 1 day | 0.54 | 0.15 | 0.52 | 0.14 | 0.54 | 0.13 | 0.55 | 0.13 | 0.55 | 0.12 |
| 2 weeks | 0.68 | 0.11 | 0.65 | 0.10 | 0.73 | 0.06 | 0.66 | 0.09 | 0.82 | 0.25 |
| 1 month | 0.72 | 0.10 | 0.68 | 0.09 | 0.80 | 0.07 | 0.72 | 0.28 | 0.93 | 0.22 |
| 2 months | 0.75 | 0.09 | 0.71 | 0.08 | 0.86 | 0.08 | 0.80 | 0.24 | 1.02 | 0.20 |
| 6 months | 0.80 | 0.08 | 0.75 | 0.08 | 0.94 | 0.10 | 0.93 | 0.19 | 1.15 | 0.16 |
| 1 year | 0.82 | 0.08 | 0.79 | 0.07 | 0.99 | 0.11 | 1.00 | 0.16 | 1.22 | 0.15 |
| 5 years | 0.87 | 0.09 | 0.89 | 0.07 | 1.08 | 0.13 | 1.15 | 0.13 | 1.37 | 0.13 |
| 50 years | 0.93 | 0.11 | 0.99 | 0.08 | 1.20 | 0.16 | 1.33 | 0.17 | 1.55 | 0.14 |
| 75 years | 0.94 | 0.11 | 1.01 | 0.09 | 1.21 | 0.16 | 1.35 | 0.18 | 1.57 | 0.14 |
| 100 years | 0.95 | 0.11 | 1.02 | 0.09 | 1.23 | 0.16 | 1.37 | 0.18 | 1.59 | 0.14 |
Table B-50. Two-axle EV statistical parameters of live load moment for ADTT = 2,500.
| Moment | 30 ft | 60 ft | 80 ft | 120 ft | 200 ft | |||||
|---|---|---|---|---|---|---|---|---|---|---|
| Bias | V | Bias | V | Bias | V | Bias | V | Bias | V | |
| 1 day | 0.59 | 0.14 | 0.57 | 0.12 | 0.58 | 0.12 | 0.59 | 0.11 | 0.59 | 0.11 |
| 2 weeks | 0.73 | 0.09 | 0.69 | 0.09 | 0.81 | 0.07 | 0.73 | 0.27 | 0.95 | 0.21 |
| 1 month | 0.76 | 0.09 | 0.72 | 0.08 | 0.88 | 0.08 | 0.82 | 0.23 | 1.05 | 0.19 |
| 2 months | 0.79 | 0.08 | 0.74 | 0.08 | 0.93 | 0.09 | 0.91 | 0.20 | 1.13 | 0.17 |
| 6 months | 0.83 | 0.08 | 0.80 | 0.07 | 1.00 | 0.11 | 1.02 | 0.15 | 1.24 | 0.15 |
| 1 year | 0.85 | 0.09 | 0.85 | 0.07 | 1.05 | 0.12 | 1.09 | 0.14 | 1.31 | 0.14 |
| 5 years | 0.90 | 0.09 | 0.93 | 0.08 | 1.13 | 0.14 | 1.23 | 0.14 | 1.45 | 0.13 |
| 50 years | 0.95 | 0.11 | 1.03 | 0.09 | 1.24 | 0.17 | 1.39 | 0.19 | 1.61 | 0.14 |
| 75 years | 0.96 | 0.12 | 1.05 | 0.09 | 1.25 | 0.17 | 1.41 | 0.20 | 1.63 | 0.15 |
| 100 years | 0.97 | 0.12 | 1.06 | 0.10 | 1.27 | 0.17 | 1.43 | 0.21 | 1.65 | 0.15 |
Table B-51. Two-axle EV statistical parameters of live load moment for ADTT = 5,000.
| Moment | 30 ft | 60 ft | 80 ft | 120 ft | 200 ft | |||||
|---|---|---|---|---|---|---|---|---|---|---|
| Bias | V | Bias | V | Bias | V | Bias | V | Bias | V | |
| 1 day | 0.63 | 0.12 | 0.60 | 0.11 | 0.62 | 0.06 | 0.62 | 0.10 | 0.68 | 0.28 |
| 2 weeks | 0.76 | 0.09 | 0.72 | 0.08 | 0.87 | 0.08 | 0.82 | 0.24 | 1.04 | 0.19 |
| 1 month | 0.79 | 0.08 | 0.74 | 0.08 | 0.93 | 0.09 | 0.91 | 0.20 | 1.13 | 0.17 |
| 2 months | 0.81 | 0.08 | 0.78 | 0.07 | 0.98 | 0.10 | 0.98 | 0.17 | 1.20 | 0.15 |
| 6 months | 0.85 | 0.09 | 0.85 | 0.07 | 1.04 | 0.12 | 1.09 | 0.14 | 1.31 | 0.14 |
| 1 year | 0.87 | 0.09 | 0.89 | 0.07 | 1.08 | 0.13 | 1.15 | 0.13 | 1.37 | 0.13 |
| 5 years | 0.92 | 0.10 | 0.96 | 0.08 | 1.16 | 0.15 | 1.28 | 0.15 | 1.50 | 0.13 |
| 50 years | 0.97 | 0.12 | 1.06 | 0.10 | 1.27 | 0.17 | 1.43 | 0.21 | 1.65 | 0.15 |
| 75 years | 0.98 | 0.12 | 1.07 | 0.10 | 1.28 | 0.18 | 1.45 | 0.21 | 1.68 | 0.15 |
| 100 years | 0.99 | 0.12 | 1.08 | 0.10 | 1.29 | 0.18 | 1.47 | 0.22 | 1.69 | 0.16 |
Table B-52. Two-axle EV statistical parameters of live load moment for ADTT = 10,000.
| Moment | 30 ft | 60 ft | 80 ft | 120 ft | 200 ft | |||||
|---|---|---|---|---|---|---|---|---|---|---|
| Bias | V | Bias | V | Bias | V | Bias | V | Bias | V | |
| 1 day | 0.66 | 0.11 | 0.63 | 0.10 | 0.69 | 0.06 | 0.65 | 0.10 | 0.78 | 0.26 |
| 2 weeks | 0.79 | 0.08 | 0.74 | 0.08 | 0.92 | 0.09 | 0.90 | 0.20 | 1.12 | 0.17 |
| 1 month | 0.81 | 0.08 | 0.78 | 0.07 | 0.98 | 0.10 | 0.98 | 0.17 | 1.20 | 0.15 |
| 2 months | 0.84 | 0.08 | 0.82 | 0.07 | 1.02 | 0.11 | 1.05 | 0.14 | 1.27 | 0.14 |
| 6 months | 0.87 | 0.09 | 0.89 | 0.07 | 1.08 | 0.13 | 1.15 | 0.13 | 1.37 | 0.13 |
| 1 year | 0.89 | 0.09 | 0.92 | 0.08 | 1.12 | 0.14 | 1.21 | 0.14 | 1.43 | 0.13 |
| 5 years | 0.93 | 0.11 | 0.99 | 0.08 | 1.20 | 0.16 | 1.33 | 0.17 | 1.55 | 0.14 |
| 50 years | 0.99 | 0.12 | 1.08 | 0.10 | 1.29 | 0.18 | 1.47 | 0.22 | 1.69 | 0.16 |
| 75 years | 0.99 | 0.13 | 1.09 | 0.10 | 1.31 | 0.19 | 1.49 | 0.23 | 1.72 | 0.16 |
| 100 years | 1.00 | 0.13 | 1.10 | 0.11 | 1.32 | 0.19 | 1.51 | 0.24 | 1.73 | 0.16 |
Table B-53. Two-axle EV statistical parameters of live load reaction for ADTT = 250.
| Reaction | 30 ft | 60 ft | 80 ft | 120 ft | 200 ft | |||||
|---|---|---|---|---|---|---|---|---|---|---|
| Bias | V | Bias | V | Bias | V | Bias | V | Bias | V | |
| 1 day | 0.45 | 0.16 | 0.49 | 0.14 | 0.49 | 0.14 | 0.49 | 0.14 | 0.49 | 0.14 |
| 2 weeks | 0.58 | 0.12 | 0.60 | 0.11 | 0.61 | 0.10 | 0.61 | 0.11 | 0.78 | 0.29 |
| 1 month | 0.62 | 0.11 | 0.64 | 0.10 | 0.69 | 0.10 | 0.64 | 0.10 | 0.88 | 0.27 |
| 2 months | 0.65 | 0.10 | 0.67 | 0.09 | 0.76 | 0.10 | 0.71 | 0.31 | 0.98 | 0.24 |
| 6 months | 0.70 | 0.09 | 0.71 | 0.08 | 0.87 | 0.10 | 0.84 | 0.27 | 1.12 | 0.21 |
| 1 year | 0.73 | 0.08 | 0.73 | 0.08 | 0.94 | 0.10 | 0.93 | 0.24 | 1.21 | 0.19 |
| 5 years | 0.78 | 0.08 | 0.83 | 0.08 | 1.06 | 0.10 | 1.11 | 0.18 | 1.38 | 0.17 |
| 50 years | 0.84 | 0.08 | 0.96 | 0.07 | 1.20 | 0.10 | 1.32 | 0.17 | 1.57 | 0.18 |
| 75 years | 0.85 | 0.09 | 0.98 | 0.06 | 1.22 | 0.10 | 1.35 | 0.18 | 1.60 | 0.18 |
| 100 years | 0.86 | 0.09 | 1.00 | 0.06 | 1.23 | 0.10 | 1.37 | 0.18 | 1.62 | 0.19 |
Table B-54. Two-axle EV statistical parameters of live load reaction for ADTT = 1,000.
| Reaction | 30 ft | 60 ft | 80 ft | 120 ft | 200 ft | |||||
|---|---|---|---|---|---|---|---|---|---|---|
| Bias | V | Bias | V | Bias | V | Bias | V | Bias | V | |
| 1 day | 0.52 | 0.14 | 0.55 | 0.13 | 0.55 | 0.12 | 0.55 | 0.12 | 0.61 | 0.30 |
| 2 weeks | 0.65 | 0.10 | 0.66 | 0.09 | 0.76 | 0.10 | 0.70 | 0.32 | 0.97 | 0.25 |
| 1 month | 0.68 | 0.09 | 0.69 | 0.08 | 0.83 | 0.10 | 0.79 | 0.29 | 1.07 | 0.22 |
| 2 months | 0.71 | 0.08 | 0.72 | 0.08 | 0.90 | 0.10 | 0.88 | 0.26 | 1.16 | 0.20 |
| 6 months | 0.75 | 0.08 | 0.77 | 0.09 | 0.99 | 0.10 | 1.01 | 0.21 | 1.28 | 0.18 |
| 1 year | 0.77 | 0.08 | 0.81 | 0.08 | 1.04 | 0.10 | 1.09 | 0.19 | 1.36 | 0.17 |
| 5 years | 0.82 | 0.08 | 0.92 | 0.07 | 1.15 | 0.10 | 1.24 | 0.17 | 1.50 | 0.17 |
| 50 years | 0.88 | 0.09 | 1.03 | 0.06 | 1.27 | 0.11 | 1.42 | 0.19 | 1.67 | 0.19 |
| 75 years | 0.89 | 0.09 | 1.05 | 0.06 | 1.29 | 0.11 | 1.45 | 0.20 | 1.69 | 0.20 |
| 100 years | 0.89 | 0.10 | 1.06 | 0.06 | 1.30 | 0.11 | 1.47 | 0.21 | 1.71 | 0.20 |
Table B-55. Two-axle EV statistical parameters of live load reaction for ADTT = 2,500.
| Reaction | 30 ft | 60 ft | 80 ft | 120 ft | 200 ft | |||||
|---|---|---|---|---|---|---|---|---|---|---|
| Bias | V | Bias | V | Bias | V | Bias | V | Bias | V | |
| 1 day | 0.56 | 0.13 | 0.59 | 0.11 | 0.59 | 0.11 | 0.59 | 0.11 | 0.73 | 0.29 |
| 2 weeks | 0.69 | 0.09 | 0.70 | 0.08 | 0.85 | 0.10 | 0.81 | 0.28 | 1.09 | 0.22 |
| 1 month | 0.72 | 0.08 | 0.73 | 0.08 | 0.92 | 0.10 | 0.91 | 0.25 | 1.19 | 0.20 |
| 2 months | 0.74 | 0.08 | 0.75 | 0.09 | 0.98 | 0.10 | 0.99 | 0.22 | 1.26 | 0.18 |
| 6 months | 0.78 | 0.08 | 0.83 | 0.08 | 1.06 | 0.10 | 1.11 | 0.19 | 1.38 | 0.17 |
| 1 year | 0.80 | 0.08 | 0.87 | 0.08 | 1.10 | 0.10 | 1.18 | 0.17 | 1.44 | 0.17 |
| 5 years | 0.84 | 0.08 | 0.96 | 0.07 | 1.20 | 0.10 | 1.32 | 0.17 | 1.57 | 0.18 |
| 50 years | 0.90 | 0.10 | 1.07 | 0.06 | 1.31 | 0.11 | 1.48 | 0.21 | 1.73 | 0.21 |
| 75 years | 0.91 | 0.10 | 1.08 | 0.06 | 1.33 | 0.11 | 1.51 | 0.22 | 1.75 | 0.21 |
| 100 years | 0.91 | 0.10 | 1.09 | 0.06 | 1.34 | 0.11 | 1.53 | 0.22 | 1.77 | 0.21 |
Table B-56. Two-axle EV statistical parameters of live load reaction for ADTT = 5,000.
| Reaction | 30 ft | 60 ft | 80 ft | 120 ft | 200 ft | |||||
|---|---|---|---|---|---|---|---|---|---|---|
| Bias | V | Bias | V | Bias | V | Bias | V | Bias | V | |
| 1 day | 0.60 | 0.12 | 0.62 | 0.10 | 0.65 | 0.10 | 0.63 | 0.10 | 0.83 | 0.28 |
| 2 weeks | 0.71 | 0.08 | 0.73 | 0.08 | 0.91 | 0.10 | 0.90 | 0.25 | 1.18 | 0.20 |
| 1 month | 0.74 | 0.08 | 0.75 | 0.09 | 0.98 | 0.10 | 0.99 | 0.22 | 1.26 | 0.18 |
| 2 months | 0.77 | 0.08 | 0.80 | 0.09 | 1.03 | 0.10 | 1.07 | 0.20 | 1.34 | 0.18 |
| 6 months | 0.80 | 0.08 | 0.87 | 0.08 | 1.10 | 0.10 | 1.18 | 0.17 | 1.44 | 0.17 |
| 1 year | 0.82 | 0.08 | 0.92 | 0.07 | 1.15 | 0.10 | 1.24 | 0.17 | 1.50 | 0.17 |
| 5 years | 0.86 | 0.09 | 1.00 | 0.06 | 1.23 | 0.10 | 1.37 | 0.18 | 1.62 | 0.19 |
| 50 years | 0.91 | 0.10 | 1.09 | 0.06 | 1.34 | 0.11 | 1.53 | 0.22 | 1.77 | 0.21 |
| 75 years | 0.92 | 0.10 | 1.11 | 0.06 | 1.36 | 0.11 | 1.55 | 0.23 | 1.79 | 0.22 |
| 100 years | 0.92 | 0.11 | 1.12 | 0.06 | 1.37 | 0.12 | 1.57 | 0.24 | 1.81 | 0.22 |
Table B-57. Two-axle EV statistical parameters of live load reaction for ADTT = 10,000.
| Reaction | 30 ft | 60 ft | 80 ft | 120 ft | 200 ft | |||||
|---|---|---|---|---|---|---|---|---|---|---|
| Bias | V | Bias | V | Bias | V | Bias | V | Bias | V | |
| 1 day | 0.63 | 0.10 | 0.65 | 0.10 | 0.72 | 0.10 | 0.66 | 0.33 | 0.92 | 0.26 |
| 2 weeks | 0.74 | 0.08 | 0.75 | 0.07 | 0.97 | 0.10 | 0.98 | 0.22 | 1.26 | 0.18 |
| 1 month | 0.77 | 0.08 | 0.80 | 0.09 | 1.03 | 0.10 | 1.07 | 0.20 | 1.34 | 0.18 |
| 2 months | 0.79 | 0.08 | 0.85 | 0.08 | 1.08 | 0.10 | 1.14 | 0.18 | 1.40 | 0.17 |
| 6 months | 0.82 | 0.08 | 0.91 | 0.07 | 1.14 | 0.10 | 1.24 | 0.17 | 1.50 | 0.17 |
| 1 year | 0.84 | 0.08 | 0.95 | 0.07 | 1.18 | 0.10 | 1.30 | 0.17 | 1.55 | 0.18 |
| 5 years | 0.88 | 0.09 | 1.03 | 0.06 | 1.27 | 0.11 | 1.42 | 0.19 | 1.67 | 0.19 |
| 50 years | 0.92 | 0.11 | 1.12 | 0.06 | 1.37 | 0.12 | 1.57 | 0.24 | 1.81 | 0.22 |
| 75 years | 0.93 | 0.11 | 1.13 | 0.06 | 1.39 | 0.12 | 1.59 | 0.24 | 1.83 | 0.23 |
| 100 years | 0.94 | 0.11 | 1.14 | 0.06 | 1.40 | 0.12 | 1.61 | 0.25 | 1.85 | 0.23 |
Table B-58. Two-axle EV statistical parameters of live load negative moment for ADTT = 250.
| Negative Moment | 30 | ft | 60 | ft | 80 ft | 120 ft | 200 ft | |||
|---|---|---|---|---|---|---|---|---|---|---|
| Bias | V | Bias | V | Bias | V | Bias | V | Bias | V | |
| 1 day | 0.53 | 0.16 | 0.67 | 0.24 | 0.80 | 0.08 | 0.73 | 0.45 | 0.80 | 0.27 |
| 2 weeks | 0.67 | 0.12 | 0.87 | 0.21 | 1.13 | 0.11 | 1.08 | 0.38 | 1.22 | 0.28 |
| 1 month | 0.72 | 0.11 | 0.95 | 0.21 | 1.24 | 0.11 | 1.19 | 0.35 | 1.35 | 0.26 |
| 2 months | 0.76 | 0.10 | 1.02 | 0.20 | 1.33 | 0.12 | 1.30 | 0.31 | 1.46 | 0.24 |
| 6 months | 0.81 | 0.10 | 1.14 | 0.19 | 1.48 | 0.12 | 1.46 | 0.25 | 1.64 | 0.20 |
| 1 year | 0.84 | 0.09 | 1.23 | 0.18 | 1.56 | 0.12 | 1.56 | 0.22 | 1.74 | 0.18 |
| 5 years | 0.91 | 0.10 | 1.41 | 0.14 | 1.72 | 0.12 | 1.77 | 0.18 | 1.95 | 0.17 |
| 50 years | 0.98 | 0.11 | 1.64 | 0.12 | 1.90 | 0.13 | 2.00 | 0.23 | 2.19 | 0.20 |
| 75 years | 0.99 | 0.11 | 1.68 | 0.12 | 1.93 | 0.13 | 2.04 | 0.24 | 2.23 | 0.21 |
| 100 years | 1.00 | 0.11 | 1.70 | 0.12 | 1.95 | 0.13 | 2.06 | 0.25 | 2.25 | 0.21 |
Table B-59. Two-axle EV statistical parameters of live load negative moment for ADTT = 1,000.
| Negative Moment | 30 ft | 60 ft | 80 ft | 120 ft | 200 ft | |||||
|---|---|---|---|---|---|---|---|---|---|---|
| Bias | V | Bias | V | Bias | V | Bias | V | Bias | V | |
| 1 day | 0.60 | 0.14 | 0.77 | 0.22 | 0.96 | 0.09 | 0.91 | 0.41 | 1.01 | 0.28 |
| 2 weeks | 0.75 | 0.11 | 1.01 | 0.20 | 1.32 | 0.12 | 1.29 | 0.32 | 1.45 | 0.24 |
| 1 month | 0.79 | 0.10 | 1.10 | 0.20 | 1.43 | 0.12 | 1.40 | 0.28 | 1.57 | 0.22 |
| 2 months | 0.82 | 0.10 | 1.18 | 0.19 | 1.51 | 0.12 | 1.50 | 0.24 | 1.68 | 0.19 |
| 6 months | 0.87 | 0.09 | 1.31 | 0.16 | 1.63 | 0.12 | 1.65 | 0.19 | 1.84 | 0.17 |
| 1 year | 0.90 | 0.09 | 1.39 | 0.14 | 1.70 | 0.12 | 1.74 | 0.18 | 1.93 | 0.17 |
| 5 years | 0.95 | 0.10 | 1.56 | 0.11 | 1.83 | 0.12 | 1.91 | 0.20 | 2.10 | 0.18 |
| 50 years | 1.02 | 0.12 | 1.75 | 0.14 | 2.00 | 0.13 | 2.12 | 0.27 | 2.31 | 0.23 |
| 75 years | 1.03 | 0.12 | 1.78 | 0.14 | 2.02 | 0.13 | 2.15 | 0.28 | 2.35 | 0.23 |
| 100 years | 1.04 | 0.12 | 1.80 | 0.15 | 2.04 | 0.13 | 2.17 | 0.29 | 2.37 | 0.24 |
Table B-60. Two-axle EV statistical parameters of live load negative moment for ADTT = 2,500.
| Negative Moment | 30 ft | 60 ft | 80 ft | 120 ft | 200 ft | |||||
|---|---|---|---|---|---|---|---|---|---|---|
| Bias | V | Bias | V | Bias | V | Bias | V | Bias | V | |
| 1 day | 0.65 | 0.13 | 0.84 | 0.22 | 1.08 | 0.10 | 1.04 | 0.39 | 1.16 | 0.28 |
| 2 weeks | 0.80 | 0.10 | 1.11 | 0.20 | 1.45 | 0.12 | 1.42 | 0.27 | 1.60 | 0.21 |
| 1 month | 0.83 | 0.09 | 1.20 | 0.18 | 1.54 | 0.12 | 1.53 | 0.23 | 1.71 | 0.19 |
| 2 months | 0.86 | 0.09 | 1.29 | 0.17 | 1.61 | 0.12 | 1.63 | 0.20 | 1.81 | 0.17 |
| 6 months | 0.91 | 0.10 | 1.41 | 0.14 | 1.72 | 0.12 | 1.76 | 0.18 | 1.95 | 0.17 |
| 1 year | 0.93 | 0.10 | 1.49 | 0.12 | 1.78 | 0.12 | 1.84 | 0.18 | 2.03 | 0.17 |
| 5 years | 0.98 | 0.11 | 1.64 | 0.12 | 1.90 | 0.13 | 2.00 | 0.23 | 2.19 | 0.20 |
| 50 years | 1.04 | 0.12 | 1.81 | 0.15 | 2.05 | 0.13 | 2.19 | 0.30 | 2.39 | 0.24 |
| 75 years | 1.05 | 0.13 | 1.84 | 0.16 | 2.08 | 0.14 | 2.21 | 0.31 | 2.42 | 0.25 |
| 100 years | 1.06 | 0.13 | 1.86 | 0.17 | 2.09 | 0.14 | 2.24 | 0.32 | 2.44 | 0.26 |
Table B-61. Two-axle EV statistical parameters of live load negative moment for ADTT = 5,000.
| Negative Moment | 30 ft | 60 ft | 80 ft | 120 ft | 200 ft | |||||
|---|---|---|---|---|---|---|---|---|---|---|
| Bias | V | Bias | V | Bias | V | Bias | V | Bias | V | |
| 1 day | 0.69 | 0.12 | 0.91 | 0.21 | 1.18 | 0.11 | 1.14 | 0.36 | 1.28 | 0.27 |
| 2 weeks | 0.83 | 0.09 | 1.20 | 0.19 | 1.53 | 0.12 | 1.52 | 0.23 | 1.70 | 0.19 |
| 1 month | 0.86 | 0.09 | 1.29 | 0.17 | 1.61 | 0.12 | 1.63 | 0.20 | 1.81 | 0.17 |
| 2 months | 0.89 | 0.09 | 1.37 | 0.15 | 1.68 | 0.12 | 1.72 | 0.18 | 1.90 | 0.17 |
| 6 months | 0.93 | 0.10 | 1.49 | 0.12 | 1.78 | 0.12 | 1.84 | 0.18 | 2.03 | 0.17 |
| 1 year | 0.95 | 0.10 | 1.56 | 0.11 | 1.83 | 0.12 | 1.91 | 0.20 | 2.10 | 0.18 |
| 5 years | 1.00 | 0.11 | 1.70 | 0.12 | 1.95 | 0.13 | 2.06 | 0.25 | 2.25 | 0.21 |
| 50 years | 1.06 | 0.13 | 1.86 | 0.17 | 2.09 | 0.14 | 2.24 | 0.32 | 2.44 | 0.26 |
| 75 years | 1.07 | 0.13 | 1.88 | 0.17 | 2.12 | 0.14 | 2.26 | 0.34 | 2.47 | 0.26 |
| 100 years | 1.07 | 0.13 | 1.90 | 0.18 | 2.13 | 0.14 | 2.28 | 0.35 | 2.49 | 0.27 |
Table B-62. Two-axle EV statistical parameters of live load negative moment for ADTT = 10,000.
| Negative Moment | 30 ft | 60 ft | 80 ft | 120 ft | 200 ft | |||||
|---|---|---|---|---|---|---|---|---|---|---|
| Bias | V | Bias | V | Bias | V | Bias | V | Bias | V | |
| 1 day | 0.73 | 0.11 | 0.98 | 0.21 | 1.28 | 0.12 | 1.24 | 0.33 | 1.39 | 0.25 |
| 2 weeks | 0.86 | 0.09 | 1.28 | 0.17 | 1.61 | 0.12 | 1.62 | 0.20 | 1.80 | 0.17 |
| 1 month | 0.89 | 0.09 | 1.37 | 0.15 | 1.68 | 0.12 | 1.72 | 0.18 | 1.90 | 0.17 |
| 2 months | 0.92 | 0.10 | 1.44 | 0.13 | 1.74 | 0.12 | 1.80 | 0.18 | 1.98 | 0.17 |
| 6 months | 0.95 | 0.10 | 1.56 | 0.11 | 1.83 | 0.12 | 1.91 | 0.20 | 2.10 | 0.18 |
| 1 year | 0.97 | 0.11 | 1.62 | 0.11 | 1.89 | 0.12 | 1.98 | 0.22 | 2.17 | 0.20 |
| 5 years | 1.02 | 0.12 | 1.75 | 0.14 | 2.00 | 0.13 | 2.12 | 0.27 | 2.31 | 0.23 |
| 50 years | 1.07 | 0.13 | 1.90 | 0.18 | 2.13 | 0.14 | 2.28 | 0.35 | 2.49 | 0.27 |
| 75 years | 1.08 | 0.14 | 1.92 | 0.19 | 2.15 | 0.14 | 2.31 | 0.36 | 2.52 | 0.28 |
| 100 years | 1.09 | 0.14 | 1.94 | 0.19 | 2.17 | 0.14 | 2.33 | 0.37 | 2.54 | 0.28 |
Table B-63. Three-axle EV statistical parameters of live load moment for ADTT = 250.
| Moment | 30 ft | 60 ft | 80 ft | 120 ft | 200 ft | |||||
|---|---|---|---|---|---|---|---|---|---|---|
| Bias | V | Bias | V | Bias | V | Bias | V | Bias | V | |
| 1 day | 0.48 | 0.15 | 0.51 | 0.14 | 0.52 | 0.14 | 0.53 | 0.14 | 0.53 | 0.13 |
| 2 weeks | 0.64 | 0.11 | 0.65 | 0.10 | 0.66 | 0.10 | 0.67 | 0.10 | 0.67 | 0.09 |
| 1 month | 0.69 | 0.10 | 0.69 | 0.09 | 0.69 | 0.09 | 0.70 | 0.09 | 0.71 | 0.09 |
| 2 months | 0.72 | 0.09 | 0.72 | 0.08 | 0.72 | 0.08 | 0.73 | 0.08 | 0.74 | 0.08 |
| 6 months | 0.77 | 0.08 | 0.76 | 0.08 | 0.77 | 0.08 | 0.77 | 0.07 | 0.78 | 0.07 |
| 1 year | 0.80 | 0.08 | 0.78 | 0.07 | 0.79 | 0.07 | 0.80 | 0.07 | 0.80 | 0.07 |
| 5 years | 0.85 | 0.07 | 0.83 | 0.07 | 0.84 | 0.07 | 0.84 | 0.07 | 0.86 | 0.09 |
| 50 years | 0.92 | 0.08 | 0.89 | 0.08 | 0.90 | 0.08 | 0.90 | 0.08 | 0.98 | 0.09 |
| 75 years | 0.93 | 0.08 | 0.90 | 0.08 | 0.91 | 0.08 | 0.91 | 0.08 | 1.00 | 0.10 |
| 100 years | 0.94 | 0.08 | 0.91 | 0.08 | 0.91 | 0.08 | 0.92 | 0.08 | 1.02 | 0.10 |
Table B-64. Three-axle EV statistical parameters of live load moment for ADTT = 1,000.
| Moment | 30 ft | 60 ft | 80 ft | 120 ft | 200 ft | |||||
|---|---|---|---|---|---|---|---|---|---|---|
| Bias | V | Bias | V | Bias | V | Bias | V | Bias | V | |
| 1 day | 0.57 | 0.13 | 0.59 | 0.12 | 0.59 | 0.12 | 0.60 | 0.11 | 0.61 | 0.11 |
| 2 weeks | 0.72 | 0.09 | 0.71 | 0.08 | 0.72 | 0.08 | 0.73 | 0.08 | 0.73 | 0.08 |
| 1 month | 0.75 | 0.08 | 0.74 | 0.08 | 0.75 | 0.08 | 0.76 | 0.08 | 0.76 | 0.08 |
| 2 months | 0.78 | 0.08 | 0.77 | 0.08 | 0.78 | 0.07 | 0.78 | 0.07 | 0.79 | 0.07 |
| 6 months | 0.82 | 0.08 | 0.80 | 0.07 | 0.81 | 0.07 | 0.82 | 0.07 | 0.82 | 0.07 |
| 1 year | 0.84 | 0.07 | 0.83 | 0.07 | 0.83 | 0.07 | 0.84 | 0.07 | 0.84 | 0.09 |
| 5 years | 0.89 | 0.08 | 0.87 | 0.08 | 0.87 | 0.08 | 0.88 | 0.08 | 0.94 | 0.09 |
| 50 years | 0.95 | 0.09 | 0.92 | 0.09 | 0.93 | 0.09 | 0.93 | 0.09 | 1.05 | 0.10 |
| 75 years | 0.96 | 0.09 | 0.93 | 0.09 | 0.94 | 0.09 | 0.94 | 0.09 | 1.07 | 0.10 |
| 100 years | 0.97 | 0.09 | 0.94 | 0.09 | 0.94 | 0.09 | 0.95 | 0.09 | 1.08 | 0.10 |
Table B-65. Three-axle EV statistical parameters of live load moment for ADTT = 2,500.
| Moment | 30 ft | 60 ft | 80 ft | 120 ft | 200 ft | |||||
|---|---|---|---|---|---|---|---|---|---|---|
| Bias | V | Bias | V | Bias | V | Bias | V | Bias | V | |
| 1 day | 0.63 | 0.11 | 0.63 | 0.10 | 0.64 | 0.10 | 0.65 | 0.10 | 0.65 | 0.10 |
| 2 weeks | 0.76 | 0.08 | 0.75 | 0.08 | 0.76 | 0.08 | 0.76 | 0.08 | 0.77 | 0.07 |
| 1 month | 0.79 | 0.08 | 0.78 | 0.07 | 0.78 | 0.07 | 0.79 | 0.07 | 0.79 | 0.07 |
| 2 months | 0.81 | 0.08 | 0.80 | 0.07 | 0.80 | 0.07 | 0.81 | 0.07 | 0.82 | 0.07 |
| 6 months | 0.85 | 0.07 | 0.83 | 0.07 | 0.84 | 0.07 | 0.84 | 0.07 | 0.86 | 0.09 |
| 1 year | 0.87 | 0.08 | 0.85 | 0.08 | 0.86 | 0.08 | 0.86 | 0.07 | 0.90 | 0.09 |
| 5 years | 0.92 | 0.08 | 0.89 | 0.08 | 0.90 | 0.08 | 0.90 | 0.08 | 0.98 | 0.09 |
| 50 years | 0.98 | 0.09 | 0.94 | 0.09 | 0.95 | 0.09 | 0.95 | 0.09 | 1.09 | 0.10 |
| 75 years | 0.99 | 0.09 | 0.95 | 0.09 | 0.95 | 0.09 | 0.96 | 0.09 | 1.10 | 0.11 |
| 100 years | 0.99 | 0.09 | 0.96 | 0.10 | 0.96 | 0.10 | 0.97 | 0.10 | 1.12 | 0.11 |
Table B-66. Three-axle EV statistical parameters of live load moment for ADTT = 5,000.
| Moment | 30 ft | 60 ft | 80 ft | 120 ft | 200 ft | |||||
|---|---|---|---|---|---|---|---|---|---|---|
| Bias | V | Bias | V | Bias | V | Bias | V | Bias | V | |
| 1 day | 0.66 | 0.10 | 0.67 | 0.09 | 0.68 | 0.09 | 0.68 | 0.09 | 0.69 | 0.09 |
| 2 weeks | 0.79 | 0.08 | 0.77 | 0.07 | 0.78 | 0.07 | 0.79 | 0.07 | 0.79 | 0.07 |
| 1 month | 0.81 | 0.08 | 0.80 | 0.07 | 0.80 | 0.07 | 0.81 | 0.07 | 0.82 | 0.07 |
| 2 months | 0.84 | 0.07 | 0.82 | 0.07 | 0.83 | 0.07 | 0.83 | 0.07 | 0.84 | 0.07 |
| 6 months | 0.87 | 0.08 | 0.85 | 0.08 | 0.86 | 0.07 | 0.86 | 0.07 | 0.90 | 0.09 |
| 1 year | 0.89 | 0.08 | 0.87 | 0.08 | 0.87 | 0.08 | 0.88 | 0.08 | 0.94 | 0.09 |
| 5 years | 0.94 | 0.08 | 0.91 | 0.08 | 0.91 | 0.08 | 0.92 | 0.08 | 1.02 | 0.10 |
| 50 years | 0.99 | 0.09 | 0.96 | 0.10 | 0.96 | 0.10 | 0.97 | 0.10 | 1.12 | 0.11 |
| 75 years | 1.00 | 0.09 | 0.96 | 0.10 | 0.97 | 0.10 | 0.97 | 0.10 | 1.13 | 0.11 |
| 100 years | 1.01 | 0.10 | 0.97 | 0.10 | 0.97 | 0.10 | 0.98 | 0.10 | 1.14 | 0.11 |
Table B-67. Three-axle EV statistical parameters of live load moment for ADTT = 10,000.
| Moment | 30 | ft | 60 ft | 80 ft | 120 ft | 200 ft | ||||
|---|---|---|---|---|---|---|---|---|---|---|
| Bias | V | Bias | V | Bias | V | Bias | V | Bias | V | |
| 1 day | 0.70 | 0.09 | 0.70 | 0.09 | 0.71 | 0.08 | 0.71 | 0.08 | 0.72 | 0.08 |
| 2 weeks | 0.81 | 0.08 | 0.80 | 0.07 | 0.80 | 0.07 | 0.81 | 0.07 | 0.81 | 0.07 |
| 1 month | 0.84 | 0.07 | 0.82 | 0.07 | 0.83 | 0.07 | 0.83 | 0.07 | 0.84 | 0.07 |
| 2 months | 0.86 | 0.07 | 0.84 | 0.07 | 0.84 | 0.07 | 0.85 | 0.07 | 0.87 | 0.09 |
| 6 months | 0.89 | 0.08 | 0.87 | 0.08 | 0.87 | 0.08 | 0.88 | 0.08 | 0.94 | 0.09 |
| 1 year | 0.91 | 0.08 | 0.89 | 0.08 | 0.89 | 0.08 | 0.90 | 0.08 | 0.97 | 0.09 |
| 5 years | 0.95 | 0.09 | 0.92 | 0.09 | 0.93 | 0.09 | 0.93 | 0.09 | 1.05 | 0.10 |
| 50 years | 1.01 | 0.10 | 0.97 | 0.10 | 0.97 | 0.10 | 0.98 | 0.10 | 1.14 | 0.11 |
| 75 years | 1.02 | 0.10 | 0.98 | 0.10 | 0.98 | 0.10 | 0.99 | 0.10 | 1.16 | 0.12 |
| 100 years | 1.02 | 0.10 | 0.98 | 0.10 | 0.99 | 0.10 | 0.99 | 0.17 | 1.17 | 0.12 |
Table B-68. Three-axle EV statistical parameters of live load reaction for ADTT = 250.
| Reaction | 30 ft | 60 ft | 80 ft | 120 ft | 200 ft | |||||
|---|---|---|---|---|---|---|---|---|---|---|
| Bias | V | Bias | V | Bias | V | Bias | V | Bias | V | |
| 1 day | 0.50 | 0.15 | 0.52 | 0.14 | 0.53 | 0.14 | 0.53 | 0.13 | 0.53 | 0.13 |
| 2 weeks | 0.64 | 0.10 | 0.66 | 0.10 | 0.67 | 0.10 | 0.67 | 0.09 | 0.67 | 0.09 |
| 1 month | 0.68 | 0.09 | 0.70 | 0.09 | 0.70 | 0.09 | 0.71 | 0.09 | 0.71 | 0.09 |
| 2 months | 0.71 | 0.09 | 0.73 | 0.08 | 0.73 | 0.08 | 0.74 | 0.08 | 0.74 | 0.08 |
| 6 months | 0.75 | 0.08 | 0.77 | 0.07 | 0.77 | 0.07 | 0.78 | 0.07 | 0.79 | 0.12 |
| 1 year | 0.78 | 0.08 | 0.79 | 0.07 | 0.80 | 0.07 | 0.80 | 0.07 | 0.84 | 0.11 |
| 5 years | 0.83 | 0.07 | 0.84 | 0.07 | 0.84 | 0.07 | 0.85 | 0.07 | 0.95 | 0.11 |
| 50 years | 0.89 | 0.08 | 0.90 | 0.08 | 0.90 | 0.08 | 0.91 | 0.08 | 1.07 | 0.12 |
| 75 years | 0.90 | 0.08 | 0.91 | 0.08 | 0.91 | 0.08 | 0.92 | 0.08 | 1.09 | 0.12 |
| 100 years | 0.91 | 0.08 | 0.92 | 0.08 | 0.92 | 0.08 | 0.92 | 0.08 | 1.11 | 0.13 |
Table B-69. Three-axle EV statistical parameters of live load reaction for ADTT = 1,000.
| Reaction | 30 ft | 60 ft | 80 ft | 120 ft | 200 ft | |||||
|---|---|---|---|---|---|---|---|---|---|---|
| Bias | V | Bias | V | Bias | V | Bias | V | Bias | V | |
| 1 day | 0.57 | 0.12 | 0.60 | 0.12 | 0.60 | 0.11 | 0.61 | 0.11 | 0.61 | 0.11 |
| 2 weeks | 0.71 | 0.09 | 0.72 | 0.08 | 0.73 | 0.08 | 0.73 | 0.08 | 0.74 | 0.08 |
| 1 month | 0.74 | 0.08 | 0.75 | 0.08 | 0.76 | 0.08 | 0.76 | 0.08 | 0.77 | 0.07 |
| 2 months | 0.76 | 0.08 | 0.78 | 0.07 | 0.78 | 0.07 | 0.79 | 0.07 | 0.81 | 0.12 |
| 6 months | 0.80 | 0.07 | 0.81 | 0.07 | 0.82 | 0.07 | 0.82 | 0.07 | 0.89 | 0.11 |
| 1 year | 0.82 | 0.07 | 0.83 | 0.07 | 0.84 | 0.07 | 0.84 | 0.07 | 0.94 | 0.11 |
| 5 years | 0.87 | 0.08 | 0.88 | 0.08 | 0.88 | 0.08 | 0.88 | 0.08 | 1.03 | 0.12 |
| 50 years | 0.92 | 0.09 | 0.93 | 0.09 | 0.93 | 0.09 | 0.95 | 0.13 | 1.14 | 0.13 |
| 75 years | 0.93 | 0.09 | 0.94 | 0.09 | 0.94 | 0.09 | 0.96 | 0.14 | 1.15 | 0.14 |
| 100 years | 0.94 | 0.09 | 0.95 | 0.09 | 0.95 | 0.09 | 0.98 | 0.14 | 1.17 | 0.14 |
Table B-70. Three-axle EV statistical parameters of live load reaction for ADTT = 2,500.
| Reaction | 30 ft | 60 ft | 80 ft | 120 ft | 200 ft | |||||
|---|---|---|---|---|---|---|---|---|---|---|
| Bias | V | Bias | V | Bias | V | Bias | V | Bias | V | |
| 1 day | 0.62 | 0.11 | 0.65 | 0.10 | 0.65 | 0.10 | 0.65 | 0.10 | 0.66 | 0.10 |
| 2 weeks | 0.74 | 0.08 | 0.76 | 0.08 | 0.76 | 0.08 | 0.77 | 0.07 | 0.77 | 0.07 |
| 1 month | 0.77 | 0.08 | 0.79 | 0.07 | 0.79 | 0.07 | 0.79 | 0.07 | 0.83 | 0.11 |
| 2 months | 0.79 | 0.07 | 0.81 | 0.07 | 0.81 | 0.07 | 0.82 | 0.07 | 0.88 | 0.11 |
| 6 months | 0.83 | 0.07 | 0.84 | 0.07 | 0.84 | 0.07 | 0.85 | 0.07 | 0.95 | 0.11 |
| 1 year | 0.85 | 0.08 | 0.86 | 0.07 | 0.86 | 0.07 | 0.87 | 0.07 | 0.99 | 0.11 |
| 5 years | 0.89 | 0.08 | 0.90 | 0.08 | 0.90 | 0.08 | 0.91 | 0.08 | 1.07 | 0.12 |
| 50 years | 0.94 | 0.09 | 0.95 | 0.09 | 0.95 | 0.09 | 0.99 | 0.14 | 1.17 | 0.14 |
| 75 years | 0.95 | 0.09 | 0.96 | 0.09 | 0.96 | 0.09 | 1.00 | 0.15 | 1.19 | 0.14 |
| 100 years | 0.96 | 0.09 | 0.96 | 0.09 | 0.97 | 0.09 | 1.02 | 0.15 | 1.20 | 0.15 |
Table B-71. Three-axle EV statistical parameters of live load reaction for ADTT = 5,000.
| Reaction | 30 ft | 60 ft | 80 ft | 120 ft | 200 ft | |||||
|---|---|---|---|---|---|---|---|---|---|---|
| Bias | V | Bias | V | Bias | V | Bias | V | Bias | V | |
| 1 day | 0.66 | 0.10 | 0.68 | 0.09 | 0.68 | 0.09 | 0.69 | 0.09 | 0.69 | 0.09 |
| 2 weeks | 0.77 | 0.08 | 0.78 | 0.07 | 0.79 | 0.07 | 0.79 | 0.07 | 0.82 | 0.11 |
| 1 month | 0.79 | 0.07 | 0.81 | 0.07 | 0.81 | 0.07 | 0.82 | 0.07 | 0.88 | 0.11 |
| 2 months | 0.82 | 0.07 | 0.83 | 0.07 | 0.83 | 0.07 | 0.84 | 0.07 | 0.92 | 0.11 |
| 6 months | 0.85 | 0.08 | 0.86 | 0.07 | 0.86 | 0.07 | 0.87 | 0.07 | 0.99 | 0.11 |
| 1 year | 0.87 | 0.08 | 0.88 | 0.08 | 0.88 | 0.08 | 0.88 | 0.08 | 1.03 | 0.12 |
| 5 years | 0.91 | 0.08 | 0.92 | 0.08 | 0.92 | 0.08 | 0.92 | 0.08 | 1.11 | 0.13 |
| 50 years | 0.96 | 0.09 | 0.96 | 0.09 | 0.97 | 0.09 | 1.02 | 0.15 | 1.20 | 0.15 |
| 75 years | 0.96 | 0.10 | 0.97 | 0.10 | 0.98 | 0.10 | 1.03 | 0.16 | 1.22 | 0.15 |
| 100 years | 0.97 | 0.10 | 0.98 | 0.10 | 0.98 | 0.10 | 1.04 | 0.16 | 1.23 | 0.15 |
Table B-72. Three-axle EV statistical parameters of live load reaction for ADTT = 10,000.
| Reaction | 30 ft | 60 ft | 80 ft | 120 ft | 200 ft | |||||
|---|---|---|---|---|---|---|---|---|---|---|
| Bias | V | Bias | V | Bias | V | Bias | V | Bias | V | |
| 1 day | 0.69 | 0.09 | 0.71 | 0.08 | 0.71 | 0.08 | 0.72 | 0.08 | 0.72 | 0.08 |
| 2 weeks | 0.79 | 0.07 | 0.81 | 0.07 | 0.81 | 0.07 | 0.81 | 0.07 | 0.87 | 0.11 |
| 1 month | 0.82 | 0.07 | 0.83 | 0.07 | 0.83 | 0.07 | 0.84 | 0.07 | 0.92 | 0.11 |
| 2 months | 0.84 | 0.07 | 0.85 | 0.07 | 0.85 | 0.07 | 0.86 | 0.07 | 0.97 | 0.11 |
| 6 months | 0.87 | 0.08 | 0.88 | 0.08 | 0.88 | 0.08 | 0.88 | 0.08 | 1.03 | 0.12 |
| 1 year | 0.88 | 0.08 | 0.89 | 0.08 | 0.90 | 0.08 | 0.90 | 0.08 | 1.06 | 0.12 |
| 5 years | 0.92 | 0.09 | 0.93 | 0.09 | 0.93 | 0.09 | 0.95 | 0.13 | 1.14 | 0.13 |
| 50 years | 0.97 | 0.10 | 0.98 | 0.10 | 0.98 | 0.10 | 1.04 | 0.16 | 1.23 | 0.15 |
| 75 years | 0.98 | 0.10 | 0.99 | 0.10 | 0.99 | 0.10 | 1.06 | 0.17 | 1.24 | 0.16 |
| 100 years | 0.98 | 0.10 | 0.99 | 0.10 | 0.99 | 0.10 | 1.07 | 0.17 | 1.25 | 0.16 |
Table B-73. Three-axle EV statistical parameters of live load negative moment for ADTT = 250.
| Negative Moment | 30 ft | 60 ft | 80 ft | 120 ft | 200 ft | |||||
|---|---|---|---|---|---|---|---|---|---|---|
| Bias | V | Bias | V | Bias | V | Bias | V | Bias | V | |
| 1 day | 0.54 | 0.14 | 0.52 | 0.14 | 0.53 | 0.14 | 0.54 | 0.14 | 0.58 | 0.14 |
| 2 weeks | 0.70 | 0.10 | 0.66 | 0.10 | 0.72 | 0.05 | 0.71 | 0.27 | 0.87 | 0.14 |
| 1 month | 0.74 | 0.09 | 0.70 | 0.09 | 0.79 | 0.06 | 0.78 | 0.25 | 0.95 | 0.13 |
| 2 months | 0.77 | 0.08 | 0.73 | 0.08 | 0.85 | 0.06 | 0.84 | 0.23 | 1.03 | 0.12 |
| 6 months | 0.81 | 0.08 | 0.77 | 0.07 | 0.95 | 0.07 | 0.95 | 0.20 | 1.15 | 0.12 |
| 1 year | 0.84 | 0.08 | 0.79 | 0.07 | 1.01 | 0.07 | 1.02 | 0.18 | 1.21 | 0.12 |
| 5 years | 0.89 | 0.08 | 0.88 | 0.10 | 1.13 | 0.07 | 1.16 | 0.14 | 1.35 | 0.13 |
| 50 years | 0.96 | 0.09 | 1.05 | 0.06 | 1.26 | 0.08 | 1.32 | 0.15 | 1.50 | 0.16 |
| 75 years | 0.97 | 0.09 | 1.07 | 0.06 | 1.28 | 0.08 | 1.35 | 0.16 | 1.52 | 0.17 |
| 100 years | 0.98 | 0.10 | 1.09 | 0.06 | 1.29 | 0.08 | 1.36 | 0.17 | 1.54 | 0.17 |
Table B-74. Three-axle EV statistical parameters of live load negative moment for ADTT = 1,000.
| Negative Moment | 30 ft | 60 ft | 80 ft | 120 ft | 200 ft | |||||
|---|---|---|---|---|---|---|---|---|---|---|
| Bias | V | Bias | V | Bias | V | Bias | V | Bias | V | |
| 1 day | 0.62 | 0.12 | 0.60 | 0.12 | 0.61 | 0.04 | 0.61 | 0.11 | 0.72 | 0.14 |
| 2 weeks | 0.76 | 0.08 | 0.72 | 0.08 | 0.85 | 0.06 | 0.84 | 0.24 | 1.03 | 0.12 |
| 1 month | 0.80 | 0.08 | 0.75 | 0.08 | 0.92 | 0.07 | 0.91 | 0.21 | 1.11 | 0.12 |
| 2 months | 0.82 | 0.08 | 0.78 | 0.07 | 0.98 | 0.07 | 0.98 | 0.19 | 1.18 | 0.12 |
| 6 months | 0.86 | 0.08 | 0.81 | 0.07 | 1.06 | 0.07 | 1.08 | 0.16 | 1.27 | 0.12 |
| 1 year | 0.89 | 0.08 | 0.86 | 0.10 | 1.11 | 0.07 | 1.14 | 0.15 | 1.33 | 0.13 |
| 5 years | 0.93 | 0.09 | 0.98 | 0.07 | 1.21 | 0.08 | 1.26 | 0.14 | 1.44 | 0.15 |
| 50 years | 0.99 | 0.10 | 1.13 | 0.07 | 1.32 | 0.08 | 1.40 | 0.18 | 1.57 | 0.18 |
| 75 years | 1.00 | 0.10 | 1.15 | 0.08 | 1.34 | 0.08 | 1.42 | 0.19 | 1.60 | 0.19 |
| 100 years | 1.01 | 0.10 | 1.17 | 0.08 | 1.35 | 0.08 | 1.44 | 0.19 | 1.61 | 0.19 |
Table B-75. Three-axle EV statistical parameters of live load negative moment for ADTT = 2,500.
| Negative Moment | 30 ft | 60 ft | 80 ft | 120 ft | 200 ft | |||||
|---|---|---|---|---|---|---|---|---|---|---|
| Bias | V | Bias | V | Bias | V | Bias | V | Bias | V | |
| 1 day | 0.68 | 0.10 | 0.64 | 0.10 | 0.69 | 0.05 | 0.67 | 0.27 | 0.83 | 0.14 |
| 2 weeks | 0.80 | 0.08 | 0.76 | 0.08 | 0.93 | 0.07 | 0.93 | 0.21 | 1.12 | 0.12 |
| 1 month | 0.83 | 0.08 | 0.78 | 0.07 | 1.00 | 0.07 | 1.00 | 0.18 | 1.20 | 0.12 |
| 2 months | 0.86 | 0.08 | 0.81 | 0.07 | 1.05 | 0.07 | 1.06 | 0.16 | 1.26 | 0.12 |
| 6 months | 0.89 | 0.08 | 0.88 | 0.10 | 1.13 | 0.07 | 1.16 | 0.14 | 1.34 | 0.13 |
| 1 year | 0.91 | 0.08 | 0.93 | 0.08 | 1.17 | 0.07 | 1.21 | 0.14 | 1.39 | 0.14 |
| 5 years | 0.96 | 0.09 | 1.05 | 0.06 | 1.26 | 0.08 | 1.32 | 0.15 | 1.50 | 0.16 |
| 50 years | 1.01 | 0.11 | 1.18 | 0.08 | 1.36 | 0.09 | 1.45 | 0.20 | 1.62 | 0.19 |
| 75 years | 1.02 | 0.11 | 1.20 | 0.09 | 1.38 | 0.09 | 1.47 | 0.21 | 1.64 | 0.20 |
| 100 years | 1.03 | 0.11 | 1.21 | 0.09 | 1.39 | 0.09 | 1.48 | 0.21 | 1.66 | 0.20 |
Table B-76. Three-axle EV statistical parameters of live load negative moment for ADTT = 5,000.
| Negative Moment | 30 ft | 60 ft | 80 ft | 120 ft | 200 ft | |||||
|---|---|---|---|---|---|---|---|---|---|---|
| Bias | V | Bias | V | Bias | V | Bias | V | Bias | V | |
| 1 day | 0.71 | 0.09 | 0.68 | 0.09 | 0.75 | 0.06 | 0.74 | 0.26 | 0.91 | 0.13 |
| 2 weeks | 0.83 | 0.08 | 0.78 | 0.07 | 0.99 | 0.07 | 0.99 | 0.19 | 1.19 | 0.12 |
| 1 month | 0.86 | 0.08 | 0.81 | 0.07 | 1.05 | 0.07 | 1.06 | 0.16 | 1.26 | 0.12 |
| 2 months | 0.88 | 0.08 | 0.84 | 0.11 | 1.10 | 0.07 | 1.12 | 0.15 | 1.31 | 0.13 |
| 6 months | 0.91 | 0.08 | 0.93 | 0.09 | 1.17 | 0.07 | 1.21 | 0.14 | 1.39 | 0.14 |
| 1 year | 0.93 | 0.09 | 0.98 | 0.07 | 1.21 | 0.08 | 1.26 | 0.14 | 1.44 | 0.15 |
| 5 years | 0.98 | 0.10 | 1.09 | 0.06 | 1.29 | 0.08 | 1.36 | 0.17 | 1.54 | 0.17 |
| 50 years | 1.03 | 0.11 | 1.21 | 0.09 | 1.39 | 0.09 | 1.48 | 0.21 | 1.66 | 0.20 |
| 75 years | 1.04 | 0.11 | 1.23 | 0.10 | 1.40 | 0.09 | 1.50 | 0.22 | 1.68 | 0.21 |
| 100 years | 1.04 | 0.11 | 1.24 | 0.10 | 1.41 | 0.09 | 1.52 | 0.23 | 1.69 | 0.21 |
Table B-77. Three-axle EV statistical parameters of live load negative moment for ADTT = 10,000.
| Negative Moment | 30 ft | 60 ft | 80 ft | 120 ft | 200 ft | |||||
|---|---|---|---|---|---|---|---|---|---|---|
| Bias | V | Bias | V | Bias | V | Bias | V | Bias | V | |
| 1 day | 0.75 | 0.08 | 0.71 | 0.08 | 0.82 | 0.06 | 0.81 | 0.25 | 0.99 | 0.13 |
| 2 weeks | 0.86 | 0.08 | 0.80 | 0.07 | 1.05 | 0.07 | 1.06 | 0.17 | 1.25 | 0.12 |
| 1 month | 0.88 | 0.08 | 0.84 | 0.11 | 1.10 | 0.07 | 1.12 | 0.15 | 1.31 | 0.13 |
| 2 months | 0.90 | 0.08 | 0.90 | 0.09 | 1.14 | 0.07 | 1.18 | 0.14 | 1.37 | 0.14 |
| 6 months | 0.93 | 0.09 | 0.98 | 0.07 | 1.21 | 0.08 | 1.26 | 0.14 | 1.44 | 0.15 |
| 1 year | 0.95 | 0.09 | 1.03 | 0.06 | 1.25 | 0.08 | 1.31 | 0.15 | 1.48 | 0.16 |
| 5 years | 0.99 | 0.10 | 1.13 | 0.07 | 1.32 | 0.08 | 1.40 | 0.18 | 1.57 | 0.18 |
| 50 years | 1.04 | 0.11 | 1.24 | 0.10 | 1.41 | 0.09 | 1.52 | 0.23 | 1.69 | 0.21 |
| 75 years | 1.05 | 0.12 | 1.26 | 0.11 | 1.43 | 0.09 | 1.53 | 0.24 | 1.71 | 0.21 |
| 100 years | 1.06 | 0.12 | 1.27 | 0.11 | 1.44 | 0.09 | 1.55 | 0.24 | 1.72 | 0.22 |
B.3 Permit Vehicles
The research team developed the live load models for Strength II limit state based on the New Jersey permit records (Lou et al. 2018). More than 208,487 permit vehicle registration records from 2010 to 2015 in New Jersey were used to develop the statistical live loads for reliability analysis. The permit data were filtered for the oversized vehicles using the federal bridge formula. The distribution of GVW is best described as a Type II extreme value distribution (Fréchet) as shown in Figure B-13. Load effects, including simple span positive moment, simple span shear force, and continuous span negative moment are calculated for different span lengths, ranging from 20 ft to 200 ft with an increment of 20 ft. The results can serve as input for the load side when performing reliability calibration. Extrapolation of the simple span positive moment for short span (40 ft), medium span (120 ft), and long span (200 ft) are shown as examples in Figure B-14(a), (b), and (c), respectively. The statistical parameters, including mean and V of bias ratio at the different levels are presented in Table B-78, Table B-79, and Table B-80 for the simple span positive moment, simple span shear, and continuous span negative moment, respectively.

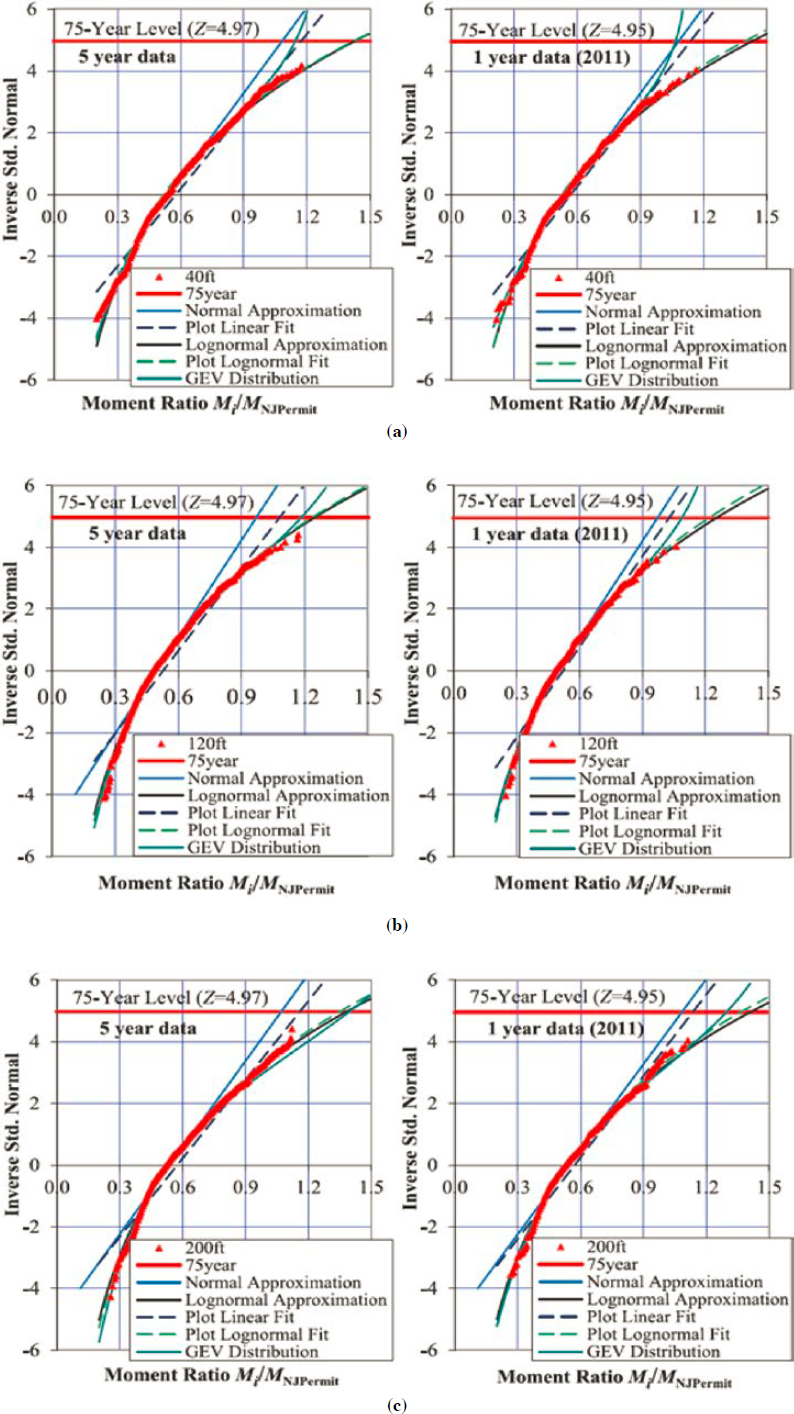
Table B-78. Statistical parameters of live load for simple span positive moment.
| Span length (ft) | 75 years | 10 years | 5 years | 1 year | ||||
|---|---|---|---|---|---|---|---|---|
| λ | V | λ | V | λ | V | λ | V | |
| 20 | 1.39 | 18% | 1.29 | 18% | 1.25 | 18% | 1.17 | 18% |
| 40 | 1.43 | 20% | 1.32 | 20% | 1.28 | 20% | 1.19 | 20% |
| 60 | 1.32 | 20% | 1.22 | 20% | 1.18 | 20% | 1.10 | 20% |
| 80 | 1.19 | 19% | 1.10 | 19% | 1.07 | 19% | 0.99 | 19% |
| 100 | 1.19 | 19% | 1.10 | 19% | 1.07 | 19% | 1.00 | 19% |
| 120 | 1.25 | 19% | 1.15 | 19% | 1.12 | 19% | 1.05 | 19% |
| 140 | 1.30 | 19% | 1.20 | 19% | 1.17 | 19% | 1.09 | 19% |
| 160 | 1.33 | 19% | 1.23 | 19% | 1.20 | 19% | 1.12 | 19% |
| 180 | 1.36 | 19% | 1.26 | 19% | 1.22 | 19% | 1.14 | 19% |
| 200 | 1.38 | 19% | 1.28 | 19% | 1.24 | 19% | 1.16 | 19% |
| Max | 1.43 | 20% | 1.32 | 20% | 1.28 | 20% | 1.19 | 20% |
| Min | 1.19 | 18% | 1.10 | 18% | 1.07 | 18% | 0.99 | 18% |
| Average | 1.31 | 19% | 1.21 | 19% | 1.18 | 19% | 1.10 | 19% |
Table B-79. Statistical parameters of live load for simple span shear.
| Span length (ft) | 75 years | 10 years | 5 years | 1 year | ||||
|---|---|---|---|---|---|---|---|---|
| λ | V | λ | V | λ | V | λ | V | |
| 20 | 1.14 | 18% | 1.05 | 18% | 1.03 | 18% | 0.96 | 18% |
| 40 | 1.25 | 20% | 1.15 | 20% | 1.12 | 20% | 1.04 | 20% |
| 60 | 1.13 | 19% | 1.04 | 19% | 1.01 | 19% | 0.94 | 19% |
| 80 | 1.19 | 20% | 1.10 | 20% | 1.07 | 20% | 1.00 | 20% |
| 100 | 1.26 | 20% | 1.16 | 20% | 1.13 | 20% | 1.05 | 20% |
| 120 | 1.30 | 20% | 1.20 | 20% | 1.16 | 20% | 1.08 | 20% |
| 140 | 1.24 | 20% | 1.15 | 20% | 1.12 | 20% | 1.04 | 20% |
| 160 | 1.24 | 19% | 1.15 | 19% | 1.11 | 19% | 1.04 | 19% |
| 180 | 1.26 | 20% | 1.17 | 20% | 1.13 | 20% | 1.06 | 20% |
| 200 | 1.28 | 20% | 1.19 | 20% | 1.15 | 20% | 1.07 | 20% |
| Max | 1.30 | 20% | 1.20 | 20% | 1.16 | 20% | 1.08 | 20% |
| Min | 1.13 | 18% | 1.04 | 18% | 1.01 | 18% | 0.94 | 18% |
| Average | 1.23 | 19% | 1.14 | 19% | 1.10 | 19% | 1.03 | 19% |
Table B-80. Statistical parameters of live load for continuous span negative moment.
| Span length (ft) | 75 years | 10 years | 5 years | 1 year | ||||
|---|---|---|---|---|---|---|---|---|
| λ | V | λ | V | λ | V | λ | V | |
| 20 | 1.03 | 18% | 0.96 | 18% | 0.93 | 18% | 0.87 | 18% |
| 40 | 1.06 | 21% | 0.97 | 21% | 0.94 | 21% | 0.87 | 21% |
| 60 | 1.37 | 21% | 1.26 | 21% | 1.22 | 21% | 1.13 | 21% |
| 80 | 1.42 | 22% | 1.30 | 22% | 1.26 | 22% | 1.16 | 22% |
| 100 | 1.19 | 21% | 1.10 | 21% | 1.06 | 21% | 0.98 | 21% |
| 120 | 1.08 | 20% | 0.99 | 20% | 0.96 | 20% | 0.90 | 20% |
| 140 | 1.08 | 20% | 1.00 | 20% | 0.97 | 20% | 0.90 | 20% |
| 160 | 1.10 | 20% | 1.01 | 20% | 0.98 | 20% | 0.91 | 20% |
| 180 | 1.11 | 20% | 1.03 | 20% | 1.00 | 20% | 0.93 | 20% |
| 200 | 1.13 | 20% | 1.04 | 20% | 1.01 | 20% | 0.94 | 20% |
| Max | 1.42 | 22% | 1.30 | 22% | 1.26 | 22% | 1.16 | 22% |
| Min | 1.03 | 18% | 0.96 | 18% | 0.93 | 18% | 0.87 | 18% |
| Average | 1.16 | 20% | 1.06 | 20% | 1.03 | 20% | 0.96 | 20% |
B.4 References
AASHTO. (2018). The Manual for Bridge Evaluation, 3rd ed. Washington, DC.
Fire Apparatus Manufacturers’ Association. Emergency Vehicle Size and Weight Guide. (2017). Ocala, FL. https://www.fama.org/wp-content/uploads/2017/12/1514564588_5a466bec19c41.pdf.
Load Rating for the FAST Act’s Emergency Vehicles. 2016. FHWA Memorandum, Washington, DC. https://www.fhwa.dot.gov/bridge/loadrating/161103.cfm.
Lou, P., Gao, D., Nassif, H., and Reddy, M. (2019). Reliability Assessment of Steel Bridges for Specialized Hauling Vehicles. Transportation Research Record: Journal of the Transportation Research Board, No. 2673(12), pp. 391–403.
Lou, P., Nassif, H., and Truban, P. (2018). Development of Live Load Model for Strength II Limit State in AASHTO LRFD Design Specifications. Transportation Research Record: Journal of the Transportation Research Board, No. 672(41), pp. 11–23.
Lou, P., Yang, C., and Nassif, H. (2021). Impact of Specialized Hauling Vehicles and Emergency Vehicles on Bridge Load Rating. Transportation Research Record: Journal of the Transportation Research Board, No. 2675(10), pp. 1012–1024.
Modjeski and Masters, Inc., University of Nebraska–Lincoln, University of Delaware, and NCS Consultants, LLC. (2015). SHRP 2 Report S-2-R19B-RW-1: Bridges for Service Life Beyond 100 Years: Service Limit State Design, Transportation Research Board, Washington, DC.
Zokaie, T., Imbsen, R. A., and Osterkamp, T. A. (1991). Distribution of Wheel Loads on Highway Bridges. Transportation Research Record: Journal of the Transportation Research Board, No. 1290, pp. 119–126.
This page intentionally left blank.
Abbreviations and acronyms used without definitions in TRB publications:
| A4A | Airlines for America |
| AAAE | American Association of Airport Executives |
| AASHO | American Association of State Highway Officials |
| AASHTO | American Association of State Highway and Transportation Officials |
| ACI–NA | Airports Council International–North America |
| ACRP | Airport Cooperative Research Program |
| ADA | Americans with Disabilities Act |
| APTA | American Public Transportation Association |
| ASCE | American Society of Civil Engineers |
| ASME | American Society of Mechanical Engineers |
| ASTM | American Society for Testing and Materials |
| ATA | American Trucking Associations |
| CTAA | Community Transportation Association of America |
| CTBSSP | Commercial Truck and Bus Safety Synthesis Program |
| DHS | Department of Homeland Security |
| DOE | Department of Energy |
| EPA | Environmental Protection Agency |
| FAA | Federal Aviation Administration |
| FAST | Fixing America’s Surface Transportation Act (2015) |
| FHWA | Federal Highway Administration |
| FMCSA | Federal Motor Carrier Safety Administration |
| FRA | Federal Railroad Administration |
| FTA | Federal Transit Administration |
| GHSA | Governors Highway Safety Association |
| HMCRP | Hazardous Materials Cooperative Research Program |
| IEEE | Institute of Electrical and Electronics Engineers |
| ISTEA | Intermodal Surface Transportation Efficiency Act of 1991 |
| ITE | Institute of Transportation Engineers |
| MAP-21 | Moving Ahead for Progress in the 21st Century Act (2012) |
| NASA | National Aeronautics and Space Administration |
| NASAO | National Association of State Aviation Officials |
| NCFRP | National Cooperative Freight Research Program |
| NCHRP | National Cooperative Highway Research Program |
| NHTSA | National Highway Traffic Safety Administration |
| NTSB | National Transportation Safety Board |
| PHMSA | Pipeline and Hazardous Materials Safety Administration |
| RITA | Research and Innovative Technology Administration |
| SAE | Society of Automotive Engineers |
| SAFETEA-LU | Safe, Accountable, Flexible, Efficient Transportation Equity Act: A Legacy for Users (2005) |
| TCRP | Transit Cooperative Research Program |
| TEA-21 | Transportation Equity Act for the 21st Century (1998) |
| TRB | Transportation Research Board |
| TSA | Transportation Security Administration |
| U.S. DOT | United States Department of Transportation |