Measuring Literacy: Performance Levels for Adults (2005)
Chapter: Appendix D September 2004 Bookmark Standard-Setting Session with the 2003 NAAL Data
Appendix D
September 2004 Bookmark Standard-Setting Session with the 2003 NAAL Data
This appendix details how the bookmark procedure was implemented and reports results for the committee’s September session. Follow ing the text are the background materials, which include the agenda, participant questionnaires, tables, and figures for the September session.
A total of 30 panelists from the fields of adult education, middle and high school English language arts, industrial and organizational psychology, and state offices of adult education participated in the second standard setting, held over three days in September 2004. Six of the panelists had participated in the July standard setting. These six individuals returned in September as table leaders, which added continuity of process and familiarity of material to the second session (the agenda is included in Background Materials at the end of this appendix).
BOOKMARK STANDARD SETTING WITH THE 2003 NAAL DATA
As in July, panelists were given a questionnaire to collect background information (a blank questionnaire is included in Background Materials at the end of this appendix). Almost half (46.7 percent, n = 14) of the September participants had managerial responsibilities for adult education in their states or regional areas, although several (20 percent, n = 6) were also instructors in adult education. Half (50 percent, n = 14) of the participants who completed the questionnaire reported they were somewhat familiar with NAAL prior to participating in the standard-setting activities; five (17.9 percent) reported that they were very familiar with NAAL, and nine (32.1 percent) said they were unfamiliar with NAAL prior to the standard
setting. In addition, participants responded that their work environments were predominantly urban (48.1 percent, n = 13) or suburban (37 percent, n = 10).
On the basis of the primary responsibilities listed on their resumes, the 29 panelists were classified into five areas of expertise: Adult Basic Education (ABE), General Educational Development (GED), English for Speakers of Other Languages (ESOL), middle or high school language arts (grades 6-12), and industrial and organizational psychology. Participants were randomly assigned to one of six tables of five people. Four of the six tables had a representative from each of the five areas of expertise; one table included a workplace and labor force literacy expert.
Once panelists were assigned to tables, the groups were then randomly assigned to literacy areas using the same counterbalancing design used in July (Table D-1). Two tables worked on prose literacy first; one of these tables was then assigned to work on document literacy and the other to work on quantitative literacy. Two tables worked on document literacy first; one of these tables was assigned to work on quantitative literacy and the other to work on prose literacy. The remaining two tables that worked on quantitative literacy first were similarly divided for the second content area: one table was assigned to work on prose literacy while the other was assigned to work on document literacy. Again, the bookmark placements were designated as Occasion 1 or Occasion 2 to indicate the order with which the table work on each assigned literacy area.
Ordered Item Booklets
The ordered item booklets used for the second standard setting were organized in the same way as for the first standard setting. One small change, however, was that some of the NAAL test questions were scored according to a partial credit scheme. This means that answers were scored as wrong, partially correct, or fully correct. When a partial credit scoring scheme is used, a difficulty value is estimated for both the partially correct score and the fully correct score. As a result, the test questions have to appear multiple times in the ordered item booklet, once for the difficulty value associated with partially correct and a second time for the difficulty value associated with fully correct. The ordered item booklets included the scoring rubric for determining partial credit and full credit scores.
Training Procedures
Training procedures in September were similar to those used in July. Table leader training was held the day before the standard setting, and panelist training was held on the first day of the standard setting. The
majority of materials presented to the September panelists during the three-hour training session were the same as those presented in July, and most of the procedures were the same.
Conducting the Standard Setting
The procedures used in September were similar to those used in July, with the exception that the committee decided that all panelists in September should use the instructions for a response probability of 67 percent. This meant that the design for the standard setting could follow more typical bookmark procedures. That is, groups of panelists usually work on the same ordered item booklet at different tables during Rounds 1 and 2 but join each other for Round 3 discussions. Therefore, in September, the two tables working on the same literacy area were merged for the Round 3 discussion.
During Round 3, panelists received data summarizing bookmark placements for the two tables combined. This included a listing of each panelist’s bookmark placements and the median bookmark placements by table. In addition, the combined median scale score (based on the data from both tables) was calculated for each level, and impact data provided about the percentages of adults who would fall into the below basic, basic, intermediate, and advanced categories if the combined median values were used as cut scores. (Because the full 2003 NAAL data set was not ready in time for the standard setting, the impact data used for Round 3 were based on the 1992 NALS results.) Panelists from both tables discussed their reasons for choosing different bookmark placements, after which each panelist independently made his or her final judgments about bookmark placements for the basic, intermediate, and advanced literacy levels.
As in July, panelists in September were asked to complete a satisfaction questionnaire about their perception of the standard-setting process at the end of the session.1 The majority (93 percent, n = 28) reported that they were very satisfied with the organization of the event (Question 7) and that they were either satisfied (30 percent, n = 9) or very satisfied (63 percent, n = 19) with the cut score decisions of their table (Question 8).
As in July, panelists were also asked, questions about their background experiences with adult education and their familiarity with NAAL prior to the standard-setting session. Questions added to the panelist professional and personal information questionnaire (see page 299) based on feedback
from the July participants included a series of three questions on how well participants understood the context of the test, the meaning of the performance levels, and the meaning of the bookmark placement. Results from this questionnaire were positive. A total of 28 panelists (93 percent) reported that they were very comfortable with the context of the test, the meaning of the performance levels, and the meaning of the bookmark placement (the remaining two individuals did not complete this part of the questionnaire).
Revising the Performance-Level Descriptions
At the conclusion of the September standard setting, 12 of the panelists were asked to stay for an extended session to write performance-level descriptions for the NAAL items. The panelists represented a cross-section of the larger group, in that at least one member from each of the six tables particpated in the extended session and there was representation as well from each of the three areas of expertise (adult education, middle and high school English language arts, and industrial and organizational psychology). The 12 participants were split into 3 groups of 4, with each group focusing on one of the three NAAL literacy areas. A period of approximately two hours was allotted for the panelists to discuss and suggest revisions to the performance-level descriptions. At this point, specific examples of, and references to, items and stimuli in the released NALS items were incorporated into the performance-level descriptions.2
RESULTS OF STANDARD SETTING WITH 2003 DATA
The methods for the September standard setting were, for the most part, the same as those used during the July session with respect to the sequencing of the standard-setting activities. The primary difference between the July and September sessions was that the committee had decided, partly on the basis of the analyses of the July standard-setting data, that panelists would use only a response probability of 67 percent (rp67) in the September session. This decision allowed the standard-setting design to be fully counterbalanced (Table D-1). That is, panelists at Tables 1 and 2 worked with prose items during Occasion 1; during Occasion 2, panelists at Table 1 worked with the document literacy items while Table 2 panelists worked with the quantitative items. Another difference between the July and September sessions was that, in July, use of multiple rp assignments
2 | The final performance-level descriptions and exemplars are presented in Table 5-4 of the report. |
precluded having panelists from different tables join each other during Round 3. Because all panelists in September used the same rp level, those working on the same literacy area at two different tables were able to merge into one table for the Round 3 discussion, a practice advocated by the developers of the bookmark procedure (Mitzel et al., 2001). Results from this session are reported below.
Prose
A complete listing of all judgments made by each panelist who reviewed the prose literacy scale at the September standard-setting session is presented in Tables D-2A, D-2B, and D-2C. The information included in the table consists of each participant’s bookmark placement for each round, as well as the corresponding scale score.3 The table number used by each panelist is provided, as well as an indication of whether a given literacy scale was reviewed by the panelist first (i.e., Occasion 1) or second (i.e., Occasion 2).
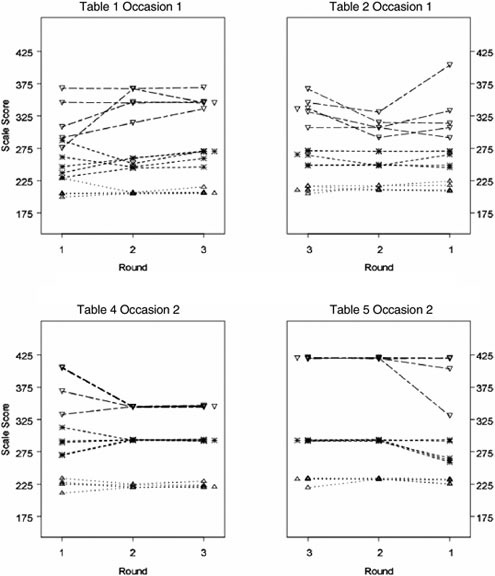
Figure D-1 provides a visual depiction of the cut scores associated with panelists’ bookmark placement decisions across the three rounds. These graphs are presented in a slightly different manner than for the July standard setting. Tables 1 and 2 examined the prose ordered item booklets in Occasion 1 (top two graphs), and unlike the July standard setting, panelists at these two tables joined each other after Round 2. Therefore, the graphs are presented as mirror opposites—the top left-hand graph shows the placements moving from Round 1 to Round 3; the top right-hand graph shows the placements moving from Round 3 to Round 1. This provides a means for easily comparing the extent of agreement across the two tables after Round 3. The bottom two graphs show the same information for Tables 4 and 5 working with prose items during Occasion 2.
Overall, the variability in panelists’ cut scores tended to decrease across the rounds, particularly for the basic and intermediate performance levels. At Tables 1 and 2, considerable variability was evident in the advanced level cut scores, even at Round 3; agreement about the advanced level cut scores was better for Tables 4 and 5.
A summary of the Round 3 combined (Occasion 1 and 2) cut scores for prose literacy from July and September is given in Table D-3. The variability in the advanced cut score is evident in the standard deviations in this table.
Document
A complete listing of all judgments made by each panelist who reviewed the document literacy scale at the September standard setting session is presented in Tables D-4.
Figure D-2 portrays the cut scores associated with panelists’ bookmark placements for each of the three rounds. Here, Tables 3 and 4 reviewed the document items during Occasion 1 (top two graphs); and Tables 1 and 6 reviewed the document items during Occasion 2 (bottom two graphs). Again, convergence in the cut scores is apparent by Round 3 for the basic and intermediate performance levels. Considerable disparity is present for the advanced level at all tables except Table 4.
A summary of the Round 3 combined (Occasion 1, Occasion 2) cut scores for document literacy for July and September is given in Table D-5. Again, the divergence in opinion about the advanced cut scores is evident in the size of the standard deviation.
Quantitative
A complete listing of all judgments made by each panelist who reviewed the quantitative literacy scale at the September standard setting session is presented in Tables D-6A, D-6B, D-6C. Figure D-3 presents the cut scores associated with panelists’ bookmark decisions across the three rounds. Table 5 and 6 reviewed the quantitative literacy items during Occasion 1 (top two graphs); Tables 2 and 3 reviewed the items during Occasion 2 (bottom two graphs). Overall, there was a trend toward consensus by Round 3, although there was notable variability in cut scores for the advanced level at Table 5 and the basic level at Table 6, even at Round 3. Panelists verbally reported after the standard-setting session that they had more difficulty placing bookmarks for the quantitative section than they did for the prose or document section. A summary of the Round 3 combined (Occasion 1, Occasion 2) cut scores for document literacy from the July and September sessions is given in Table D-7.
Examination of Interrater Agreement
Although the bookmark method does not require panelists to reach consensus on the cut scores, agreement is encouraged. One indication of the quality of the standard-setting process is an examination of the extent to which they agreed with regard to their bookmark placements. This level of agreement is evaluated through estimates of interrater agreement.
To calculate the interrater agreement, we used the reliability feature in Statistical Package for the Social Sciences (SPSS) to estimate the intraclass
correlations among the Round 3 scaled cut scores for each literacy area. These intraclass correlations appear below.
July | Prose | Document | Quantitative |
rp50 | .94 | .95 | .92 |
rp67 | .94 | .97 | .95 |
rp80 | .91 | .92 | .95 |
September | Prose | Document | Quantitative |
rp67 | .94 | .94 | .88 |
These values are all quite high and indicate that rater agreement was at acceptable levels.
ADDITIONAL MATERIALS TO ASSIST IN FUTURE ANALYSES
During the course of our analytic work on the 2003 NAAL data, we received several versions of the data files from NCES and its contractor. The timing of the receipt of these files did not always coincide with the schedule for the committee’s work, and this may necessitate that NCES and its contractors repeat some of the committee’s analyses. To facilitate replication, should it be necessary, we provide additional details from the bookmark standard setting and specify which data files we used for the different stages of our work.
Tables D-8 through D-13 provide additional information from the bookmark standard setting. Each table gives the Round 3 bookmark placements and corresponding cut score by participant, table, response probability value, and occasion for each of the six standard-setting groups (prose, document, and quantitative literacy from July and September sessions). Also included is the identification number of each item on which a bookmark was placed. On these tables, the cut score is the scale score corresponding to the proficiency estimate (given the specified response probability criterion) for the item just before the bookmark placement.
The item parameters used for the July bookmark standard setting were those in the publicly available data file. The transformation constants used to convert IRT proficiency estimates to scaled scores appeared in footnote 3 of Appendix C (p. 228).
The item parameters used for the September bookmark standard setting were those on the file forwarded to us in August 2004, which was based on data for the main NAAL sample but did not include the additional state and inmate samples. The transformation constants used to convert IRT proficiency estimates to scaled scores appeared in footnote 3 of Appendix D (p. 289).
All of the analyses of 2003 test takers (e.g., the population percentages at each performance level, the median literacy scores derived for the quasi-contrasting group procedure) were based on the file delivered to us on January 21, 2005. The transformation constants (scale and location) used to convert IRT proficiency estimates to scaled scores were for prose, 58.480557 and 280.704956; for document, 58.755463 and 274.881560; and for quantitative, 63.311586 and 280.488425.
ACKNOWLEDGMENTS
The committee wishes to acknowledge the assistance and contributions of the individuals who served as panelists for the two bookmark standard settings and provided valuable input on the performance-level descriptions.
Eunice Askov, Pennsylvania State University
Marjorie Ball, Mississippi State Penitentiary, Parchman
Roxanne Bauer, Indianapolis Public Schools, Indiana
Michelle Blantz, South Georgia Technical College
Rhodella Brown, Daytona Beach Community College, Florida
Miriam Burt, Center for Applied Linguistics, Washington, DC
Laura Chenven, AFL-CIO Working for America Institute, Washington, DC
Suzanne Cimochowski, EASTCONN, Hampton, Connecticut
Marie Cora, Hotspur Partners, LLC, Boston
Christopher Coro, Northampton Community College, Pennsylvania
Susan Cowles, Oregon State Department of Community Colleges and Workforce Development
Shari Crockett, Regional Office of Education, Monroe/Randolph Counties, Illinois
Lansing Davis, New Jersey State Employment and Training Commission
Kim Donehower, University of North Dakota
Suzanne Elston, Bradley County Adult Education, Tennessee
Leslie Farr, Ohio State University
Sharon Floyd, Saginaw Public Schools, Michigan
Janet Geary, North Kansas City School District, Missouri
Karen Gianninoto, Salisbury State University, Maryland
Kimberly Gibson, Sierra College, California
Suzanne Grant, Arlington Public Schools, Virginia
Anne Greenwell, Jefferson County Public Schools, Kentucky
Christina Gutierrez, T.C. Williams High School, Alexandria, Virginia
Nancy Hampson, San Diego Community College District, California
James Harris, Caliber Associates, Fairfax, Virginia
Roberta Hawkins, Shorewood High School, Shoreline, Washington
Fran Holthaus, Upper Valley Joint Vocational School, Piqua, Ohio
Sally House, Central Mississippi Correctional Facility, Pearl
Brenda Jeans, Beauregard Parish School Board, Louisiana
Paul Jurmo, New York University
Judy Kihslinger, Waukesha County Technical College, Wisconsin
Terry Kinzel, Big Bend Community College, Washington
Jaqueline Korengel, Commonwealth of Kentucky, Frankfort
Nathan Kuncel, University of Illinois at Urbana-Champaign
Diane Lindahl, Western Wisconsin Technical College
Ardith Loustalet, St. Vrain Valley School District, Colorado
Alfredo Lujan, Monte del Sol Charter School, New Mexico
Sanford Marks, Community College of Southern Nevada
Peggy McGuire, University of Tennessee
Maureen Meehan, University of Illinois at Chicago
Doug Molitor, 3M, St. Paul, Minnesota
Donald Mott, Wilson Mott & Associates, Greenville, North Carolina
Vivian Mott, East Carolina University
Bill Muth, U.S. Federal Bureau of Prisons, Washington, DC
Connie Nelson, Massachusetts Worker Education Roundtable, Boston
Donna Nola-Ganey, Louisiana Department of Education, Baton Rouge
Peg Perri, Western Wisconsin Technical College
Rebecca Rogers, Washington University in St. Louis
Teresa Russell, Independent Consultant, Minnesota
Sally Sandy, Parkway School District, Missouri
Kathleen Santopietro Weddel, Colorado Department of Education
Diane Schroeder, St. Charles Community College, Missouri
Don Seaman, Texas Center for the Advancement of Literacy and Learning, College Station
Jane Siveria, Florida Department of Education, Tallahassee
Cristine Smith, World Education, Inc., Boston
Maggie Sokolik, University of California, Berkeley
Linda Stacy, Owens Community College, Ohio
Linda Taylor, Comprehensive Adult Student Assessment System, San Diego
Ray Thompson, Middle Georgia Technical College
Patricia Thorpe, University of Phoenix
Fran Tracy-Mumford, Delaware Department of Education, Dover
Karen Valbrun, Georgia State Department of Technical and Adult Education
Denise Weiner, Delaware Department of Education, Dover
Lynne Weintraub, Jones Library, Amherst, Massachusetts
Ira Yankwitt, Literacy Assistance Center, New York
Linda Young, Oklahoma State Department of Education
BACKGROUND MATERIALS
September Standard-Setting Session
Item
Page
Tables
D-1 | Design of the Bookmark Standard Setting with NAAL Data, September 2004 | |||
D-2 | Participants’ Bookmark Placements and Associated Cut Scores for Prose Literacy, September 2004 | |||
D-3 | Summary Statistics for Round 3 Cut Scores for Prose Literacy Scale, July and September 2004 | |||
D-4 | Participants’ Bookmark Placements and Associated Cut Scores for Document Literacy, September 2004 | |||
D-5 | Summary Statistics for Round 3 Cut Scores for Document Literacy Scale, July and September 2004 | |||
D-6 | Participants’ Bookmark Placements and Associated Cut Scores for Quantitative Literacy, September 2004 | |||
D-7 | Summary Statistics for Round 3 Cut Scores for Quantitative Literacy scale, July and September 2004 | |||
D-8 | Item ID Table for Prose Literacy Bookmark Placements, Round 3, July 2004 | |||
D-9 | Item ID Table for Document Literacy Bookmark Placements, Round 3, July 2004 | |||
D-10 | Item ID Table for Quantitative Literacy Bookmark Placements, Round 3, July 2004 | |||
D-11 | Item ID Table for Prose Literacy Bookmark Placements, Round 3, September 2004 | |||
D-12 | Item ID Table for Document Literacy Bookmark Placements, Round 3, September 2004 | |||
D-13 | Item ID Table for Quantitative Literacy Bookmark Placements, Round 3, September 2004 |
Agenda
Standard-Setting Session for the
National Assessment of Adult Literacy (NAAL)
National Research Council, Washington, DC
September 17-20, 2004
Friday, September 17, 2004—The Day Before the Standard Setting
3:00–3:15 PM | Welcome, Introductions Stuart Elliott, Judy Koenig, NRC Rich Patz, Consultant to NRC |
3:15–5:00 PM | Training for Table Leaders |
Saturday, September 18, 2004—Day 1 of Standard Setting
8:00–8:30 AM | Participant registration Continental breakfast |
8:30–9:00 AM | Welcome, Introductions Stuart Elliott, Judy Koenig, NRC Rich Patz, Consultant to NRC |
9:00–10:20 AM | Training |
10:20–10:30 AM | Break |
10:30 AM–Noon | Training continued |
Noon–1:00 PM | Lunch |
1:00–2:00 PM | Round 1 (1st subject area) Participants review all items of NAAL (1st subject area) individually |
2:00–4:00 PM | Participants at each table, as a group, study and discuss items in the ordered item booklets |
4:00–5:00 PM | Bookmark directions given and Round 1 judgments made (judgments are made individually) |
5:00 PM | First day adjourned |
Sunday, September 19, 2004—Day 2 of Standard Setting
8:00–8:30 AM | Continental breakfast |
8:30–8:45 AM | Large-group meeting |
8:45–10:00 AM | Round 2 (1st subject area) Tables receive their Round 1 judgments Bookmark directions given for Round 2 As a group, discussion about Round 1 data Round 2 judgments made individually |
10:00–10:45 AM | Break |
10:45–Noon | Round 3 (1st subject area, both tables merge) Tables receive impact data from their Round 2 judgments Bookmark directions given for Round 3 Both tables, as a group, discussion about Round 2 data Round 3 judgments made individually |
Noon–1:00 PM | Lunch |
1:00–1:30 PM | Large-group meeting |
1:30–2:30 PM | Round 1 (2nd subject area) Participants review all items of NAAL (2nd subject area) individually |
2:30–4:30 PM | Participants at each table, as a group, study and discuss items in the ordered item booklets |
4:30–5:30 PM | Bookmark directions given and Round 1 judgments made (judgments are made individually) |
5:30 PM | Second day adjourned |
Monday, September 20, 2004—Day 3 of Standard Setting
8:00–8:30 AM | Continental breakfast |
8:30–8:45 AM | Large-group meeting |
8:45–9:45 AM | Round 2 (2nd subject area) Tables receive data from their Round 1 judgments Bookmark directions given for Round 2 As a group, discussion about Round 1 data Round 2 judgments made individually |
9:45–10:30 AM | Break |
10:30–11:30 AM | Round 3 (2nd subject area, both tables merge) Tables receive impact data from their Round 2 judgments Bookmark directions given for Round 3 Both tables, as a group, discussion about Round 2 data Round 3 judgments made individually |
11:30 AM–Noon | Large-group discussion |
Noon | Standard setting meeting adjourned |
12:00–12:30 PM | Box Lunch |
12:30–3:30 PM | Extended session on writing Performance-level descriptions |
Professional and Personal Information Questionnaire
Bookmark Standard-Setting Session for NAAL
September 18-20, 2004
National Research Council, Washington, DC
Please answer the following questions so we better understand the characteristics of our group of standard setting participants.
1. Do your professional responsibilities include direct or managerial responsibilities ‘for the education of adults? _____________________________
___ Yes. I am directly involved as an instructor. For how many years have you had such responsibilities? __________________________________
___Yes. I am involved in a managerial capacity. For how many years have you had such responsibilities? __________________________________
___Yes. I am directly involved with the education of adults but not as an instructor or a manger. In what way are you involved with the education of adults? For how many years have you had such responsibilities? _______
___No. Please characterize your professional responsibilities:
_____________________________________________________________
2. How would you characterize the educational setting for these adults (check any and all that apply):
___Middle or elementary school | ___4-year college or university |
___Traditional high school | ___Graduate or professional school |
___Vocational high school | ___Community college |
___Alternative high school | ___Workplace education setting |
___Adult basic education program | ___GED program |
___English language instruction |
|
___Other. Please describe: _____________________________________ |
|
3. How familiar were you with the National Assessment of Adult Literacy (a.k.a. NAAL) before your participation in the standard-setting activities?
_____ Unfamiliar _____Somewhat familiar ____Very familiar
4. Standard-setting judgments require one to understand: (A) the content of the test (i.e., literacy), (B) the performance-level descriptions, and (C) the standard-setting task (i.e., what it means to place a bookmark in an ordered item book).
A. How well did you understand the content of the test? Please circle one number for each area of literacy for which you set a standard:
| Did not understand at all | Understood completely | |||
Prose literacy: | 1 | 2 | 3 | 4 | 5 |
Document literacy: | 1 | 2 | 3 | 4 | 5 |
Quantitative literacy: | 1 | 2 | 3 | 4 | 5 |
B. How well did you understand the meaning of the performance levels as explained in the performance-level descriptions?
| Did not understand at all | Understood completely | |||
Performance Levels: | 1 | 2 | 3 | 4 | 5 |
C. How well did you understand the meaning of bookmark placement based on your training and the bookmark placement instructions?
| Did not understand at all | Understood completely | |||
Bookmark Instructions: | 1 | 2 | 3 | 4 | 5 |
5. Please tell us about yourself (optional)
Gender: ____Male ____Female
Age: ____20-29 ____30-39 ____40-49 ____50-59 ____60-69 ____70+
Race/Ethnicity: _______________________
Type of community in which you work:
Rural | Suburban | Urban |
TABLE D-1 Design of the Bookmark Standard Setting with NAAL Data, September 2004a
| Table 1 | Table 2 | Table 3 | Table 4 | Table 5 | Table 6 |
First Literacy Area: | Prose | Prose | Doc. | Doc. | Quant. | Quant. |
Second Literacy Area: | Doc. | Quant. | Quant. | Prose | Prose | Doc. |
aAll panelists used rp 67 instructions. | ||||||
TABLE D-2A Participants’ Bookmark Placements and Associated Cut Scores for Basic, Prose Literacy, September 2004
Response | Round 1 | Round 2 | Round 3 | ||||||
Participanta | Table | Probability | Occasion | BKb | SSc | BK | SS | BK | SS |
1.1 | 1 | 0.67 | 1 | 8 | 206 | 8 | 206 | 8 | 206 |
1.2 | 1 | 0.67 | 1 | 8 | 206 | 8 | 206 | 8 | 206 |
1.3 | 1 | 0.67 | 1 | 15 | 229 | 8 | 206 | 12 | 217 |
1.4 | 1 | 0.67 | 1 | 6 | 199 | 8 | 206 | 8 | 206 |
1.5 | 1 | 0.67 | 1 | 8 | 206 | 8 | 206 | 8 | 206 |
2.1 | 2 | 0.67 | 1 | 11 | 210 | 11 | 210 | 12 | 217 |
2.2 | 2 | 0.67 | 1 | 11 | 210 | 11 | 210 | 11 | 210 |
2.3 | 2 | 0.67 | 1 | 11 | 210 | 11 | 210 | 11 | 210 |
2.4 | 2 | 0.67 | 1 | 12 | 217 | 12 | 217 | 12 | 217 |
2.5 | 2 | 0.67 | 1 | 14 | 225 | 12 | 217 | 8 | 206 |
4.1 | 4 | 0.67 | 2 | 14 | 225 | 13 | 221 | 13 | 221 |
4.2 | 4 | 0.67 | 2 | 15 | 229 | 13 | 221 | 13 | 221 |
4.3 | 4 | 0.67 | 2 | 18 | 233 | 14 | 225 | 15 | 229 |
4.4 | 4 | 0.67 | 2 | 11 | 210 | 13 | 221 | 13 | 221 |
4.5 | 4 | 0.67 | 2 | 14 | 225 | 14 | 225 | 14 | 225 |
5.1 | 5 | 0.67 | 2 | 17 | 232 | 18 | 233 | 18 | 233 |
5.2 | 5 | 0.67 | 2 | 14 | 225 | 18 | 233 | 13 | 221 |
5.3 | 5 | 0.67 | 2 | 18 | 233 | 18 | 233 | 18 | 233 |
5.4 | 5 | 0.67 | 2 | 14 | 225 | 17 | 232 | 18 | 233 |
5.5 | 5 | 0.67 | 2 | 18 | 233 | 18 | 233 | 18 | 233 |
aThe first participant at each table (i.e. 1.1, 2.1, …, 6.1) is the table leader. bDenotes the item number in the ordered item booklet on which the bookmark was placed (see pg. 112 for explanation of bookmark placements). cDenotes the cut score associated with the bookmark placement. It is the RP location for the last item before the bookmark placement, converted to a scale score. | |||||||||
TABLE D-2B Participants’ Bookmark Placements and Associated Cut Scores for Intermediate, Prose Literacy, September 2004
Response | Round 1 | Round 2 | Round 3 | ||||||
Participanta | Table | Probability | Occasion | BKb | SSc | BK | SS | BK | SS |
1.1 | 1 | 0.67 | 1 | 27 | 245 | 31 | 260 | 37 | 270 |
1.2 | 1 | 0.67 | 1 | 31 | 260 | 27 | 245 | 31 | 260 |
1.3 | 1 | 0.67 | 1 | 41 | 287 | 30 | 251 | 37 | 270 |
1.4 | 1 | 0.67 | 1 | 22 | 237 | 31 | 260 | 37 | 270 |
1.5 | 1 | 0.67 | 1 | 15 | 229 | 27 | 245 | 27 | 245 |
2.1 | 2 | 0.67 | 1 | 27 | 245 | 29 | 249 | 29 | 249 |
2.2 | 2 | 0.67 | 1 | 37 | 270 | 37 | 270 | 37 | 270 |
2.3 | 2 | 0.67 | 1 | 32 | 265 | 29 | 249 | 32 | 265 |
2.4 | 2 | 0.67 | 1 | 29 | 249 | 29 | 249 | 29 | 249 |
2.5 | 2 | 0.67 | 1 | 37 | 270 | 37 | 270 | 37 | 270 |
4.1 | 4 | 0.67 | 2 | 42 | 288 | 45 | 293 | 45 | 293 |
4.2 | 4 | 0.67 | 2 | 51 | 314 | 45 | 293 | 45 | 293 |
4.3 | 4 | 0.67 | 2 | 37 | 270 | 45 | 293 | 45 | 293 |
4.4 | 4 | 0.67 | 2 | 45 | 293 | 45 | 293 | 45 | 293 |
4.5 | 4 | 0.67 | 2 | 37 | 270 | 45 | 293 | 45 | 293 |
5.1 | 5 | 0.67 | 2 | 44 | 292 | 44 | 292 | 44 | 292 |
5.2 | 5 | 0.67 | 2 | 31 | 260 | 44 | 292 | 45 | 293 |
5.3 | 5 | 0.67 | 2 | 45 | 293 | 44 | 292 | 44 | 292 |
5.4 | 5 | 0.67 | 2 | 31 | 260 | 45 | 293 | 45 | 293 |
5.5 | 5 | 0.67 | 2 | 32 | 265 | 45 | 293 | 45 | 293 |
aThe first participant at each table (i.e. 1.1, 2.1, …, 6.1) is the table leader. bDenotes the item number in the ordered item booklet on which the bookmark was placed (see pg. 112 for explanation of bookmark placements). cDenotes the cut score associated with the bookmark placement. It is the RP location for the last item before the bookmark placement, converted to a scale score. | |||||||||
TABLE D-2C Participants’ Bookmark Placements and Associated Cut Scores for Advanced, Prose Literacy, September 2004
Response | Round 1 | Round 2 | Round 3 | ||||||
Participanta | Table | Probability | Occasion | BKb | SSc | BK | SS | BK | SS |
1.1 | 1 | 0.67 | 1 | 56 | 345 | 56 | 345 | 56 | 345 |
1.2 | 1 | 0.67 | 1 | 60 | 368 | 60 | 368 | 60 | 368 |
1.3 | 1 | 0.67 | 1 | 45 | 293 | 51 | 314 | 55 | 336 |
1.4 | 1 | 0.67 | 1 | 49 | 310 | 56 | 345 | 56 | 345 |
1.5 | 1 | 0.67 | 1 | 39 | 275 | 60 | 368 | 56 | 345 |
2.1 | 2 | 0.67 | 1 | 53 | 332 | 48 | 307 | 48 | 307 |
2.2 | 2 | 0.67 | 1 | 64 | 405 | 53 | 332 | 56 | 345 |
2.3 | 2 | 0.67 | 1 | 45 | 293 | 48 | 307 | 53 | 332 |
2.4 | 2 | 0.67 | 1 | 48 | 307 | 45 | 293 | 55 | 336 |
2.5 | 2 | 0.67 | 1 | 51 | 314 | 51 | 314 | 60 | 368 |
4.1 | 4 | 0.67 | 2 | 60 | 368 | 48 | 307 | 56 | 345 |
4.2 | 4 | 0.67 | 2 | 64 | 405 | 53 | 332 | 56 | 345 |
4.3 | 4 | 0.67 | 2 | 64 | 405 | 48 | 307 | 56 | 345 |
4.4 | 4 | 0.67 | 2 | 64 | 405 | 45 | 293 | 56 | 345 |
4.5 | 4 | 0.67 | 2 | 53 | 332 | 51 | 314 | 56 | 345 |
5.1 | 5 | 0.67 | 2 | 65 | 420 | 65 | 420 | 65 | 420 |
5.2 | 5 | 0.67 | 2 | 65 | 420 | 65 | 420 | 65 | 420 |
5.3 | 5 | 0.67 | 2 | 65 | 420 | 65 | 420 | 65 | 420 |
5.4 | 5 | 0.67 | 2 | 63 | 405 | 65 | 420 | 65 | 420 |
5.5 | 5 | 0.67 | 2 | 53 | 332 | 65 | 420 | 65 | 420 |
aThe first participant at each table (i.e. 1.1, 2.1, …, 6.1) is the table leader. bDenotes the item number in the ordered item booklet on which the bookmark was placed (see pg. 112 for explanation of bookmark placements). cDenotes the cut score associated with the bookmark placement. It is the RP location for the last item before the bookmark placement, converted to a scale score. | |||||||||
TABLE D-3 Summary Statistics for Round 3 Cut Scores for Prose Literacy Scale, July and September 2004
| July (RP67) | Sept. (RP67) | ||||
Basic | Intermediate | Advanced | Basic | Intermediate | Advanced | |
Median | 211.00 | 270.00 | 336.00 | 219.00 | 281.00 | 345.00 |
Mean | 205.40 | 273.20 | 341.60 | 218.55 | 277.30 | 362.60 |
Std. Dev | 7.23 | 14.51 | 22.69 | 10.13 | 17.42 | 36.10 |
Std. Error | 2.29 | 4.59 | 7.18 | 2.27 | 3.90 | 8.07 |
N | 10 | 10 | 10 | 20 | 20 | 20 |
TABLE D-4A Participants’ Bookmark Placements and Associated Cut Scores for Basic, Document Literacy, September 2004
Response | Round 1 | Round 2 | Round 3 | ||||||
Participanta | Table | Probability | Occasion | BKb | SSc | BK | SS | BK | SS |
1.1 | 1 | 0.67 | 2 | 12 | 194 | 12 | 194 | 12 | 194 |
1.2 | 1 | 0.67 | 2 | 10 | 192 | 13 | 198 | 13 | 198 |
1.3 | 1 | 0.67 | 2 | 23 | 223 | 17 | 204 | 17 | 204 |
1.4 | 1 | 0.67 | 2 | 18 | 210 | 12 | 194 | 18 | 210 |
1.5 | 1 | 0.67 | 2 | 11 | 193 | 18 | 210 | 12 | 194 |
3.1 | 3 | 0.67 | 1 | 20 | 215 | 18 | 210 | 18 | 210 |
3.2 | 3 | 0.67 | 1 | 8 | 182 | 17 | 204 | 18 | 210 |
3.3 | 3 | 0.67 | 1 | 18 | 210 | 18 | 210 | 18 | 210 |
3.4 | 3 | 0.67 | 1 | 15 | 201 | 18 | 210 | 19 | 215 |
3.5 | 3 | 0.67 | 1 | 17 | 204 | 17 | 204 | 18 | 210 |
4.1 | 4 | 0.67 | 1 | 19 | 215 | 19 | 215 | 18 | 210 |
4.2 | 4 | 0.67 | 1 | 19 | 215 | 19 | 215 | 19 | 215 |
4.3 | 4 | 0.67 | 1 | 18 | 210 | 19 | 215 | 18 | 210 |
4.4 | 4 | 0.67 | 1 | 10 | 192 | 10 | 192 | 10 | 192 |
4.5 | 4 | 0.67 | 1 | 19 | 215 | 19 | 215 | 19 | 215 |
6.1 | 6 | 0.67 | 2 | 18 | 210 | 5 | 170 | 5 | 170 |
6.2 | 6 | 0.67 | 2 | 5 | 170 | 5 | 170 | 5 | 170 |
6.3 | 6 | 0.67 | 2 | 19 | 215 | 19 | 215 | 19 | 215 |
6.4 | 6 | 0.67 | 2 | 19 | 215 | 19 | 215 | 19 | 215 |
6.5 | 6 | 0.67 | 2 | 19 | 215 | 19 | 215 | 19 | 215 |
aThe first participant of each table (i.e. 1.1, 2.1, …, 6.1) is the table leader. bDenotes the item number in the ordered item booklet on which the bookmark was placed (see pg. 112 for explanation of bookmarkplacements). cDenotes the cut score associated with the bookmark placement. It is the RP location for the last item before the bookmark placement, converted to a scale score. | |||||||||
TABLE D-4B Participants’ Bookmark Placements and Associated Cut Scores for Intermediate, Document Literacy, September 2004
Response | Round 1 | Round 2 | Round 3 | ||||||
Participanta | Table | Probability | Occasion | BKb | SSc | BK | SS | BK | SS |
1.1 | 1 | 0.67 | 2 | 36 | 243 | 36 | 243 | 36 | 243 |
1.2 | 1 | 0.67 | 2 | 36 | 243 | 36 | 243 | 36 | 243 |
1.3 | 1 | 0.67 | 2 | 50 | 280 | 42 | 266 | 38 | 254 |
1.4 | 1 | 0.67 | 2 | 40 | 256 | 36 | 243 | 40 | 256 |
1.5 | 1 | 0.67 | 2 | 29 | 235 | 36 | 243 | 36 | 243 |
3.1 | 3 | 0.67 | 1 | 31 | 236 | 29 | 235 | 38 | 254 |
3.2 | 3 | 0.67 | 1 | 22 | 216 | 32 | 236 | 38 | 254 |
3.3 | 3 | 0.67 | 1 | 42 | 266 | 29 | 235 | 42 | 266 |
3.4 | 3 | 0.67 | 1 | 25 | 224 | 30 | 235 | 40 | 256 |
3.5 | 3 | 0.67 | 1 | 31 | 236 | 31 | 236 | 36 | 243 |
4.1 | 4 | 0.67 | 1 | 36 | 243 | 41 | 260 | 41 | 260 |
4.2 | 4 | 0.67 | 1 | 48 | 274 | 41 | 260 | 39 | 256 |
4.3 | 4 | 0.67 | 1 | 42 | 266 | 41 | 260 | 41 | 260 |
4.4 | 4 | 0.67 | 1 | 36 | 243 | 41 | 260 | 41 | 260 |
4.5 | 4 | 0.67 | 1 | 36 | 243 | 41 | 260 | 41 | 260 |
6.1 | 6 | 0.67 | 2 | 29 | 235 | 29 | 235 | 29 | 235 |
6.2 | 6 | 0.67 | 2 | 31 | 236 | 32 | 236 | 38 | 254 |
6.3 | 6 | 0.67 | 2 | 40 | 256 | 38 | 254 | 36 | 243 |
6.4 | 6 | 0.67 | 2 | 38 | 254 | 38 | 254 | 38 | 254 |
6.5 | 6 | 0.67 | 2 | 36 | 243 | 38 | 254 | 38 | 254 |
aThe first participant of each table (i.e. 1.1, 2.1, …, 6.1) is the table leader. bDenotes the item number in the ordered item booklet on which the bookmark was placed (see pg. 112 for explanation of bookmark placements). cDenotes the cut score associated with the bookmark placement. It is the RP location for the last item before the bookmark placement, converted to a scale score. | |||||||||
TABLE D-4C Participants’ Bookmark Placements and Associated Cut Scores for Advanced, Document Literacy, September 2004
Response | Round 1 | Round 2 | Round 3 | ||||||
Participanta | Table | Probability | Occasion | BKb | SSc | BK | SS | BK | SS |
1.1 | 1 | 0.67 | 2 | 62 | 371 | 52 | 283 | 57 | 318 |
1.2 | 1 | 0.67 | 2 | 57 | 318 | 57 | 318 | 57 | 318 |
1.3 | 1 | 0.67 | 2 | 57 | 318 | 57 | 318 | 62 | 371 |
1.4 | 1 | 0.67 | 2 | 52 | 283 | 52 | 283 | 52 | 283 |
1.5 | 1 | 0.67 | 2 | 40 | 256 | 57 | 318 | 57 | 318 |
3.1 | 3 | 0.67 | 1 | 55 | 301 | 59 | 332 | 59 | 332 |
3.2 | 3 | 0.67 | 1 | 61 | 358 | 59 | 332 | 61 | 358 |
3.3 | 3 | 0.67 | 1 | 56 | 302 | 56 | 302 | 56 | 302 |
3.4 | 3 | 0.67 | 1 | 42 | 266 | 59 | 332 | 59 | 332 |
3.5 | 3 | 0.67 | 1 | 53 | 285 | 59 | 332 | 59 | 332 |
4.1 | 4 | 0.67 | 1 | 63 | 386 | 62 | 371 | 62 | 371 |
4.2 | 4 | 0.67 | 1 | 63 | 386 | 62 | 371 | 62 | 371 |
4.3 | 4 | 0.67 | 1 | 61 | 358 | 62 | 371 | 62 | 371 |
4.4 | 4 | 0.67 | 1 | 62 | 371 | 62 | 3 71 | 62 | 371 |
4.5 | 4 | 0.67 | 1 | 59 | 332 | 62 | 371 | 62 | 371 |
6.1 | 6 | 0.67 | 2 | 41 | 260 | 41 | 260 | 48 | 274 |
6.2 | 6 | 0.67 | 2 | 62 | 371 | 62 | 371 | 62 | 371 |
6.3 | 6 | 0.67 | 2 | 62 | 371 | 62 | 371 | 62 | 371 |
6.4 | 6 | 0.67 | 2 | 59 | 332 | 59 | 332 | 59 | 332 |
6.5 | 6 | 0.67 | 2 | 59 | 332 | 61 | 358 | 62 | 371 |
aThe first participant of each table (i.e. 1.1, 2.1, …, 6.1) is the table leader. bDenotes the item number in the ordered item booklet on which the bookmark was placed (see pg. 112 for explanation of bookmark placements). cDenotes the cut score associated with the bookmark placement. It is the RP location for the last item before the bookmark placement, converted to a scale score. | |||||||||
TABLE D-5 Summary Statistics for Round 3 Cut Scores for Document Literacy Scale, July and September 2004
| July (RP67) | Sept. (RP67) | ||||
Basic | Intermediate | Advanced | Basic | Intermediate | Advanced | |
Median | 189.00 | 255.00 | 343.50 | 210.00 | 254.00 | 345.00 |
Mean | 192.10 | 257.20 | 345.20 | 204.10 | 252.40 | 341.90 |
Std. Dev | 8.45 | 10.09 | 29.96 | 13.90 | 8.00 | 32.17 |
Std. Error | 2.67 | 3.19 | 9.47 | 3.11 | 1.79 | 7.19 |
N | 10 | 10 | 10 | 20 | 20 | 20 |
TABLE D-6A Participants’ Bookmark Placements and Associated Cut Scores for Basic, Quantitative Literacy, September 2004
Response | Round 1 | Round 2 | Round 3 | ||||||
Participanta | Table | Probability | Occasion | BKb | SSc | BK | SS | BK | SS |
2.1 | 2 | 0.67 | 2 | 6 | 215 | 6 | 215 | 10 | 230 |
2.2 | 2 | 0.67 | 2 | 6 | 215 | 10 | 230 | 16 | 245 |
2.3 | 2 | 0.67 | 2 | 10 | 230 | 10 | 230 | 10 | 230 |
2.4 | 2 | 0.67 | 2 | 17 | 250 | 17 | 250 | 17 | 250 |
2.5 | 2 | 0.67 | 2 | 4 | 203 | 10 | 230 | 16 | 245 |
3.1 | 3 | 0.67 | 2 | 18 | 252 | 16 | 245 | 16 | 245 |
3.2 | 3 | 0.67 | 2 | 16 | 245 | 16 | 245 | 16 | 245 |
3.3 | 3 | 0.67 | 2 | 16 | 245 | 16 | 245 | 16 | 245 |
3.4 | 3 | 0.67 | 2 | 22 | 265 | 16 | 245 | 16 | 245 |
3.5 | 3 | 0.67 | 2 | 22 | 265 | 18 | 252 | 16 | 245 |
5.1 | 5 | 0.67 | 1 | 23 | 266 | 15 | 244 | 15 | 244 |
5.2 | 5 | 0.67 | 1 | 17 | 250 | 23 | 266 | 15 | 244 |
5.3 | 5 | 0.67 | 1 | 15 | 244 | 15 | 244 | 15 | 244 |
5.4 | 5 | 0.67 | 1 | 16 | 245 | 17 | 250 | 15 | 244 |
5.5 | 5 | 0.67 | 1 | 7 | 224 | 23 | 266 | 23 | 266 |
6.1 | 6 | 0.67 | 1 | 5 | 211 | 5 | 211 | 5 | 211 |
6.2 | 6 | 0.67 | 1 | 11 | 233 | 9 | 226 | 4 | 203 |
6.3 | 6 | 0.67 | 1 | 16 | 245 | 15 | 244 | 15 | 244 |
6.4 | 6 | 0.67 | 1 | 12 | 240 | 14 | 242 | 12 | 240 |
6.5 | 6 | 0.67 | 1 | 14 | 242 | 15 | 244 | 14 | 242 |
aThe first participant of each table (i.e., 1.1, 2.1, …, 6.1) is the table leader. bDenotes the item number in the ordered item booklet on which the bookmark was placed (see pg. 112 for explanation of bookmark placements). cDenotes the cut score associated with the bookmark placement. It is the RP location for the last item before the bookmark placement, converted to a scale score. | |||||||||
TABLE D-6B Participants’ Bookmark Placements and Associated Cut Scores for Intermediate, Quantitative Literacy, September 2004
Response | Round 1 | Round 2 | Round 3 | ||||||
Participanta | Table | Probability | Occasion | BKb | SSc | BK | SS | BK | SS |
2.1 | 2 | 0.67 | 2 | 20 | 260 | 29 | 288 | 30 | 289 |
2.2 | 2 | 0.67 | 2 | 17 | 250 | 29 | 288 | 35 | 298 |
2.3 | 2 | 0.67 | 2 | 34 | 298 | 29 | 288 | 29 | 288 |
2.4 | 2 | 0.67 | 2 | 53 | 400 | 35 | 298 | 35 | 298 |
2.5 | 2 | 0.67 | 2 | 29 | 288 | 29 | 288 | 35 | 298 |
3.1 | 3 | 0.67 | 2 | 34 | 298 | 30 | 289 | 29 | 288 |
3.2 | 3 | 0.67 | 2 | 21 | 264 | 38 | 304 | 30 | 289 |
3.3 | 3 | 0.67 | 2 | 38 | 304 | 35 | 298 | 35 | 298 |
3.4 | 3 | 0.67 | 2 | 29 | 288 | 35 | 298 | 29 | 288 |
3.5 | 3 | 0.67 | 2 | 35 | 298 | 35 | 298 | 32 | 295 |
5.1 | 5 | 0.67 | 1 | 43 | 324 | 43 | 324 | 41 | 312 |
5.2 | 5 | 0.67 | 1 | 29 | 288 | 43 | 324 | 41 | 312 |
5.3 | 5 | 0.67 | 1 | 37 | 302 | 41 | 312 | 37 | 302 |
5.4 | 5 | 0.67 | 1 | 34 | 298 | 37 | 302 | 37 | 302 |
5.5 | 5 | 0.67 | 1 | 34 | 298 | 43 | 324 | 43 | 324 |
6.1 | 6 | 0.67 | 1 | 27 | 273 | 24 | 267 | 24 | 267 |
6.2 | 6 | 0.67 | 1 | 21 | 264 | 23 | 266 | 12 | 240 |
6.3 | 6 | 0.67 | 1 | 42 | 319 | 33 | 295 | 32 | 295 |
6.4 | 6 | 0.67 | 1 | 29 | 288 | 31 | 290 | 29 | 288 |
6.5 | 6 | 0.67 | 1 | 35 | 298 | 33 | 295 | 31 | 290 |
aThe first participant of each table (i.e., 1.1, 2.1, …, 6.1) is the table leader. bDenotes the item number in the ordered item booklet on which the bookmark was placed (see pg. 112 for explanation of bookmark placements). cDenotes the cut score associated with the bookmark placement. It is the RP location for the last item before the bookmark placement, converted to a scale score. | |||||||||
TABLE D-6C Participants’ Bookmark Placements and Associated Cut Scores for Advanced, Quantitative Literacy, September 2004
Response | Round 1 | Round 2 | Round 3 | ||||||
Participanta | Table | Probability | Occasion | BKb | SSc | BK | SS | BK | SS |
2.1 | 2 | 0.67 | 2 | 35 | 298 | 35 | 298 | 42 | 319 |
2.2 | 2 | 0.67 | 2 | 35 | 298 | 49 | 356 | 49 | 356 |
2.3 | 2 | 0.67 | 2 | 49 | 356 | 49 | 356 | 49 | 356 |
2.4 | 2 | 0.67 | 2 | 54 | 461 | 49 | 356 | 49 | 356 |
2.5 | 2 | 0.67 | 2 | 54 | 461 | 49 | 356 | 49 | 356 |
3.1 | 3 | 0.67 | 2 | 44 | 327 | 46 | 338 | 46 | 338 |
3.2 | 3 | 0.67 | 2 | 41 | 312 | 47 | 343 | 47 | 343 |
3.3 | 3 | 0.67 | 2 | 49 | 356 | 49 | 356 | 49 | 356 |
3.4 | 3 | 0.67 | 2 | 50 | 369 | 45 | 331 | 45 | 331 |
3.5 | 3 | 0.67 | 2 | 45 | 331 | 46 | 338 | 47 | 343 |
5.1 | 5 | 0.67 | 1 | 49 | 356 | 54 | 461 | 54 | 461 |
5.2 | 5 | 0.67 | 1 | 54 | 461 | 54 | 461 | 54 | 461 |
5.3 | 5 | 0.67 | 1 | 54 | 461 | 54 | 461 | 54 | 461 |
5.4 | 5 | 0.67 | 1 | 54 | 461 | 54 | 461 | 51 | 393 |
5.5 | 5 | 0.67 | 1 | 53 | 400 | 54 | 461 | 53 | 400 |
6.1 | 6 | 0.67 | 1 | 49 | 356 | 49 | 356 | 49 | 356 |
6.2 | 6 | 0.67 | 1 | 51 | 393 | 50 | 369 | 50 | 369 |
6.3 | 6 | 0.67 | 1 | 50 | 369 | 51 | 393 | 49 | 356 |
6.4 | 6 | 0.67 | 1 | 48 | 355 | 51 | 393 | 47 | 343 |
6.5 | 6 | 0.67 | 1 | 51 | 393 | 51 | 393 | 45 | 331 |
aThe first participant of each table (i.e., 1.1, 2.1, …, 6.1) is the table leader. bDenotes the item number in the ordered item booklet on which the bookmark was placed (see pg. 112 for explanation of bookmark placements). cDenotes the cut score associated with the bookmark placement. It is the RP location for the last item before the bookmark placement, converted to a scale score. | |||||||||
TABLE D-7 Summary Statistics for Round 3 Cut Scores for Quantitative Liberacy Scale, July and September 2004
| July (RP67) | Sept. (RP67) | ||||
Basic | Intermediate | Advanced | Basic | Intermediate | Advanced | |
Median | 244.00 | 307.00 | 351.50 | 244.00 | 295.00 | 356.00 |
Mean | 243.20 | 295.20 | 367.30 | 240.35 | 293.05 | 369.25 |
Std. Dev | 29.56 | 17.49 | 39.10 | 13.46 | 17.14 | 43.82 |
Std. Error | 9.85 | 5.83 | 13.03 | 3.01 | 3.83 | 9.80 |
N | 10 | 10 | 10 | 20 | 20 | 20 |
TABLE D-8 Item ID Table for Prose Literacy Bookmark Placements, Round 3, July 2004
Participanta | Table | Response Probability | Occasion |
4.1 | 4 | 0.67 | 1 |
4.2 | 4 | 0.67 | 1 |
4.3 | 4 | 0.67 | 1 |
4.4 | 4 | 0.67 | 1 |
4.5 | 4 | 0.67 | 1 |
5.1 | 5 | 0.67 | 2 |
5.2 | 5 | 0.67 | 2 |
5.3 | 5 | 0.67 | 2 |
5.4 | 5 | 0.67 | 2 |
5.5 | 5 | 0.67 | 2 |
aThe first participant of each table (i.e. 1.1, 2.1, …, 9.1) is the table leader. bDenotes the item number in the ordered item booklet on which the bookmark was placed (see pg. 112 for explanation of bookmark placements). cDenotes the cut score associated with the bookmark placement. It is the RP location for the last item before the bookmark placement, converted to a scale score. | |||
TABLE D-9 Item ID Table for Document Literacy Bookmark Placements, Round 3, July 2004
Participanta | Table | Response Probability | Occasion |
4.1 | 4 | 0.67 | 2 |
4.2 | 4 | 0.67 | 2 |
4.3 | 4 | 0.67 | 2 |
4.4 | 4 | 0.67 | 2 |
4.5 | 4 | 0.67 | 2 |
6.1 | 6 | 0.67 | 1 |
6.2 | 6 | 0.67 | 1 |
6.3 | 6 | 0.67 | 1 |
6.4 | 6 | 0.67 | 1 |
6.5 | 6 | 0.67 | 1 |
aThe first participant of each table (i.e. 1.1, 2.1, …, 9.1) is the table leader. bDenotes the item number in the ordered item booklet on which the bookmark was placed (see pg. 112 for explanation of bookmark placements). cDenotes the cut score associated with the bookmark placement. It is the RP location for the last item before the bookmark placement, converted to a scale score. | |||
Basic | Intermediate | Advanced | ||||||
Item Identification | Round 3 | Item Identification | Round 3 | Item Identification | Round 3 | |||
BKb | SSc | BK | SS | BK | SS | |||
N080101 | 5 | 197 | AB60601 | 20 | 270 | N130301 | 34 | 343 |
N080101 | 5 | 197 | AB40901 | 24 | 300 | N130301 | 34 | 343 |
N100101 | 6 | 211 | AB60601 | 20 | 270 | AB40901 | 24 | 300 |
N080101 | 5 | 197 | AB60601 | 20 | 270 | N120501 | 37 | 391 |
N080101 | 5 | 197 | AB60601 | 20 | 270 | N110601 | 36 | 359 |
N100101 | 6 | 211 | AB60201 | 16 | 263 | N090801 | 33 | 336 |
N100101 | 6 | 211 | AB60201 | 16 | 263 | N090801 | 33 | 336 |
N100101 | 6 | 211 | AB60201 | 16 | 263 | N090801 | 33 | 336 |
N100101 | 6 | 211 | AB60201 | 16 | 263 | N090801 | 33 | 336 |
N100101 | 6 | 211 | AB40901 | 24 | 300 | N090801 | 33 | 336 |
Basic | Intermediate | Advanced | ||||||
Item Identification | Round 3 | Item Identification | Round 3 | Item Identification | Round 3 | |||
BKb | SSc | BK | SS | BK | SS | |||
N120601 | 10 | 185 | AB50901 | 47 | 247 | N010901 | 69 | 324 |
N120601 | 10 | 185 | N090501 | 49 | 253 | N010901 | 69 | 324 |
N120601 | 10 | 185 | AB70701 | 51 | 255 | N010901 | 69 | 324 |
N120601 | 10 | 185 | AB50901 | 47 | 247 | AB60502 | 65 | 296 |
N120601 | 10 | 185 | AB50901 | 47 | 247 | N010901 | 69 | 324 |
AB31301 | 17 | 202 | AB31001 | 56 | 271 | N/Ad |
| 378 |
AB31301 | 17 | 202 | AB31001 | 56 | 271 | N/A |
| 378 |
AB50801 | 15 | 193 | AB70701 | 51 | 255 | N100701 | 72 | 363 |
AB40101 | 19 | 206 | AB31001 | 56 | 271 | N100701 | 72 | 363 |
AB50801 | 15 | 193 | AB70701 | 51 | 255 | N/A |
| 378 |
dSome panelists placed their bookmarks for the advanced level after the final item in the booklet. When this occurred, SS is the scale score associated with the RP location for the final item in the booklet. | ||||||||
TABLE D-10 Item ID Table for Quantitative Literacy Bookmark Placements, Round 3, July 2004
Participanta | Table | Response Probability | Occasion |
5.1 | 5 | 0.67 | 1 |
5.2 | 5 | 0.67 | 1 |
5.3 | 5 | 0.67 | 1 |
5.4 | 5 | 0.67 | 1 |
5.5 | 5 | 0.67 | 1 |
6.1 | 6 | 0.67 | 2 |
6.2 | 6 | 0.67 | 2 |
6.3 | 6 | 0.67 | 2 |
6.4 | 6 | 0.67 | 2 |
6.5 | 6 | 0.67 | 2 |
aThe first participant of each table (i.e. 1.1, 2.1, …, 9.1) is the table leader. bDenotes the item number in the ordered item booklet on which the bookmark was placed (see pg. 112 for explanation of bookmark placements). cDenotes the cut score associated with the bookmark placement. It is the RP location for the last item before the bookmark placement, converted to a scale score. dSome panelists placed their bookmarks for the advanced level after the final item in the booklet. When this occurred, SS is the scale score associated with the RP location for the final item in the booklet. | |||
Basic | Intermediate | Advanced | ||||||
Item Identification | Round 3 | Item Identification | Round 3 | Item Identification | Round 3 | |||
BKb | SSc | BK | SS | BK | SS | |||
N100801 | 5 | 216 | N130601 | 18 | 276 | N080901 | 37 | 347 |
AB50404 | 6 | 217 | N011101 | 25 | 307 | N080901 | 37 | 347 |
N100801 | 5 | 216 | N110801 | 17 | 272 | N011101 | 25 | 307 |
N100801 | 5 | 216 | N130601 | 18 | 276 | N080901 | 37 | 347 |
LC00601 | 4 | 211 | N130601 | 18 | 276 | N010601 | 32 | 329 |
AB40704 | 16 | 272 | N011101 | 25 | 307 | N/Ad |
| 410 |
AB40601 | 15 | 271 | N081001 | 27 | 311 | N/A |
| 410 |
AB40601 | 15 | 271 | N011101 | 25 | 307 | N121101 | 39 | 356 |
AB40601 | 15 | 271 | N081001 | 27 | 311 | N/A |
| 410 |
AB40601 | 15 | 271 | N121001 | 26 | 309 | N/A |
| 410 |
TABLE D-11 Item ID Table for Prose Literacy Bookmark Placements, Round 3, September 2004
Participanta | Table | Response Probability | Occasion |
1.1 | 1 | 0.67 | 1 |
1.2 | 1 | 0.67 | 1 |
1.3 | 1 | 0.67 | 1 |
1.4 | 1 | 0.67 | 1 |
1.5 | 1 | 0.67 | 1 |
2.1 | 2 | 0.67 | 1 |
2.2 | 2 | 0.67 | 1 |
2.3 | 2 | 0.67 | 1 |
2.4 | 2 | 0.67 | 1 |
2.5 | 2 | 0.67 | 1 |
4.1 | 4 | 0.67 | 2 |
4.2 | 4 | 0.67 | 2 |
4.3 | 4 | 0.67 | 2 |
4.4 | 4 | 0.67 | 2 |
4.5 | 4 | 0.67 | 2 |
5.1 | 5 | 0.67 | 2 |
5.2 | 5 | 0.67 | 2 |
5.3 | 5 | 0.67 | 2 |
5.4 | 5 | 0.67 | 2 |
5.5 | 5 | 0.67 | 2 |
aThe first participant of each table (i.e. 1.1, 2.1, …, 9.1) is the table leader. bDenotes the item number in the ordered item booklet on which the bookmark was placed (see pg. 112 for explanation of bookmark placements). cDenotes the cut score associated with the bookmark placement. It is the RP location for the last item before the bookmark placement, converted to a scale score. dSome panelists placed their bookmarks for the advanced level after the final item in the booklet. When this occurred, SS is the scale score associated with the RP location for the final item in the booklet. | |||
Basic | Intermediate | Advanced | ||||||
Item Identification | Round 3 | Item Identification | Round 3 | Item Identification | Round 3 | |||
BKb | SSc | BK | SS | BK | SS | |||
C061001 | 8 | 206 | C080301 | 37 | 270 | N130301 | 56 | 345 |
C061001 | 8 | 206 | C071101 | 31 | 260 | N110601 | 60 | 368 |
N100101 | 12 | 217 | C080301 | 37 | 270 | N090801 | 55 | 336 |
C061001 | 8 | 206 | C080301 | 37 | 270 | N130301 | 56 | 345 |
C061001 | 8 | 206 | C020501 | 27 | 245 | N130301 | 56 | 345 |
N100101 | 12 | 217 | C040301 | 29 | 249 | C080701 | 48 | 307 |
C050801 | 11 | 210 | C080301 | 37 | 270 | N130301 | 56 | 345 |
C050801 | 11 | 210 | N120401 | 32 | 265 | C080701 | 53 | 332 |
N100101 | 12 | 217 | C040301 | 29 | 249 | N090801 | 55 | 336 |
C061001 | 8 | 206 | C080301 | 37 | 270 | N110601 | 60 | 368 |
C020901 | 13 | 221 | N130301 | 45 | 293 | N130301 | 56 | 345 |
C020901 | 13 | 221 | N130301 | 45 | 293 | N130301 | 56 | 345 |
C080401 | 15 | 229 | N130301 | 45 | 293 | N130301 | 56 | 345 |
C020901 | 13 | 221 | N130301 | 45 | 293 | N130301 | 56 | 345 |
C040101 | 14 | 225 | N130301 | 45 | 293 | N130301 | 56 | 345 |
C020401 | 18 | 233 | N120301 | 44 | 292 | N/Ad |
| 420 |
C020901 | 13 | 221 | N130301 | 45 | 293 | N/A |
| 420 |
C020401 | 18 | 233 | N120301 | 44 | 292 | N/A |
| 420 |
C020401 | 18 | 233 | N130301 | 45 | 293 | N/A |
| 420 |
C020401 | 18 | 233 | N130301 | 45 | 293 | N/A |
| 420 |
TABLE D-12 Item ID Table for Document Literacy Bookmark Placements, Round 3, September 2004
Participanta | Table | Response Probability | Occasion |
1.1 | 1 | 0.67 | 2 |
1.2 | 1 | 0.67 | 2 |
1.3 | 1 | 0.67 | 2 |
1.4 | 1 | 0.67 | 2 |
1.5 | 1 | 0.67 | 2 |
3.1 | 3 | 0.67 | 1 |
3.2 | 3 | 0.67 | 1 |
3.3 | 3 | 0.67 | 1 |
3.4 | 3 | 0.67 | 1 |
3.5 | 3 | 0.67 | 1 |
4.1 | 4 | 0.67 | 1 |
4.2 | 4 | 0.67 | 1 |
4.3 | 4 | 0.67 | 1 |
4.4 | 4 | 0.67 | 1 |
4.5 | 4 | 0.67 | 1 |
6.1 | 6 | 0.67 | 2 |
6.2 | 6 | 0.67 | 2 |
6.3 | 6 | 0.67 | 2 |
6.4 | 6 | 0.67 | 2 |
6.5 | 6 | 0.67 | 2 |
aThe first participant of each table (i.e. 1.1, 2.1, …, 9.1) is the table leader. bDenotes the item number in the ordered item booklet on which the bookmark was placed (see pg. 112 for explanation of bookmark placements). cDenotes the cut score associated with the bookmark placement. It is the RP location for the last item before the bookmark placement, converted to a scale score. | |||
Basic | Intermediate | Advanced | ||||||
Item Identification | Round 3 | Item Identification | Round 3 | Item Identification | Round 3 | |||
BKb | SSc | BK | SS | BK | SS | |||
C030701 | 12 | 194 | C030601 | 36 | 243 | C021101 | 57 | 318 |
C030702 | 13 | 198 | C030601 | 36 | 243 | C021101 | 57 | 318 |
C080501 | 17 | 204 | N090501 | 38 | 254 | N100701 | 62 | 371 |
C030708 | 18 | 210 | C080201 | 40 | 256 | C020201 | 52 | 283 |
C030701 | 12 | 194 | C030601 | 36 | 243 | C021101 | 57 | 318 |
C030708 | 18 | 210 | N090501 | 38 | 254 | N010901 | 59 | 332 |
C030708 | 18 | 210 | N090501 | 38 | 254 | N110901 | 61 | 358 |
C030708 | 18 | 210 | C060901 | 42 | 266 | N100601 | 56 | 302 |
C020101 | 19 | 215 | C080201 | 40 | 256 | N010901 | 59 | 332 |
C030708 | 18 | 210 | C030601 | 36 | 243 | N010901 | 59 | 332 |
C030708 | 18 | 210 | C030501 | 41 | 260 | N100701 | 62 | 371 |
C020101 | 19 | 215 | C030708 | 39 | 256 | N100701 | 62 | 371 |
C030708 | 18 | 210 | C030501 | 41 | 260 | N100701 | 62 | 371 |
N090301 | 10 | 192 | C030501 | 41 | 260 | N100701 | 62 | 371 |
C020101 | 19 | 215 | C030501 | 41 | 260 | N100701 | 62 | 371 |
C071001 | 5 | 170 | C021001 | 29 | 235 | N100501 | 48 | 274 |
C071001 | 5 | 170 | N090501 | 38 | 254 | N100701 | 62 | 371 |
C020101 | 19 | 215 | C030601 | 36 | 243 | N100701 | 62 | 371 |
C020101 | 19 | 215 | N090501 | 38 | 254 | N010901 | 59 | 332 |
C020101 | 19 | 215 | N090501 | 38 | 254 | N100701 | 62 | 371 |
TABLE D-13 Item ID Table for Quantitative Literacy Bookmark Placements, Round 3, September 2004
Participanta | Table | Response Probability | Occasion |
2.1 | 2 | 0.67 | 2 |
2.2 | 2 | 0.67 | 2 |
2.3 | 2 | 0.67 | 2 |
2.4 | 2 | 0.67 | 2 |
2.5 | 2 | 0.67 | 2 |
3.1 | 3 | 0.67 | 2 |
3.2 | 3 | 0.67 | 2 |
3.3 | 3 | 0.67 | 2 |
3.4 | 3 | 0.67 | 2 |
3.5 | 3 | 0.67 | 2 |
5.1 | 5 | 0.67 | 1 |
5.2 | 5 | 0.67 | 1 |
5.3 | 5 | 0.67 | 1 |
5.4 | 5 | 0.67 | 1 |
5.5 | 5 | 0.67 | 1 |
6.1 | 6 | 0.67 | 1 |
6.2 | 6 | 0.67 | 1 |
6.3 | 6 | 0.67 | 1 |
6.4 | 6 | 0.67 | 1 |
6.5 | 6 | 0.67 | 1 |
aThe first participant of each table (i.e. 1.1, 2.1, …, 9.1) is the table leader. bDenotes the item number in the ordered item booklet on which the bookmark was placed (see pg. 112 for explanation of bookmark placements). cDenotes the cut score associated with the bookmark placement. It is the RP location for the last item before the bookmark placement, converted to a scale score. dSome panelists placed their bookmarks for the advanced level after the final item in the booklet. When this occurred, SS is the scale score associated with the RP location for the final item in the booklet. | |||
Basic | Intermediate | Advanced | ||||||
Item Identification | Round 3 | Item Identification | Round 3 | Item Identification | Round 3 | |||
BKb | SSc | BK | SS | BK | SS | |||
C070301 | 10 | 230 | N090101 | 30 | 289 | N010701 | 42 | 319 |
C020301 | 16 | 245 | C080801 | 35 | 298 | C050701 | 49 | 356 |
C070301 | 10 | 230 | N130601 | 29 | 288 | C050701 | 49 | 356 |
N120701 | 17 | 250 | C080801 | 35 | 298 | C050701 | 49 | 356 |
C020301 | 16 | 245 | C080801 | 35 | 298 | C050701 | 49 | 356 |
C020301 | 16 | 245 | N130601 | 29 | 288 | N010601 | 46 | 338 |
C020301 | 16 | 245 | N090101 | 30 | 289 | C020801 | 47 | 343 |
C020301 | 16 | 245 | C080801 | 35 | 298 | C050701 | 49 | 356 |
C020301 | 16 | 245 | N130601 | 29 | 288 | N120801 | 45 | 331 |
C020301 | 16 | 245 | C070301 | 32 | 295 | C020801 | 47 | 343 |
C020601 | 15 | 244 | C020801 | 41 | 312 | N/Ad |
| 461 |
C020601 | 15 | 244 | C020801 | 41 | 312 | N/A |
| 461 |
C020601 | 15 | 244 | C030709 | 37 | 302 | N/A |
| 461 |
C020601 | 15 | 244 | C030709 | 37 | 302 | N130701 | 51 | 393 |
N110801 | 23 | 266 | C040601 | 43 | 324 | C040801 | 53 | 400 |
C050301 | 5 | 211 | C060701 | 24 | 267 | C050701 | 49 | 356 |
C030706 | 4 | 203 | C030704 | 12 | 240 | N121101 | 50 | 369 |
C020601 | 15 | 244 | C070301 | 32 | 295 | C050701 | 49 | 356 |
C030704 | 12 | 240 | N130601 | 29 | 288 | C020801 | 47 | 343 |
N090901 | 14 | 242 | C080101 | 31 | 290 | N120801 | 45 | 331 |