Dietary Reference Intakes Research Synthesis: Workshop Summary (2007)
Chapter: 10 Tolerable Upper Intake Levels
10
Tolerable Upper Intake Levels1
This session presented perspectives on Tolerable Upper Intake Levels (ULs). Sanford A. Miller of the University of Maryland2 provided the perspective of an individual who has observed the development of the Dietary Reference Intakes (DRI) program from its inception. He served as a member of the Upper Reference Levels Subcommittee, the Standing Committee on the Scientific Evaluation of Dietary Reference Intakes, and the Food and Nutrition Board. Christine Taylor of the Food and Drug Administration (FDA) recently completed a 2-year assignment to the World Health Organization (WHO); she provided perspectives based on a joint effort between the Food and Agricultural Organization (FAO) and WHO to describe a model for nutrient risk assessment.
TOLERABLE UPPER INTAKE LEVELS
Sanford A. Miller
This workshop reflects a concept underlying the development of the then new DRIs—that they would be in constant flux. Although some progress has been made over the last 10 years, an enormous amount remains to be done, especially with regard to providing the data needed to set the ULs. A search of the literature published over the last 6 years
identified only about 30 papers that, even by a stretch of the imagination, could be used in revising or adding to the ULs. This presentation covers distinctions between risk and safety, several considerations for establishing ULs, data needs, and research needs.
Distinguishing Between Risk and Safety
To improve the process for setting ULs, it would be helpful to distinguish between risk and safety. Risk is an inherent property of a material. It depends upon exposure and a variety of factors, but it can be determined using scientific methods.
Safety, on the other hand, might be called a second order derivative of risk. Cultural, social, and other health reasons are used to decide what constitutes a safe dose. Safety must be defined, but it can be based on many factors other than scientifically based ones. Figure 10-1 illustrates this point.
In the DRI reports, the definition for UL is, “the highest level of daily nutrient intake that is likely to pose no risk of adverse health effects for almost all individuals in the general population.” Dr. Miller asserted that for some nutrients this is a virtual impossibility. To eliminate the risk, one must set a very, very low value for the UL. In fact, one needs to set the UL so low that the intake would not provide the positive nutritional benefits of the nutrient. The UL for vitamin D provides an example of this. Thus, Dr. Miller’s position is that the focus should be on acceptable risk, not no risk. Notably, ULs restrict dietary recommendations and regulatory policy options.
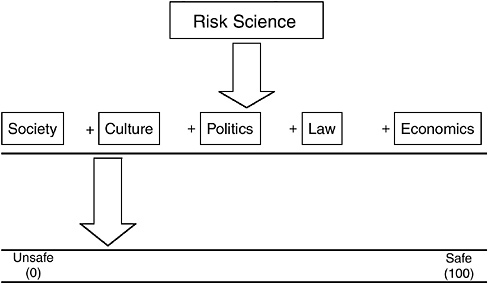
FIGURE 10-1 Safety: A point on a continuum.
Considerations in Establishing TolerableUpper Intake Levels
Requirements to establish ULs include clear objectives, good models, and sufficient data. A clear objective would identify exactly what it is that is being protected against. Good models are needed to determine that protection is needed against a specified end point. Such models need to make it possible to calculate what exposures are going to be safe or not. However, the greatest need is for data.
Risk/Risk Model
To a large extent, the model that might be most useful is a risk/risk model. That is, what is the risk of having a very low UL versus a high UL? How does that interfere with other aspects of health? Instead, the DRI process has used the safe level model, while calling it a risk assessment model. Dr. Miller believes that the most useful approach will be some combination of risk/risk with a better understanding of biological mechanisms for the end points of concern.
Addressing Multiple End Points
An interesting aspect of nutrients is that multiple end points can be considered in a risk assessment—for example, end points concerned with a deficiency or the essentiality of the nutrient or other beneficial or adverse effects on health. Many nutrients are associated with several risk curves that show different risks with different intakes. Figure 10-2, developed with Dr. Richard Forshee for a hypothetical nutrient, depicts this situation. A reasonable public health goal is to recommend the consumption of the nutrient at a level that minimizes the total expected loss of health—the dotted line in Figure 10-2. Recommending a “safe level” (defined here as 0 expected loss of health) for either Risk 1 or Risk 2 would result in higher total expected loss of health than could be achieved by tolerating some risk from both Risk 1 and Risk 2. Modeling data in this way could help identify the intake at which the risks are minimized with regard to all aspects of the nutrient, and it may be the easiest way to minimize risk.
Data Needs
Data needs related to ULs are the same as they were 10 years ago:
Dose–response information
The ability to draw curves to determine the fundamental association between the substance and the outcome
The potential toxicity or adverse effects of high intakes of nutrients on children
Better measures of exposure
The extent of the exposure in subpopulations
The upper percentiles of consumption
Long-term exposure data
Despite the many years that nutrition research has been conducted in animals and humans, there is virtually no information on what happens when humans exceed the requirement by 100-fold or 10-fold in order to prevent deficiency for a lifetime. The gold standard needs to be human exposure. Biomarkers are greatly needed to make it possible to conduct the kinds of human experiments that could provide better data for setting ULs.
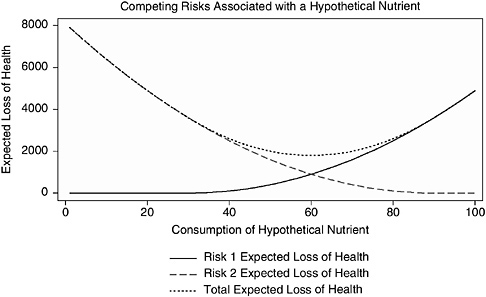
FIGURE 10-2 Two hypothetical risks and the total risk associated with consumption of a nutrient.
NOTE: This figure illustrates a hypothetical relationship in which consumption of a certain nutrient is associated with two risks that move in opposite directions as consumption of the nutrient increases. The vertical axis of this figure represents the expected loss of health in some standard unit, such as lives or quality-adjusted life years. The scale of the vertical axis is arbitrary and is intended for illustrative purposes only. The goal is to minimize the expected loss of health, that is to be as close to zero (0) on the vertical axis as possible. The horizontal axis represents the relative consumption of the nutrient from none (0) to the maximum observed consumption (100). The solid line represents expected loss of health from Risk 1. The expected loss of health from Risk 1 increases as consumption of the nutrient increases. The classic example of such a risk is toxicity at high levels of exposure, such as renal disease and vitamin D. The dashed line represents the expected loss of health from Risk 2. The expected loss of health from Risk 2 decreases as consumption of the nutrient increases. The classic example of this type of risk is a deficiency disease related to a nutrient, such as osteoporosis and vitamin D. The dotted line represents the total expected loss of health (sum of the expected losses from Risk 1 and Risk 2).
Research Needs
Among the many research needs identified by Dr. Miller are the following:
Translation of animal data to human health outcomes. This requires knowledge of the mechanisms.
Chronic studies. Although it is difficult to study chronic disease outcomes, more studies on such outcomes are needed to reduce important knowledge gaps.
Prioritization and communication of the research needs.
Understanding of the interactions of multiple nutrients andhealth end points. In terms of toxicity or adverse effect, examination of the interactions among various nutrients is an important part of the process of trying to determine safety.
Improved risk/risk models. Data are needed on the risks of two different materials in a single food and differences in the risks of a single nutrient under various circumstances.
UPPER LEVEL RESEARCH RECOMMENDATIONS WITHINTHE CONTEXT OF AN INTERNATIONAL MODEL FORNUTRIENT RISK ASSESSMENT
Presenter: Christine Taylor
This presentation addressed UL research recommendations from the perspective of work conducted recently by the WHO in cooperation with the FAO. The work resulted in the release of report of a Joint FAO/WHO Scientific Workshop on Nutrient Risk Assessment (FAO/WHO, 2005), which is available online at http://www.who.int/ipcs/methods/nra/en/index.html. The report fulfills a WHO and FAO role in providing scientific advice and is consistent with the WHO efforts to harmonize risk assessment methodologies. Five member states funded the workshop, which included 18 participants from 14 countries. The focus was on risk from excessive intake of nutrient substances; risk from deficiency was outside the scope of the workshop.
The workshop participants initially considered two types of information: (1) existing principles for risk assessment of nonnutrients and (2)
the major published comprehensive quantitative nutrient risk assessment documents—mainly reports issued by three authoritative bodies from the European Union, the United Kingdom, and the United States and Canada (i.e., the Institute of Medicine [IOM]). The workshop participants then worked to develop a model for nutrient risk assessment, keeping in mind the distinction between nutrient risk assessment and nutrient risk management. Participants were not asked to develop specific upper levels3 of intake for nutrient substances.
Considerations for a Model for Upper Levels
Principles that have evolved for conducting nonnutrient risk assessment offer the foundation for the model that appears in the WHO report. Those principles are modified, however, for special considerations related to nutrient substances, such as the following:
One-of-a-kind homeostatic mechanisms
Metabolic differences for age, sex, and life stage
Dual risk curves—deficiency and excess
Need to deal with inadequate data sets
The nutrient risk assessment model has at least three underlying themes:
Outcomes are based on available evidence, even if it is limited, not on “developed data sets.”
The current practice of evidence-based systematic review needs to be adapted for relevance to nutrient risk assessment.
Public health protection decisions drive the process; choices are not necessarily based solely on considerations of the weight of the evidence.
Two general research messages evolved: (1) the need for research to improve the ability of risk assessors to deal with currently limited data sets, and (2) the need for research targeted very specifically to safety.
Moreover, the workshop participants identified the need to develop ways to stimulate, organize, focus, and promote research agendas in this area.
Research Recommendations
The FAO/WHO report contains many research recommendations. Dr. Taylor organized these recommendations into seven themes for the purpose of this presentation:
Existing data sets
The need for human intervention data
Relevant measurable end points
Improving basic understanding
Improving and harmonizing dietary intake assessments
Adapting the model to a range of nutrient substances
Understanding uses of upper levels and of risk characterization
Overall, the research recommendations underscore comments made earlier in this DRI workshop that there is a need to consider the process for establishing upper levels of intake—not just for more data. Research messages organized under the seven themes follow, and, where applicable, their correspondence with recommendations from DRI reports is noted.
Dealing with Existing Data Sets
The workshop participants found the existing reports on nutrient risk assessment lacking in transparency regarding the scientific judgments made and reasons for the decisions made. The participants regarded the practice of scientific judgments to be a researchable area and thus the report calls for guidelines for approaches to scientific judgment (establishing upper levels is a researchable issue), and for specific efforts as part of nutrient risk assessment to incorporate accountability, documentation, and transparency.
Examples of improved methods for dealing with existing data sets include (1) defined approaches to combining data to establish links to adverse health effects, (2) inclusion/exclusion criteria for and weighting
of studies (most of which are observational), and (3) enhanced principles for meta-analysis.
Dealing with the Need for Human Intervention Data
Although it was emphasized that limited human data sets should not remain the norm, the ability to fulfill research needs faces certain ethical issues as well as the costs and difficulties associated with human trials and intervention studies. Because of these challenges, there is a need to do the following:
Develop innovative methodologies including animal models, in-vitro techniques, and computer simulations
Explore more fully at least three areas:
Approaches for comparing sensitivity between animals and humans
Extrapolation of data from adults to children using approaches that are more physiological and less the default
Relevance of changes in easily measured homeostatic mechanisms
DRI research recommendations related to this theme focused on adjustment factors for body size, physical activity, intakes of energy, and so on (433-G).4
Identifying Relevant Measurable End Points
Under this theme, emphasis was placed on causally related biomarkers:
Identify, elucidate, and validate the biomarkers.
Specify sensitivity.
Clarify homeostatic range.
Clarify time course.
4 | See Appendix C for the wording of the recommendations that correspond to the identification numbers given, and see Appendix D for the name of the report that corresponds to each letter. |
One relevant DRI research recommendation was related to biomarkers (124-C).
Improving Basic Understanding
This is a very critical topic but challengingly broad. Work is needed to do the following:
Elucidate the nature of metabolism, especially at high levels of intake.
Target research to elucidate adverse health effects.
Ensure the inclusion of dose–range studies and conduct more of them.
Specify interactions.
Establish bioavailability.
The topics above are similar to some of the research recommendations from the DRI reports, specifically:
General research (420-G)
Specific nutrients, including:
B vitamins, folate, pantothenic acid, and choline
Vitamin C, vitamin E, and carotenoids
Vitamin K, arsenic, boron, copper, molybdenum, silicon, and vanadium (supplements)
Amino acids and protein
Dose–response data (421-G)
Factors affecting uptake and absorption (456-H)
Improving and Harmonizing Dietary Intake Assessments
In the comparison of the three major risk assessments, a major source of inconsistencies was in the approach to dietary intake assessment. Thus, the FAO/WHO Working Group considered ways in which dietary intake assessment methods could be harmonized. Research needs include:
Strategies for combining data to estimate intake from all sources
Strategies for estimating intake from aggregated data—essential in many parts of the world that lack intake data on individuals
Development of markers of exposure
DRI research recommendations related to this theme include quantification of the intake of dietary supplements (426-G), enhancement of food composition databases (435-G), and statistical adjustments (438-G).
Adapting the Model to a Range of Nutrient Substances
The substances that are to be included under the term nutrients and related substances were not specifically defined during the FAO/WHO workshop, but the term was intended to include a wide range of nondrug substances. This poses some difficulties in working with a risk assessment model. For example:
Some nutrient substances are nonessential or nonbeneficial, but they are constituents of the food supply. Is the risk assessment model equally applicable to essential and nonessential nutrient substances?
Some nutrient substances have no threshold response. These include trans fat and saturated fat. How does the model need to be adapted or modified for such nutrient substances?
Is the model applicable to macronutrients and micronutrients?
How can the model address interactions?
How does one handle any apparent overlap that may be observed regarding “beneficial” intake and risk?
DRI research recommendations related to this theme covered the optimal range for macronutrient intake (255-E), nature of their adverse effects (261-E), and fats (343-E).
Understanding the Use and Application of the Upper Level and of RiskCharacterization
This theme is on the border between risk assessment and risk management. The nature of the dialogue between risk assessors and risk managers is very important internationally. It may include iterative discussions because the risk assessor’s actions must be very germane to the needs of the risk manager, but the risk assessor should avoid going beyond assessment into management decisions. The FAO/WHO Working Group called for studies of risk characterization outcomes to identify the following:
What information was used and how? How could the information be improved?
What aspects of characterization were not useful?
What aspects led to secondary risk assessment requests?
The report also called for guidelines for problem formulation.
Concluding Points
With regard to public health protection, stakeholders provided comments emphasizing the importance of defining what is adverse. Clear terminology is of special importance when nutritionists and toxicologists are collaborating.
The process of selecting the critical adverse health effect for setting the upper level differed among the three authoritative bodies. The selection of a different critical adverse effect often produced different results in the setting of upper levels. According to the FAO/WHO nutrient risk assessment report, when there is an array of truly adverse health effects, one examines the end points from a public health protection filter and selects the effect seen at the lowest level of intake. The focus is not necessarily on the effect that is most severe or even the effect for which the weight of the evidence is strongest. This approach may lead to “conceptually messy” outcomes. Thus, much work needs to be done related to the selection of the critical adverse health effect and what it means in terms of coming up with appropriate and responsive upper levels.
Looking to the future, it may be advisable for the IOM to consider its role in international harmonization. One of the recommendations in the
FAO/WHO report is to create, expand, and/or combine databases to catalog and collate information.
DISCUSSION
In response to a query from Dr. Hathcock, Dr. Taylor clarified that the Highest Observed Intake Level was identified in the report as a way of assisting risk managers. The FAO/WHO Working Group was aware of the need to ensure that risk assessment outcomes were usable by risk managers. Participants recognized that failing to set an upper level in the face of insufficient data was problematic because risk managers often must make regulatory decisions that provide some measure of safety. Thus, the Highest Observed Intake Level was suggested as a way of providing some scientific context for such decisions.
Dr. Hathcock reiterated his previous concern that anomalous regulatory policies sometimes develop if an upper limit is not set. He hopes to help prevent illogical and inconsistent risk management decision making.
Dr. Miller commented that this is an important communications issue. People who are not particularly sophisticated or trained in risk assessment need to translate the assessment into policies or actions. Without an understanding of the differences, the lack or presence of a numerical value for the upper level can make the difference in the credibility of the particular policy or action. So this suggestion by the FAO/WHO Working Group to set a Highest Observed Intake Level is an important recognition of a communication problem.
In response to a question by Dr. Murphy regarding whether the high preformed vitamin A intake by infants is a problem, Dr. Krebs commented on the ULs for vitamin A and for zinc. In particular, Dr. Krebs indicated that she has no perception that the infants and children with the high reported intakes are experiencing any toxicity from those intakes, but that this question has not really been examined closely for either vitamin A or zinc. Dr. Krebs stated that she has no real basis for knowing. The saturation–response curves for zinc suggest that there is much more zinc in formula than is necessary, and the same may be true for iron.
In the final comment, Dr. Allen encouraged the use of metabolomics as a promising method to look at effects of toxic substances and of nutrition interventions. One can easily see large changes and a very large number of biomarkers upon changing the intake of a single nutrient.


