Strengthening Post-Hurricane Supply Chain Resilience: Observations from Hurricanes Harvey, Irma, and Maria (2020)
Chapter: 2 Critical Concepts of Supply Chain Flow and Resilience
2
Critical Concepts of Supply Chain Flow and Resilience
2.1 MATCHING SUPPLY WITH DEMAND
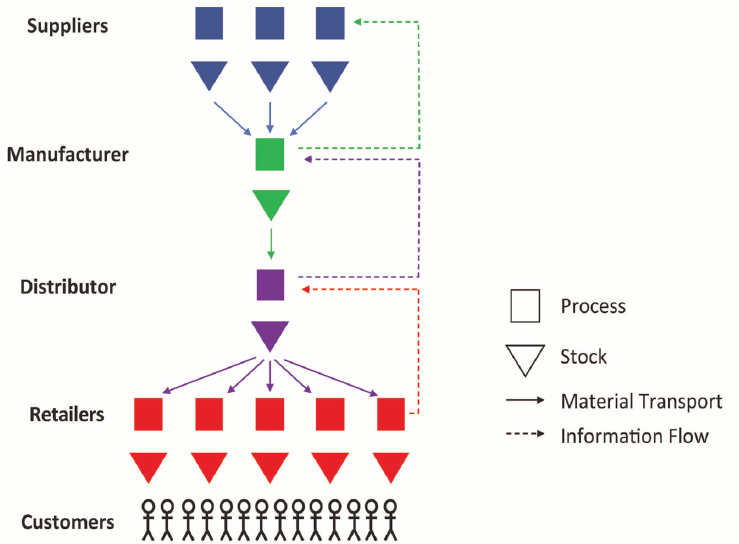
A supply chain facilitates the timely flow of materials and products from suppliers to manufacturers to distributors (wholesalers) to distribution channels (e.g., retailers, clinics/hospitals, nongovernmental organizations), and finally to end users. It does this by transmitting demand information upstream (and other related information downstream) to guide production, transportation, and distribution decisions. Figure 2.1 illustrates the material and information flows in a typical supply chain under normal conditions.
The fundamental challenge of supply chain management is to match supply with demand in a responsive, accurate, and cost-efficient manner. Two features of supply chains complicate this fundamental challenge, both under normal conditions and, especially, under emergency conditions like those posed by a hurricane. These include demand variability and cycle time.
- Variability refers to fluctuations in both demand and supply over time. Some sources of variability are predictable (e.g., seasonal demand shifts or scheduled downtime for equipment maintenance), while others are unpredictable (e.g., individual customer demand decisions or sudden equipment failures). Variability occurs in the transportation phase as well as production processes of a supply chain.
- Cycle time is the total time from start to finish of a process.1 For example, the manufacturing cycle time for a component is the time from when an item is ordered to when it is shipped, which includes both queue times while the item is waiting
___________________
1 Flow time, manufacturing lead time, and production lead time are often used synonymously with cycle time. Regardless of the nomenclature, cycle time can refer to the start-to-finish time of any well-defined process, including a single production step (e.g., machining station), a full production line, or an entire supply chain.
- for manufacturing processes to become available and manufacturing times when the item is actually being worked on. Because cycle times for production, transportation, and distribution processes in a supply chain are non-zero, decisions about what to make, ship, and sell must be made before customer demands occur.
If demand variability were entirely predictable, with no deviation between planned and actual production, it would be possible to make supply chain decisions that precisely adjust supply to meet demand. However, because all supply chains involve at least some unpredictable variability in demand, many supply chain decisions must be made on the basis of demand forecasts. And because forecasts are never perfect, it is impossible to precisely match supply with demand, even under the best of conditions. In complex systems that span multiple geographical locations and have different firms involved in the decisions (e.g., raw material producers, component manufacturers, transporters), demand variability is more unpredictable and lead times are longer, causing the fundamental challenge of supply chain management to become even more difficult.
In response to these challenges, modern supply chains are making increasing use of large-scale integrated information systems, responsive production and transportation systems, and sophisticated inventory control systems to guide design and control decisions. However, these advanced information and logistics systems alone are not sufficient to manage a
supply chain. To focus these tools on the most critical elements of the supply chain, and to understand the potential impacts of a disruptive event, supply chain managers also need to understand some basic concepts about flows.
Bottlenecks
One of the most important of these concepts is that of a bottleneck. Intuitively, the bottleneck can be understood as the point in a supply chain that limits its flow. This bottleneck could be the production process for a raw material, component, or finished product, or the transportation process between any of the stages in the supply chain, or even the distribution process (e.g., retail outlets). Because bottlenecks have so much influence on the behavior of supply chains, under both normal and disrupted conditions, it is helpful to define them more precisely. To do this, we introduce the concepts of processes, capacity, and utilization:
- A process in a supply chain refers to a production, transportation, or distribution system that makes, moves, or delivers goods and services. Process stages can be parallel (e.g., multiple manufacturers and retailers) or serial (e.g., machines within a factory or legs in a transportation route). Figure 2.1 provides a schematic of a supply chain where the boxes represent the main stages in the process, solid arrows represent material flows, and dotted arrows represent information flows.
- The capacity of a process stage is the maximum rate at which it can produce/move product. This can be measured in widgets per week or any number of other metrics that represent flow per unit time.
- The utilization of a process stage is given by the ratio of demand rate to capacity. When this ratio is less than or equal to 100 percent, it represents actual utilization—the fraction of time the resource is busy over time. Since actual utilization cannot exceed 100 percent, when the ratio is above 100 percent, this indicates the extent to which the resource is overloaded.
The bottleneck of a supply chain is defined as the process stage with the highest utilization. Because it is the busiest stage, the bottleneck is the part of the supply chain most vulnerable to becoming overloaded as the result of a spike in demand or a loss of capacity. However, a process stage need not be overloaded all of the time to be a bottleneck. Under normal conditions, the most heavily utilized process stage (the bottleneck) will always have average capacity larger than average demand (will always have utilization of less than 100 percent), otherwise an ever-increasing backlog of demand would build up, which is obviously unsustainable. Nevertheless, even when the bottleneck has enough capacity to keep up with demand on average, the closer its utilization is to 100 percent, the more frequently the system will experience intervals over which demand exceeds capacity, leading to backups and delays that inflate the cycle time.
Another characteristic of bottlenecks is that they are dynamic. As system parameters change over time, such as staffing levels, consumer demand, the mix of products in the supply chain, and other parameters, utilizations of the various process stages within the supply chain will naturally fluctuate. This can cause the bottleneck to shift from one stage to another; it is common for disruptions such as those caused by hurricanes to shift the bottleneck. For this reason, supply chain managers need to be aware of “near bottlenecks” (process stages whose utilization is almost as high as that of the bottleneck), because these can easily become rate-limiting stages in the supply chain.2
By identifying the process stages of critical supply chains that are at risk of becoming bottlenecks, one can better pinpoint and prioritize actions to harden supply chains against disruption; and by identifying bottlenecks that arise after a disruptive event, one can focus on strategic efforts to return the supply chain to normal operations.
Inventory and Lead Time
Another factor that is key to understanding normal and emergency behavior of supply chains is inventory, the quantity of material (raw materials, components, or finished goods) stored at any point in the supply chain.3 Some inventory in a supply chain is the result of variability in the demand and production processes. Whenever production outpaces demand, inventory builds up. When demand outpaces production, the inventory buildup is drawn down. All supply chains contain such inventory, which supply chain managers seek to keep low in the interest of cost efficiency. But inventory is also held deliberately in supply chains to improve responsiveness to end users. While responsiveness from a production perspective is measured by cycle time, responsiveness from an end user standpoint is measured by lead time, which is the duration of time from the end user’s request for a service or product to its delivery.
When inventory is present in a supply chain, lead time can be shorter than the corresponding cycle time. For example, the lead time seen by a customer who orders an assemble-to-order laptop computer might be one week. If the customer bought the same computer from a retail store that had it in stock, the lead time would be zero. However, the cycle time to produce the computer, all the way from sand to silicon to semiconductors to circuit boards to laptop could take one year or more. Inventories of raw materials, components, in-process products, or finished goods can dramatically shorten, or even eliminate, customer lead time to receive a product.
___________________
2 Another reason to be aware of near bottlenecks is that, in practice, our understanding of capacity and utilization is only an estimate; hence, a stage that may seem to have lower utilization than the estimated bottleneck may, in some cases, actually be the bottleneck.
3 Inventory, also commonly called “stock,” is often measured in units of time rather than quantity. For example, a tank that contains 30,000 gallons of fuel in a system that uses an average of 5,000 gallons per day is said to have six days of inventory.
What does this mean for emergency response? Under normal conditions, the capacity of a supply chain is determined by its bottlenecks, while the responsiveness of a supply chain is determined by its lead times. How resilient the supply chain is to disruptions, such as hurricanes, depends on how these bottlenecks and lead times are affected by the disruption and what capabilities exist to restore them after the disruption.
2.2 TYPES OF SUPPLY CHAIN DISRUPTIONS
An extreme event such as a hurricane can disrupt a supply chain in three primary ways.
- Demand shift: A hurricane can distort demand patterns before and after the storm. Demand for gasoline, generators, batteries, and food items often spikes before a hurricane, while demand for bottled water, chainsaws, garbage cans, tarps, and other recovery supplies are usually elevated afterwards. Such demand spikes can push utilization of bottlenecks above 100 percent, even if only some parts of the supply chain are disrupted by the storm.
- Capacity reduction: Examples of capacity reductions that occur in the wake of a hurricane include a production or transportation process that is limited by lack of plant, power, or people: a factory (plant) unable to produce due to physical damage, a retail outlet unable to store perishable products due to lack of electricity (power), trucks unable to deliver goods for lack of drivers (people). Each of these instances was a factor following Hurricane Maria in Puerto Rico.
- Communication disruption: A hurricane can interrupt the normal channels by which information is communicated up the supply chain. For example, normal operations of a supply chain can be impeded by power or cell phone outages, broadband interruptions, point-of-sale system failures, and absence of key individuals. Furthermore, the exceptional relief supply chains established to deliver essential products in the wake of a hurricane lack the sophisticated communication systems utilized in many commercial supply chains,4 and therefore struggle to match supplies with demand.
Each of these supply chain disruptions can reduce capacity and lengthen lead time. Shifts that elevate demand for some products, and disruptions that reduce capacity of some processes, will increase utilization at one or more stages of the supply chain, possibly creating new and more severe bottlenecks. Higher utilization will inflate cycle time and, depending on inventory levels, may also increase lead time and result in delays in getting products to people. If the
___________________
4 These include, for instance, advanced planning and scheduling systems that help supply chain managers ensure that raw materials and production capacity are optimally allocated to meet demand.
bottleneck utilization exceeds 100 percent, then the supply chain will be unable to keep up with demand, leading to shortages that will not be filled until after capacity is restored. Disruption of communications can further exacerbate the problem by obscuring information about demand and stock levels, making it impossible to direct the available supplies to the users that need them most.
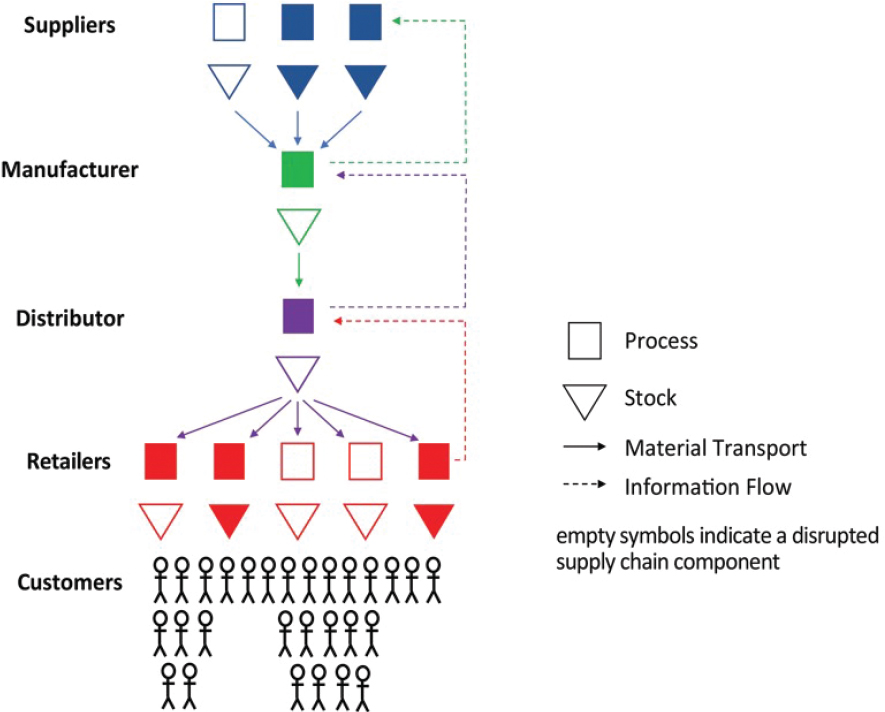
Figure 2.2 schematically describes a scenario in which a disaster-related supplier outage, possibly exacerbated by amplified demand, has resulted in a severe bottleneck at a single supplier, which has led to lack of product availability at the retail level. This is a simplified representation of reality, however, in that processes are represented as simply on/off, which neglects the possibility that a disruption could reduce the capacity of a process rather than eliminate it.
Figure 2.3 illustrates the path by which the supply chain in Figure 2.1 could be transformed into the supply chain in Figure 2.2 as stocks in the system depleted in cascading fashion over time. Restoration of the supply chain to its original operation in Figure 2.1 would involve similar time lags in reverse. This cascading phenomenon can play an important role in determining the
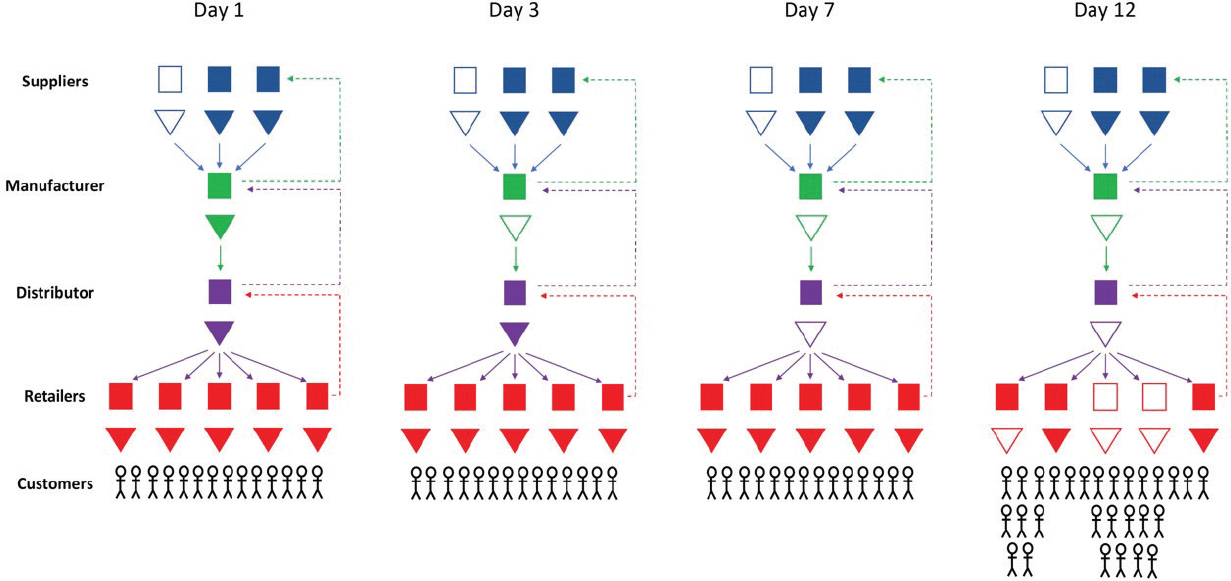
severity of supply shortages after a hurricane. For example, if fuel inventories are high at intermediate depots at the time of a hurricane, an affected region may not feel the effects of a limited pipeline outage, because the time for the outage to cascade to the end user is longer than the time to bring the pipeline back online.
Figures 2.2 and 2.3 illustrate a simple scenario in which a single supply node has been disrupted and the effect has cascaded through the supply chain. It is representative of the impact of a hurricane on users outside the affected region.5 In reality, hurricanes often disrupt many nodes and links at once. In particular, damage to critical infrastructure (e.g., the electrical grid, fuel supply network, water delivery system, communication networks, and transportation systems) can bring down a wide swath of production and transportation processes. For example, a power outage could disrupt some manufacturing facilities directly and disrupt others indirectly, by disrupting gas stations and making it impossible for workers to get to their jobs. When such correlated disruptions occur, hundreds or thousands of bottlenecks can appear, leading to the interruption of a wide range of supply chains. It is particularly important to direct resilience efforts at these critical systems on which all other supply chains rely.
The objective of supply chain resilience initiatives is to minimize the impact of a disruptive event (e.g., a hurricane) on the affected population and to do so as efficiently as possible. Policies for achieving these can be classified into three categories.6
- Readiness: Examples of steps that can be taken in advance of a hurricane include building up inventories of components and/or finished goods as protection against capacity outages (a strategy often employed by emergency managers through “pre-positioning” of critical supplies in or near the affected area), and hardening key production and distribution processes (e.g., equipping selected service stations or gas pumps so they will be able to dispense fuel during a power outage).
- Response: The classic response to the need for emergency goods and services in the wake of a hurricane is to set up special relief supply chains. Government agencies (FEMA, Army Corps of Engineers, state governments) and nongovernmental organizations (e.g., American Red Cross, Catholic Charities, Feeding America, National Baptist Convention) deliver food, water, medical services, and many other essential
___________________
5 The scenario shown in Figures 2.2 and 2.3 could be seen as a stylized version of the shortage of intravenous saline bags created by Hurricane Maria’s disruption of manufacturing plants in Puerto Rico at the end of September 2017. Due to inventories in the supply chain, shortages at the hospital level did not become widespread until the end of 2017 and persisted well into 2018.
6 Here we use the term “readiness” to encompass activities often labeled as either “preparedness” or “mitigation”, with both referring to actions that can prevent or reduce risks of harmful impacts from a disaster. While there are varying definitions of these terms, in the context of supply chain resilience, we think of mitigation as applying primarily to investments in hardening or upgrading physical infrastructure (e.g., for power, communications, transportation, and water supply) and preparedness as applying primarily to actions or policies that strengthen social wellbeing (e.g., educating households and businesses on how to prepare for a hurricane).
- commodities to disaster-stricken communities. The special-purpose relief supply chains used by these organizations can undoubtedly save lives and reduce human suffering. They are, however, less efficient and less precise in meeting demands than the supply chains they attempt to replace.
- Recovery: Because regular supply chains have been optimized over time in response to profit motivation and market competition, they will always be more efficient at matching supply with demand than special-purpose emergency supply chains. Hence, a vital management response is to restore these supply chains as quickly as possible. The private sector will often seek to do this in service of companies’ business objectives. But a lack of coordination among government, nongovernmental organizations, and private companies can slow the restoration of regular supply chains. For example, if public relief efforts utilize a significant portion of local truck drivers, private supply chains will be slow to return to normal.
The conceptual representations of supply chains and framework for increasing their resilience in the face of a major disruption can help decision makers understand and systematically assess the management alternatives for dealing with supply chain bottlenecks. However, while this framework is useful for identifying candidate policy options, it is less useful for actually prioritizing among those options. This is because it is difficult to know where bottlenecks exist or will emerge as the storm and immediate aftermath are playing out; it is also difficult to assess the full impacts of a given activity on the reinforcement, replacement, or repair of a bottleneck. Therefore, making the best use of resources to enhance supply chain resilience also requires the strategic use of data.
One important source of data is past experience. Leveraging lessons learned from previous hurricanes can inform the development of policies for dealing with future events. Although each event is different, identifiable patterns recur (e.g., power outages close retail food and fuel outlets). These events also provide evidence of the efficacy of various policies (e.g., evacuation orders, “war room” coordination panels, mobile pantries). A second source of data is “fault tree” analysis of the critical supply chains in regions at risk of hurricanes, used to identify the links in the supply chain that are most likely to become bottlenecks. To frame such an analysis, it is helpful to introduce the following concepts.7
- Criticality of a network node, link, or other component measures the extent to which a disruption of the component will degrade the functionality of the network (which could be measured as the on-time delivery of supply to the end customer). For example, the production process of a sole-sourced component is more critical
___________________
7 Fault tree analysis is a top-down, deductive analysis method used to understand how systems can fail and to identify the best ways to reduce risk of a particular system-level (functional) failure.
- than the production process for a multi-sourced component for which other suppliers can meet much of the demand. A precise measurement of criticality for supply chain nodes and links is difficult8 since it depends on a variety of network and supply/demand characteristics that can shift over time (Alderson, 2008). But a simple way to think about criticality is to identify process stages in a supply chain for which significant reductions in capacity will lead to severe bottlenecks. This helps us recognize, for instance, that a supply node for which a ready backup exists is not critical because its failure will not result in a bottleneck.
- Vulnerability measures the likelihood that a node or link will be disrupted. For example, a production facility in a hurricane-prone region is more vulnerable than one that is not in a hurricane-prone region; and facility with sophisticated fire protection is less vulnerable than one without. The goal is not to insist on accurate estimates of failure probabilities, but instead to call out nodes and links with significant risk of being disrupted.
A node or link that is both critical and vulnerable constitutes a major source of risk that a disruption could cause adverse impacts on a supply chain. Addressing such risks is a key opportunity to make a supply chain more resilient.
In tying all these different supply chain concepts together, we note that if one has capacity to foresee where bottlenecks are likely to emerge and cause supply disruptions, and to foresee a system’s most critical and vulnerable links and nodes, one can then identify readiness, response, and recovery actions to mitigate the harm. For example, if diminished trucking capacity caused by a power outage at retail diesel fueling stations is identified as likely to impede the delivery of supplies to an affected region, several remediations emerge. A readiness policy might be to encourage (via regulation and/or subsidies) on-site generators at key fueling stations. A response policy might be to set up portable fueling stations along critical routes. A recovery policy might give repair priority to portions of the grid that supply key fueling stations.
The fundamental supply chain concepts explored in this chapter are reflected in many of the events that unfolded in the aftermath of the 2017 hurricanes, including the examples discussed in Chapter 3. These concepts likewise are important to understand as foundations for the supply chain resilience strategies recommended in Chapter 4.
___________________
8 Some criticality measures based on network connectivity do exist, however (Borner et al., 2007).


