Intermodal Chassis Provisioning and Supply Chain Efficiency: Equipment Availability, Choice, and Quality (2024)
Chapter: 4 Indications of Chassis Quality and Condition
4
Indications of Chassis Quality and Condition
The Federal Motor Carrier Safety Administration’s (FMCSA’s) decision to more directly regulate chassis safety was one of several factors prompting ocean carriers to divest most of their chassis.1 The regulations, issued in December 2008,2 require intermodal equipment providers (IEPs) to register with FMCSA; establish a systematic inspection, repair, and maintenance program for chassis fleets; and provide a means to effectively respond to driver and motor carrier reports about chassis deficiencies. The regulations also require IEPs to mark each chassis with a U.S. Department of Transportation (USDOT) identification number.
FMCSA’s regulatory initiative responded to provisions in the 2005 Safe, Accountable, Flexible, Efficient Transportation Equity Act: A Legacy for Users (SAFETEA–LU).3 The act called for regulations to ensure that equipment used to transport containers is safe and systematically maintained. Several years before the legislation, the American Trucking Associations (ATA) and its Intermodal Conference had petitioned for new regulations, contending that the trucking companies that provide drayage services do not have the opportunity to maintain the chassis, while the equipment providers were
___________________
1 Other factors include the effects of the Great Recession in reducing container shipping demand, which caused ocean carriers to reexamine their business segments to divest unprofitable operations. See Transportation Research Board. 2012. Guidebook for Assessing Evolving International Container Chassis Supply Models, NCFRP Report 20, Washington, DC.
2 Federal Register. Vol. 73, No. 243, December 17, 2008, 76794–76827.
3 Section 4118.
not fulfilling their maintenance and quality assurance responsibilities.4 In rulemaking notices preceding the 2008 rule, FMCSA presented the result of analyses of roadside inspections by federal and state law enforcement personnel of combination trucks with chassis during the period 2000 to 2003.5 The analyses focused on vehicle out-of-service (OOS) violations, which represent the most serious violations of federal safety standards and keep the equipment off the road until the repairs are made. When comparing OOS violation rates for select states where inspection data were available, FMCSA found that OOS violation rates for chassis generally (not including violations involving the power unit or driver) were about 20 percent higher than rates for other semitrailers.6 Furthermore, chassis supplied by IEPs (mostly ocean carriers at that time) had an OOS rate of 25 percent compared with 19 percent for motor carrier-owned chassis.7
FMCSA pointed to these inspection results as indicative of chassis not being maintained at a level comparable to other equipment and as justification for its new regulations governing chassis maintenance and repair. It has now been well over a decade since these regulations took effect (in December 2009) and since ocean carriers began transferring their chassis to IEPs. During this time, motor carriers have also increased their investments in chassis, resulting in a changed landscape for equipment provisioning. However, as reported in Chapter 3, motor carriers continue to raise concerns about the condition and quality of the chassis they obtain from IEPs, both from the interoperable pools and from the IEPs’ proprietary fleets. Meanwhile, the pool managers and IEPs maintain that their equipment is in good working order; however, the IEPs acknowledge that when contributing chassis to interoperable pools they can lose direct control over the condition and quality of their pooled equipment, as well as the direct links to their customers that incentivize investments in advanced chassis features.
In light of the concerns raised by the motor carriers, and asked to examine chassis provisioning practices with an eye to their potential impacts on chassis condition and quality, the committee could not help but wonder whether the longstanding concern about chassis being provided by non-motor carriers—now by IEPs rather than ocean carriers—for short-term
___________________
4 Federal Register. Vol. 64, No. 31, February 17, 1999. The American Trucking Associations, Inc. and the ATA Intermodal Conference filed a petition for rulemaking on March 17, 1997, to amend the Federal Motor Carrier Safety Regulations to require parties that tender intermodal equipment to motor carriers to ensure the “roadworthiness” of the equipment.
5 Federal Register. Vol. 71, No. 245, December 21, 2006, 76805.
6 OOS rates for other semitrailers ranged from 8.8 to 16.1 percent, compared to 17.7 to 26.3 percent for intermodal chassis for the four states of California, Louisiana, South Carolina, and Texas (Federal Register. Vol. 71, No. 245, December 21, 2006, 76804).
7 These data were for Texas only (Federal Register. Vol. 71, No. 245, December 21, 2006, 76796–76832).
rental use continue to present challenges for systematic fleet maintenance and for incentives to investment in high-quality equipment. The committee therefore revisited the main requirements of the 2008 rule and obtained more recent roadside inspection data from FMCSA for further analyses to shed light on these matters.
The key requirements of the FMCSA rule are summarized next, followed by the committee’s findings from its review of chassis inspection data for 2018 to 2022. By referencing the USDOT numbers recorded in the inspection reports from these years, it is possible to compare the inspection performance of chassis controlled by motor carriers and non-motor carriers, with the latter group including managers of interoperable pools, IEPs in their proprietary fleets, and shippers. On the basis of these comparisons and considering the continued criticisms of chassis condition expressed by motor carriers, the committee questions whether sufficient progress has been made by equipment providers in controlling chassis quality in the more than 10 years since the ocean carriers began divesting their fleets. More detailed examinations of the inspection records, which could not be undertaken in this study due to data limitations, would be helpful in revealing the sources of this persistent variability in equipment condition.
REQUIREMENTS FOR SYSTEMATIC CHASSIS MAINTENANCE AND REPAIR
In issuing the 2008 rule, FMCSA emphasized that it was intended to prevent crashes (and thus prevent injuries, save lives, and reduce property damage) and increase motor carrier operational efficiency by reducing unproductive time spent by truckers waiting for chassis repairs on the road and searching for roadworthy equipment at terminals and depots. As shown in Chapter 2, the key provisions of the 2008 rule, which remain as regulatory requirements today, are as follows:
- All intermodal chassis must be marked with the USDOT number of the party that controls the equipment’s maintenance and repair. This means that IEPs must register with FMCSA to obtain the number. It also means that a motor carrier that leases a chassis from an IEP must affix its USDOT number to the chassis when the carrier controls the equipment’s maintenance and repair.
- The IEP, or party that controls the chassis’ condition, must ensure that it is systematically inspected, repaired, and maintained and periodically inspected to verify that is in safe working order.
- Drivers continue to be required, as they must for all the equipment they bring onto public highways, to inspect the chassis and be satisfied it is in good working order. For their part, IEPs must provide
- sufficient space and opportunity for a driver to perform the pre-trip inspection, and the IEP must maintain a system for tracking and responding to inspection reports by drivers.
- The IEP must have procedures in place to repair deficiencies identified by a driver during the pre-trip inspection prior to the driver’s departure or replace the chassis with a compliant chassis. This involves onsite repair or the ability to quickly provide an alternate chassis if the driver finds that the allocated chassis is deficient.
In establishing these requirements, FMCSA stated that it would conduct “roadability” reviews to evaluate the safety of IEPs and their compliance with relevant standards. The reviews should consist of an onsite examination of the IEP’s inspection, repair, and maintenance program and its records of program activity. The reviews are supposed to be triggered by an IEP that is the subject of a complaint or a finding by FMCSA that an IEP’s fleet has higher-than-average rate of crashes or OOS violations. An unsatisfactory roadability review would allow FMCSA to impose civil penalties and prevent the IEP from providing equipment from one or more of its locations.
It merits noting that when the roadability review was proposed in rulemaking, ATA and labor organizations expressed concern8 that the reviews should be designed to be similar to the compliance (i.e., safety fitness) evaluations that are performed on motor carriers to inform FMCSA’s published carrier safety ratings (satisfactory, conditional, or unsatisfactory).9 They maintained that the addition of safety ratings would publicly identify IEPs who were not performing as required and boost their incentive for improvement. FMCSA decided against this idea, concluding that the scope of the roadability review would be limited in comparison to a full compliance review that covers the entirety of a motor carrier’s safety management controls. The agency stated that all the steps needed to rate an IEP for safety fitness would not be necessary for determining whether an effective chassis inspection, repair, and maintenance program had been established.
RECENT ANALYSIS OF CHASSIS CONDITION FROM ROADSIDE INSPECTIONS
As explained previously, FMCSA’s decision to regulate intermodal chassis was influenced in part by the results of analyses of roadside inspection reports that showed that the chassis controlled by motor carriers had consistently lower OOS violation rates than the chassis owned by non-motor
___________________
8 Federal Register. Vol. 73, No. 243, December 17, 2008, 76796.
9 Ratings can be obtained at https://safer.fmcsa.dot.gov/CompanySnapshot.aspx.
carriers. When those comparisons were made during the early 2000s, ocean carriers owned most of the chassis used for shipping marine containers. The 2008 rule’s emphasis on systematic maintenance and repair programs was supposed to narrow this difference between rates of OOS violations for non-carrier and carrier owned chassis, while bringing down violation rates generally.
Law enforcement officers perform roadside inspections of motor carriers to verify compliance with federal standards.10 The data collected from these inspections are submitted to FMCSA and stored in its Motor Carrier Management Information System (MCMIS) inspection database.11 The records contain fields that allow for the identification of trailer type, including an identifier for intermodal chassis.12 The records also contain the equipment’s vehicle identification number (VIN) that denotes the year of manufacture and the length of the chassis, which can be used to identify equipment that is typically used for marine containers. The records also indicate the type of violation and its severity (i.e., whether is an OOS violation). Because of the requirement that the entity controlling the chassis’s maintenance and repair must register the equipment with a USDOT number, this allows for the identification of chassis controlled by motor carriers (i.e., when the inspected power unit and chassis have the same USDOT number) and non-motor carriers (when the numbers do not match).
FMCSA provided the committee with intermodal chassis roadside inspection records from its MCMIS files for calendar years 2018 through 2022. After filtering the data for the 20-ft, 40-ft, and 45-ft chassis typically used for marine containers—using the process explained in Box 4-1—the committee identified 158,675 inspection records for the entire period. The total includes 58,082 records for chassis controlled by motor carriers and 100,593 records for chassis controlled by others. If vehicles operating on the public highways are inspected at random, these results would suggest that about 35 to 40 percent of the chassis on the road during this 5-year period were controlled by motor carriers and 55 to 60 percent were controlled by others, including IEPs. The degree of randomness, however, may be affected by the fact that enforcement officers will sometimes select a vehicle for an inspection after noticing a potential deficiency. Furthermore, the geographic distribution of inspections, including their proportionality with regard to traffic activity and proximity to all drayage markets, may influence the degree to which the 158,675 inspected chassis are representative of all chassis on the road. When considering the inspection data at the
___________________
10 State inspectors conduct the vast majority of inspections and FMCSA contributes funding, guidance, and training.
11 MCMIS Catalog and Documentation: Inspection File - Overview | FMCSA (dot.gov).
12 MCMIS Catalog: Inspection File - Data Element Definitions | FMCSA (dot.gov).
BOX 4-1
Use of Roadside Inspection Data for Insights on Chassis Condition
FMCSA provided data on all roadside inspections of intermodal chassis carried out between 2018 and 2022. The records contain information on inspection performance, including out-of-service violations.
The chassis VINs were decoded (when the reported number was found to be accurate and complete) to identify the chassis model year and length in feet. The decoding led to the identification of 158,675 inspection records for chassis in the 20- to 45-ft range.
| Inspection Year | Frequency | Percentage |
|---|---|---|
| 2018 | 36,118 | 22.76 |
| 2019 | 34,324 | 21.63 |
| 2020 | 25,656 | 16.17 |
| 2021 | 30,001 | 18.91 |
| 2022 | 32,576 | 20.53 |
When the USDOT number recorded for the truck matched the USDOT number for the chassis, it was assumed that the motor carrier controlled the inspected chassis. When the USDOT numbers did not match, it was assumed that a non-motor carrier controlled the inspected chassis.
level of the individual equipment provider, however, there is good reason to believe that the observed violation rates are indicative of that provider’s compliance profile.
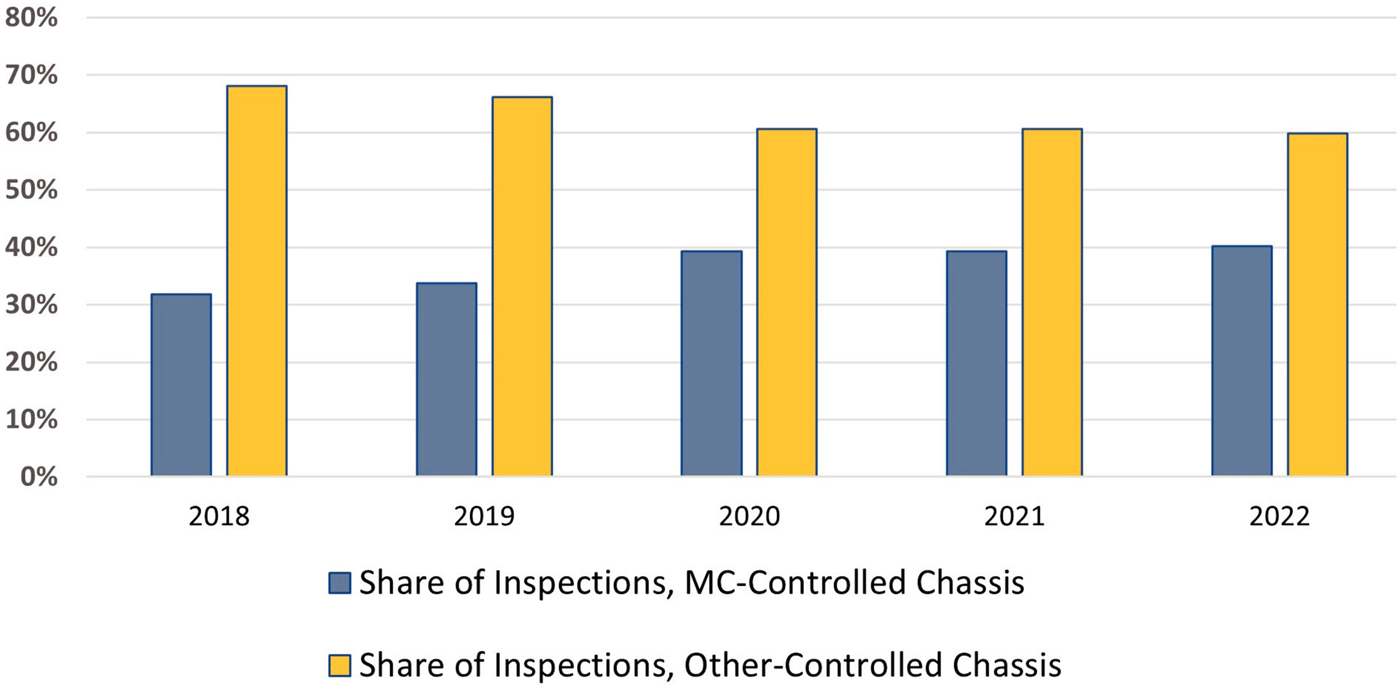
Keeping in mind that there may be some nonrandomness in the 158,675 inspection records, the data do reveal some expected patterns in the profile of intermodal chassis. For instance, the inspection data from 2018 to 2022 show that as motor carriers have become more involved with chassis ownership and long-term leasing, motor carrier-controlled chassis became more prevalent on the road. As shown in Figure 4-1, their share of inspections grew from about 30 percent to 40 percent during the period.
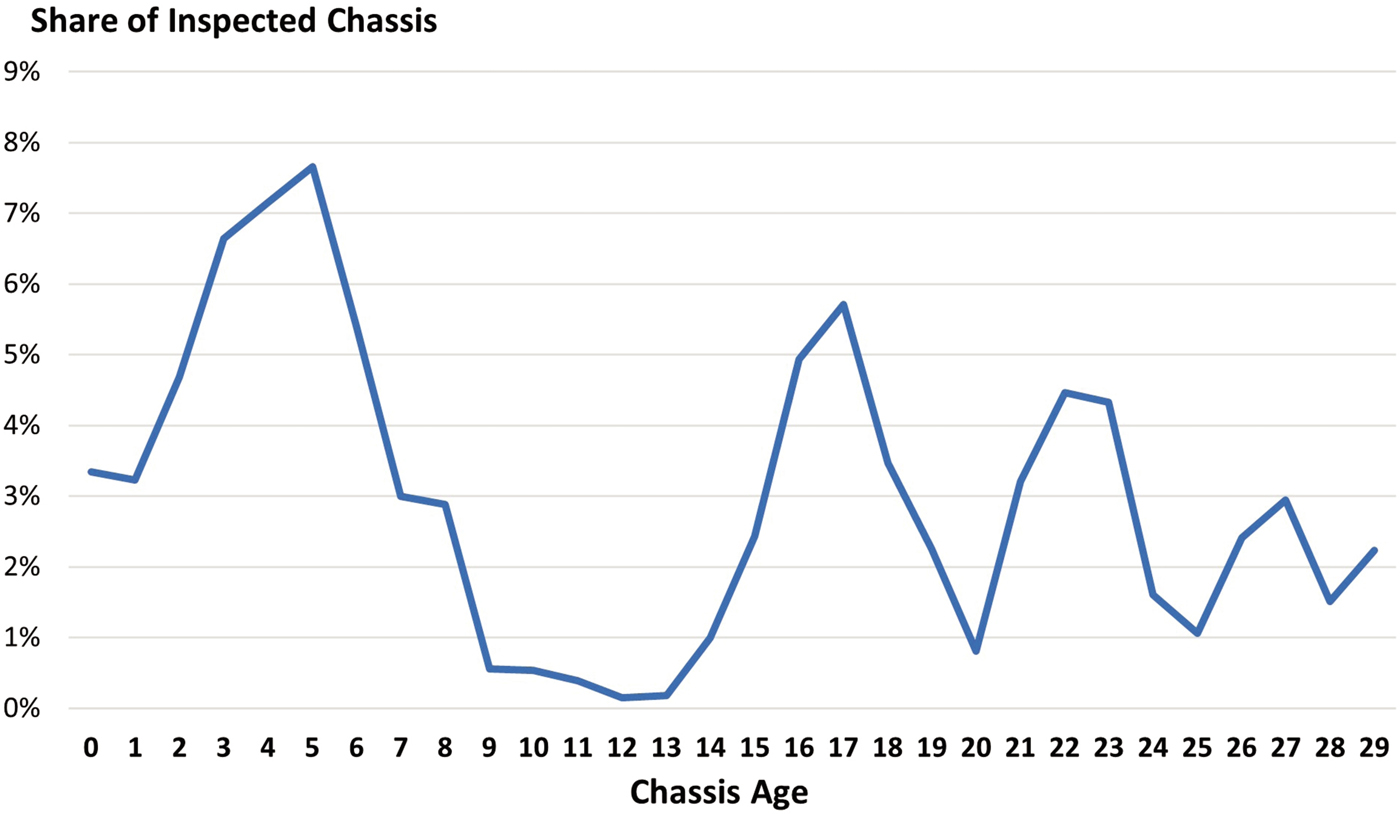
Another expected pattern from the inspection data is a chassis age distribution that shows the impacts of the ocean carriers’ divestment of their fleets 10 to 15 years ago. Figure 4-2, for instance, shows the age distribution
NOTE: MC = motor carrier.
SOURCE: Committee analysis of data from FMCSA Motor Carrier Management Information System.
SOURCE: Committee analysis of data from FMCSA Motor Carrier Management Information System.
of the chassis inspected during 2022.13 As might be expected, there was a dearth of inspected chassis within the age range of 9 to 14 years old. Chassis this age would have entered the fleet during 2008 to 2013, which coincides with the period when ocean carriers were divesting their fleets. This pattern underlines how chassis, like other transportation assets, are subject to the fluctuations of the business cycle. When the demand for container shipping was growing and shipping rates were high, ocean carriers were making asset purchases. When demand was declining, as it did during the Great Recession, the ocean carriers were not making large purchases. Hence, the current age distribution of the chassis fleet is an artifact, in part, of economic conditions that existed 10 to 15 years ago.
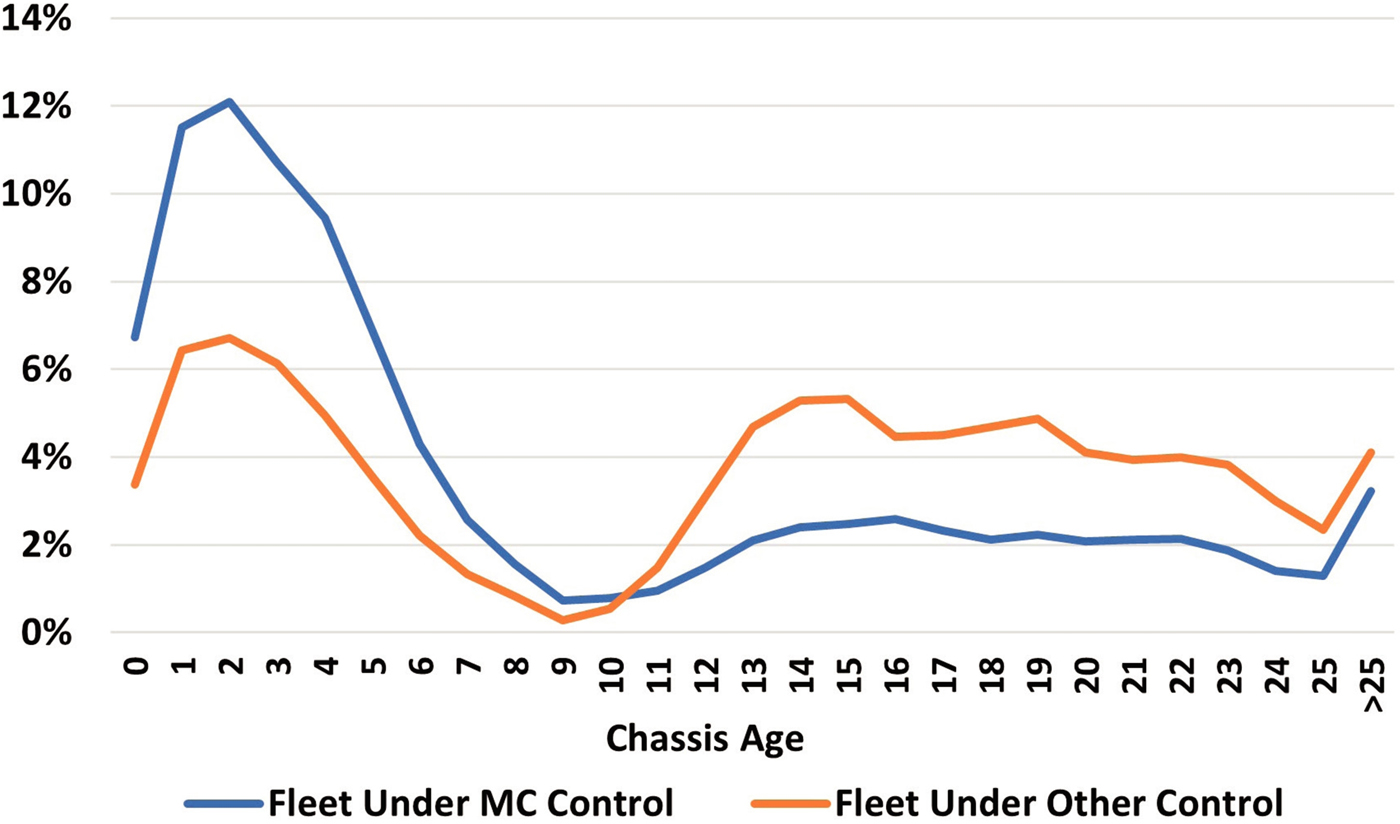
Taking a closer look at this chassis age distribution, the 2022 data also show a notable difference in the age profile of chassis controlled by motor carriers and the chassis controlled by non-motor carriers. The latter, of course, include the IEPs that inherited many chassis from the ocean carriers. As shown in Figure 4-3, in 2022 more than 70 percent of inspected chassis that were at least 9 years of age were controlled by non-motor carriers. By
NOTE: MC = motor carrier.
SOURCE: Committee analysis of data from FMCSA Motor Carrier Management Information System.
___________________
13 Age calculated based on year of manufacture and does not account for refurbishments, which are not recorded in the inspection data.
comparison, more than half of the chassis that were less than 9 years old were controlled by motor carriers. These differentials bear out the fact that motor carriers have been investing more heavily in chassis during recent years while IEPs continue to own large numbers of legacy equipment.
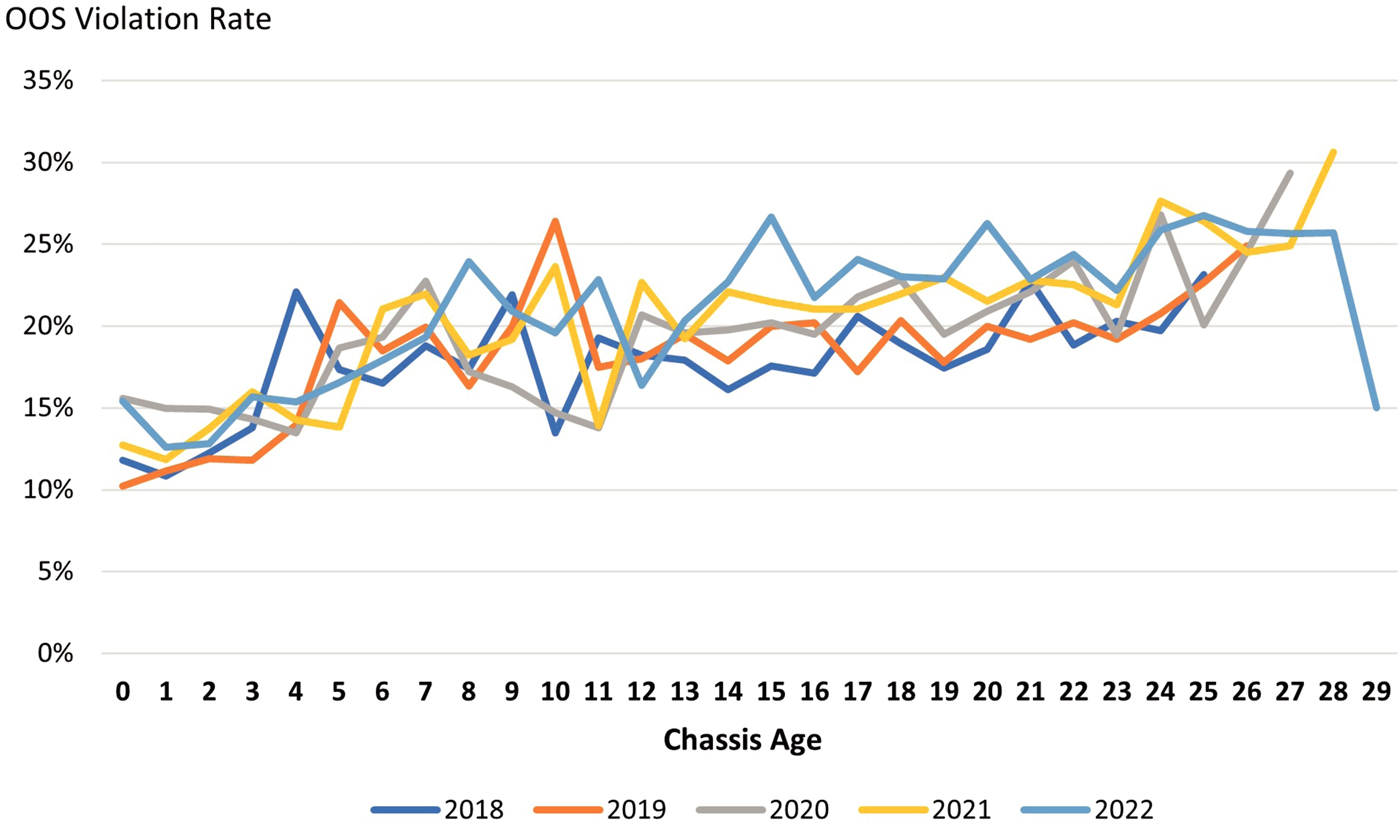
As a chassis ages, one would expect that the owner will experience increasing maintenance requirements to keep the equipment in safe working order. This may translate to poorer inspection performance. Indeed, Figure 4-4 shows OOS violation rates for chassis by age for each of the 5 inspection years, 2018 to 2022.14 The results suggest that age and inspection performance are related, as violation rates trend up from about 10 to 15 percent for newer chassis (less than 5 years) to more than 20 percent for older equipment (more than 20 years).
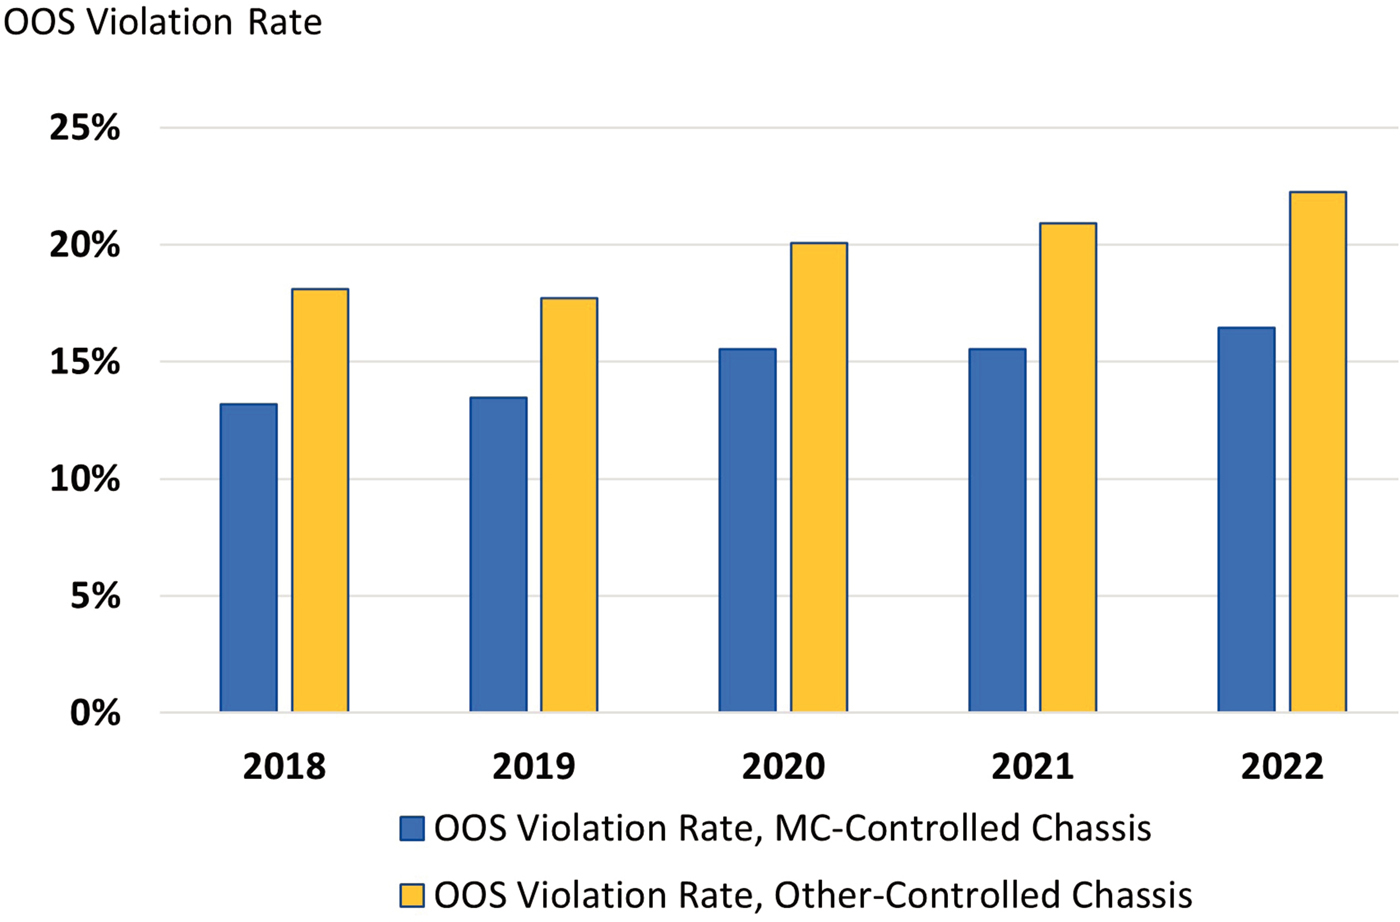
Possibly because they have newer chassis fleets on average, motor carriers had consistently lower OOS violation rates than the chassis fleets controlled by non-motor carriers. Figure 4-5 shows violation rates for both fleet types for inspections conducted during 2018 to 2022. Violation rates
NOTE: OOS = out-of-service.
SOURCE: Committee analysis of data from FMCSA Motor Carrier Management Information System.
___________________
14 For these calculations, any inspection that results in at least one OOS citation is treated as a violation. Some inspected chassis will have more than one citation leading to an out-of-service designation.
NOTE: MC = motor carrier; OOS = out-of-service.
SOURCE: Committee analysis of data from FMCSA Motor Carrier Management Information System.
for motor carrier–controlled chassis hover around 15 percent, compared with 20 percent for chassis controlled by non-motor carriers. It is notable, however, that violation rates for both fleets trended slightly upward from 2018 to 2022. The causes of this development are not clear but could be suggestive of a need for more year-to-year trend monitoring.
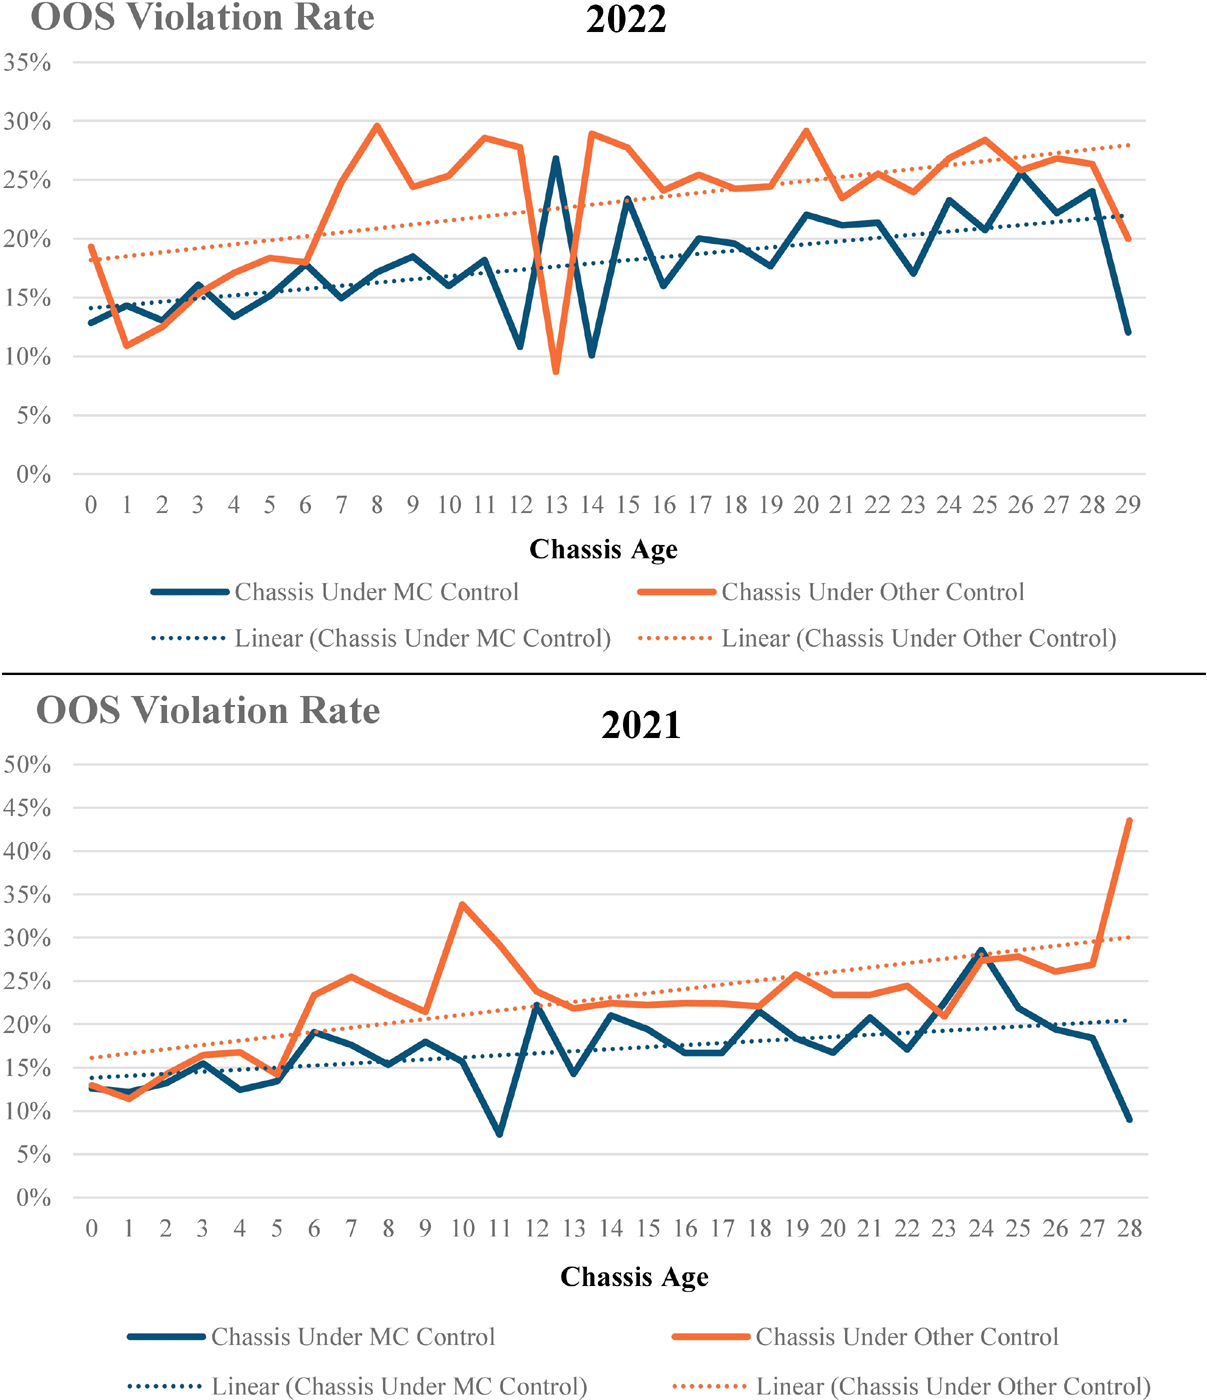
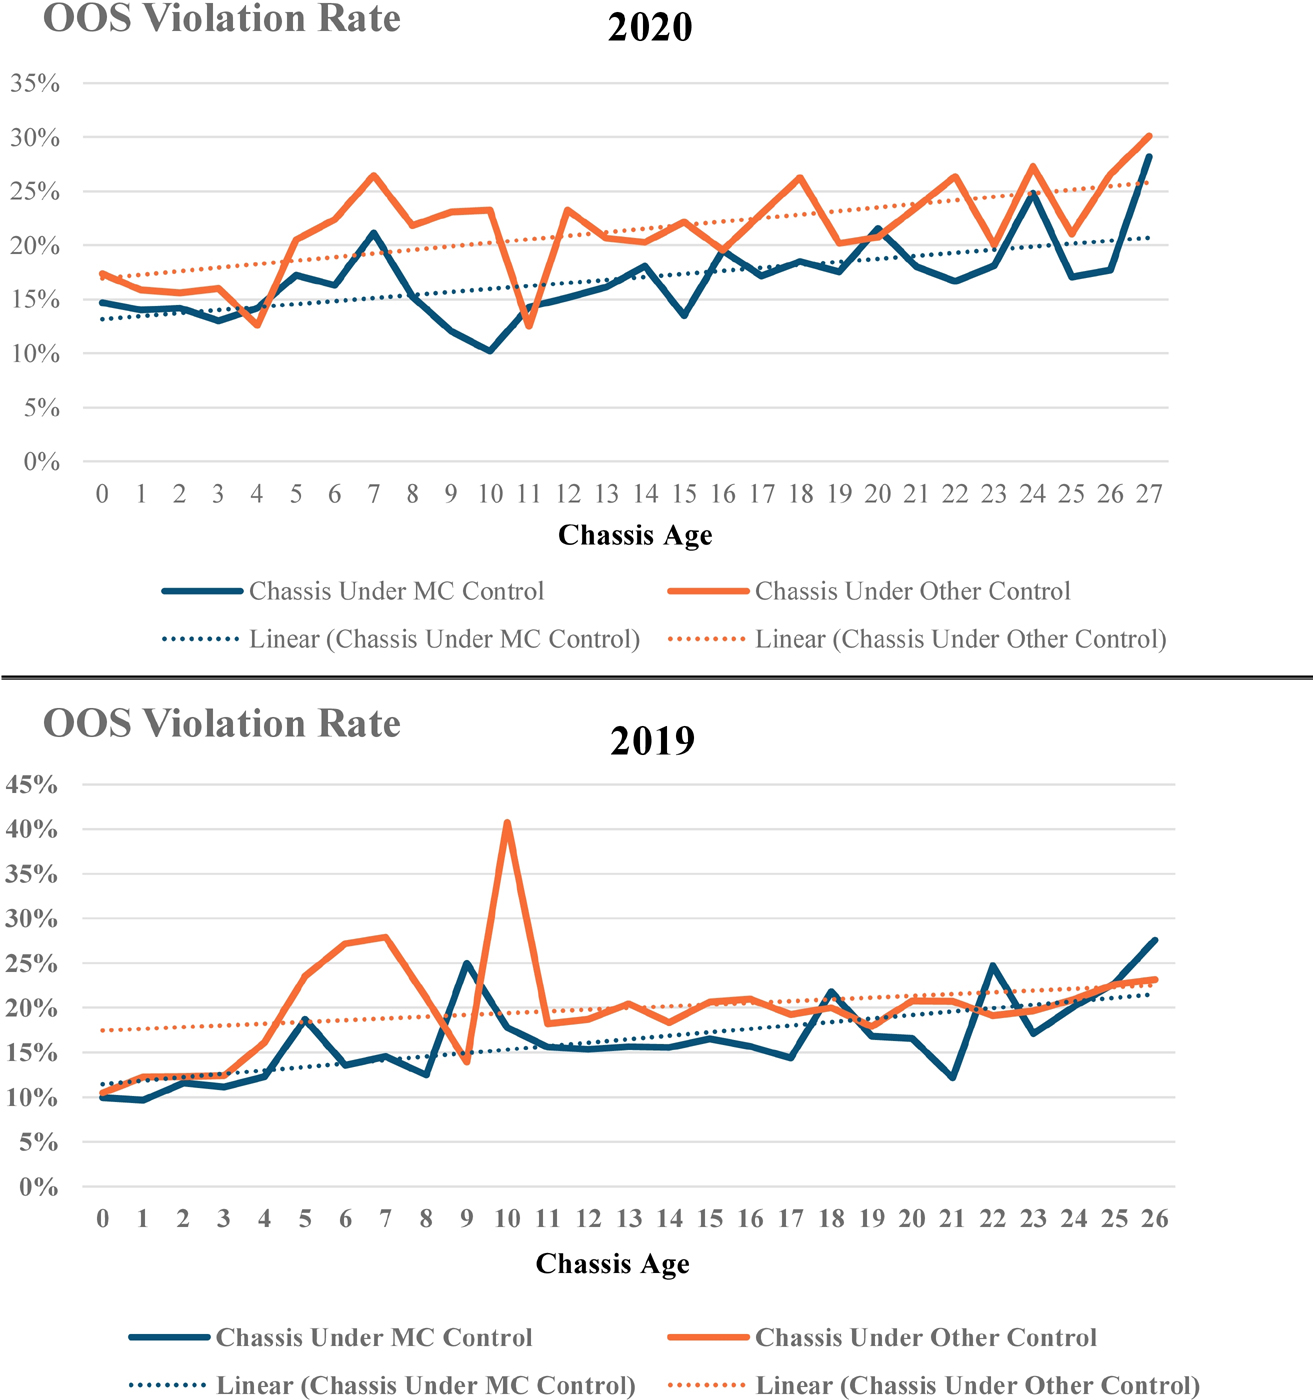
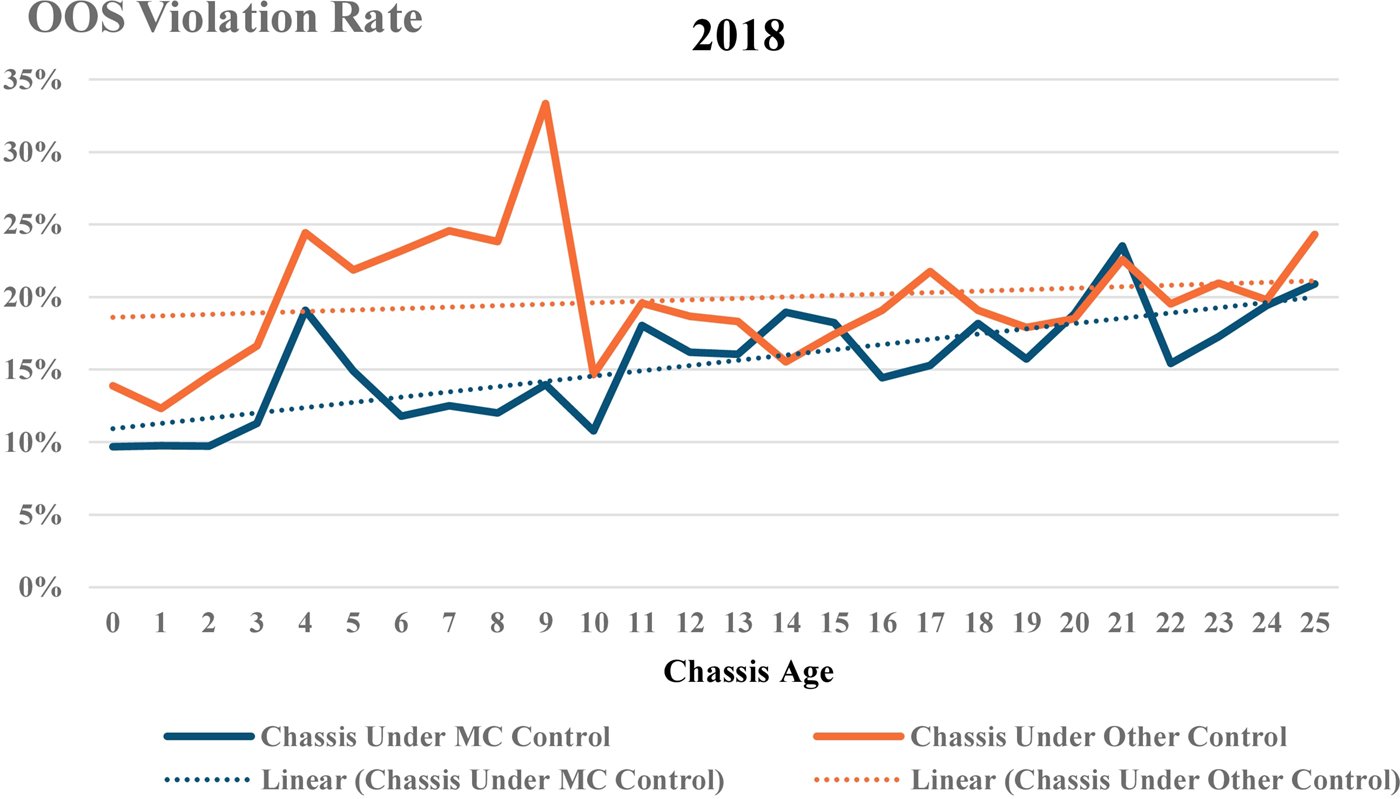
Keeping in mind the longstanding concerns raised by motor carriers about the condition of the chassis they obtain from IEPs, it merits considering whether age alone is the reason for the persistent differences in OOS violation rates among chassis controlled by motor carriers and by non-motor carriers. Figure 4-6 consists of a series of charts that compare OOS violation rates by chassis age from 2018 to 2022, using both the data and linear regression lines showing trends. While age is indeed associated with increasing violation rates for both fleet types, the chassis controlled by motor carriers have mostly lower violation rates irrespective of age, albeit with some notable variations in the differential over the 5-year period. By controlling for chassis age, these results suggest that other factors are also contributing to the variability in inspection performance among motor carrier and non-motor carrier chassis fleets.
NOTE: MC = motor carrier; OOS = out-of-service.
SOURCE: Committee analysis of data from FMCSA Motor Carrier Management Information System.
Because the inspection records contain USDOT numbers, this information can be used to identify the specific company that controls the inspected chassis. This information, in turn, can be used to calculate the OOS violation rates of those companies. Table 4-1 provides the OOS violation rates calculated for non-motor carrier companies and for motor carriers whose chassis underwent the most inspections from 2018 to 2022. In the case of the non-motor carriers (consisting predominantly of IEPs and chassis pool managers), the violation rates are shown for groupings of the top 5, 10, and 25 companies ranked by number of inspections. For the motor carriers, only the top 25 grouping is provided because there are no dominant chassis fleet owners.
For the chassis inspected that were controlled by non-motor carriers, OOS violation rates averaged about 20 percent, with the size of the fleet (as indicated by total inspections) having little discernible impact on this rate. Among the motor carrier-controlled chassis, the larger fleets (again, as indicated by total inspections), have lower violation rates, averaging 12 percent versus the nearly 15 percent for non-motor carrier chassis inspections. Here again, Table 4-1 provides analysis suggesting that the motor carrier–controlled chassis perform better in inspections on average than the non-motor carrier–controlled chassis.
Finally, Table 4-2 provides the OOS violation rates for the non–motor carrier companies whose fleets were subject to at least 100 roadside
TABLE 4-1 Roadside Inspection Performance of Chassis in Fleets Controlled by Motor Carriers and Non-Motor Carriers, 2018-2022
| Non-Motor Carriers Controlling Chassis | ||||
|---|---|---|---|---|
| Companies with Most Chassis Inspected | Inspections of Non–Motor Carrier Chassis | Share of Total Inspections of Non–Motor Carrier Chassis | Inspections with at Least One OOS Violation | At Least One OOS Violation Rate |
| Top 5 | 68,538 | 68.1% | 13,974 | 20.4% |
| Top 10 | 79,319 | 78.9% | 16,144 | 20.4% |
| Top 25 | 90,909 | 90.3% | 18,130 | 19.9% |
| All | 100,593 | 100% | 19,749 | 19.6% |
SOURCE: Committee analysis of data from FMCSA Motor Carrier Management Information System.
| Motor Carriers Controlling Chassis | ||||
|---|---|---|---|---|
| Companies with Most Chassis Inspected | Inspections of Motor Carrier Chassis | Share of Total Inspections of Motor Carrier Chassis | Inspections with at Least One OOS Violation | At Least One OOS Violation Rate |
| Top 25 | 10,354 | 17.8% | 1,247 | 12.0% |
| All | 58,082 | 100% | 8,640 | 14.9% |
NOTE: OOS = out-of-service.
SOURCE: Committee analysis of data from FMCSA Motor Carrier Management Information System.
inspections in 2022. It is notable that there is wide variability in violation rates among these companies. At the same time, very few of them perform as well in inspections as motor carriers as a group.
ASSESSMENT
The condition and quality of intermodal chassis have been a public concern for at least 25 years,15 prompting Congress to require new federal regulations subjecting the equipment and their providers to more direct federal oversight. Nearly 15 years have passed since these regulations took effect in 2009, including requirements for entities that control the chassis
___________________
15 When, as noted previously, ATA petitioned for stricter regulation of intermodal equipment providers.
TABLE 4-2 Chassis Out-Of-Service Violation Rates for Non-Motor Carriers with at Least 100 Roadside Inspections in 2022
| Chassis DOT Number | Total Inspections | Inspections with at Least One OOS Violation | OOS Violation Rate | Company Name |
|---|---|---|---|---|
| 1962258 | 248 | 70 | 28.2% | MID-SOUTH CONSOLIDATED CHASSIS POOL, LLC |
| 1521807 | 3,725 | 1,028 | 27.6% | TRAC INTERMODAL |
| 3465183 | 203 | 56 | 27.6% | CONSOLIDATED CHASSIS MANAGEMENT, LLC |
| 1909823 | 5,216 | 1,415 | 27.1% | DIRECT CHASSISLINK, INC. |
| 194275 | 338 | 81 | 24.0% | MATSON NAVIGATION COMPANY, INC. |
| 1950823 | 138 | 26 | 18.8% | DOLE FRESH FRUIT COMPANY |
| 250593 | 102 | 14 | 18.7% | SEABOARD MARINE LTD., INC. |
| 1962255 | 2,701 | 495 | 18.3% | SOUTH ATLANTIC CONSOLIDATED CHASSIS POOL, LLC |
| 3016735 | 641 | 113 | 17.6% | MILESTONE CHASSIS COMPANY, LLC |
| 1977624 | 1,530 | 267 | 17.5% | FLEXI-VAN LEASING, LLC |
| 2597206 | 130 | 22 | 16.9% | NORTH AMERICAN CHASSIS POOL COOPERATIVE, LLC |
| 2861558 | 150 | 23 | 15.3% | PASHA HAWAII HOLDINGS, LLC |
| 2878837 | 105 | 16 | 15.2% | AMERICAN INTERMODAL MANAGEMENT, LLC |
| 1782219 | 256 | 38 | 14.8% | CROWLEY LINER SERVICES |
| 1907321 | 1,332 | 100 | 7.5% | HRCP II, LLC |
NOTE: DOT = U.S. Department of Transportation; OOS = out-of-service.
SOURCE: Committee analysis of data from FMCSA Motor Carrier Management Information System.
to establish systematic inspection, maintenance, and repair programs and for FMCSA to monitor the quality and implementation of the programs through various means, including targeted roadability reviews. Although applicable to all entities that control chassis, the regulations were directed at non–motor carrier equipment providers that had not previously been subject to direct FMCSA oversight, as their chassis had been found to have higher violation rates during roadside safety inspections.
Since the introduction of these regulations, the structure of the chassis provisioning industry has changed substantially; however, the majority of chassis continue to be controlled and tendered by intermodal equipment providers. Furthermore, concerns about chassis condition and quality have persisted, particularly by motor carriers, who (as discussed in Chapter 3) complain about containers being pre-mounted on deficient chassis and difficulties encountered by drivers finding roadworthy chassis when searching at terminals and at the depots of interoperable pools and IEPs, where chassis are often stacked for storage. While FMCSA regulations assign responsibility to the driver to perform pre-trip inspections and be satisfied that the equipment is in safe working condition before using it, the chassis provider is also expected to perform inspections regularly and have a systematic maintenance and repair program.
From its review of FMCSA roadside inspection records from recent years (2018 to 2022), the committee observes that marked differences persist in the condition of chassis controlled by motor carriers and the chassis controlled by non-motor carriers. Indeed, the size of this differential, even when accounting for chassis age, is about the same today as it was before FMCSA required IEPs to establish maintenance and repair programs. Motor carrier–controlled chassis continue to perform better during roadside inspections, as they are cited less often for OOS violations than chassis controlled by non-motor carriers. One potential explanation for why chassis controlled by non-motor carriers have higher OOS violations is that they tend to have a higher utilization rate, as the chassis are more likely to be leased on short-term or spot rentals and repositioned to pools of higher demand as the demand patterns change. This higher utilization rate could lead to greater wear and tear on the equipment. Still, as motor carriers have invested in more chassis over the last several years one would expect that, as a group, they would perform better in inspections due to their newer fleets; however, the inspection data also indicate that motor carriers perform better than other chassis owners for same-age equipment. The implication is that motor carriers have a stronger vested interest in ensuring good maintenance of their chassis since it is directly linked with their capability to minimize costs and generate greater revenue.
FMCSA’s publicly available reports do not indicate whether roadability reviews have been performed by its enforcement personnel during the past 5 years. It is conceivable that the agency has not received a serious complaint about chassis quality or made its own finding that an individual IEP has an unsatisfactory inspection record. Nevertheless, the committee observes that concerns about the condition of the chassis supplied by non-motor carriers have not abated. When coupled with the data analysis presented in this chapter about chassis inspection performance, the persistence of these concerns suggests that even more concerted efforts may be warranted to ensure chassis condition and quality.
This page intentionally left blank.


