Bridge Railing Design Requirements (2024)
Chapter: 3 Synthesis of Literature Review

CHAPTER 3
Synthesis of Literature Review
Since the implementation of the bridge rail guidance provided in AASHTO LRFD BDS Section 13 (AASHTO 2017), the landscape of roadside safety hardware testing, evaluation, and design has changed significantly. The preceding standards of NCHRP Report 350 (Ross et al. 1993) have been replaced by those of MASH (AASHTO 2016) in a conversion accompanied by near-universal increases to vehicle impact severities. Full-scale crash testing and computer simulation studies have indicated that this conversion has rendered several existing bridge rail design requirements insufficient. Additionally, advances in computer simulation and more abundant test data have resulted in more informed design force estimates. A wide variety of research efforts has been conducted in which new, substantial design methods have been proposed for concrete barriers, MASH-compliant designs have been demonstrated, and general design guidance not found in current standards has been provided. This chapter serves as a synthesis of the research performed in the roadside safety community deemed most relevant to the design and analysis of bridge rail systems.
Subsequent to the initiation of this research project, NCHRP Project 12-119 (Steelman et al. 2023) was initiated to investigate bridge overhang design with AASHTO MASH test criteria. This work is reported separately and is not part of the synthesis of literature reviewed in this chapter.
Proposed Design Parameters
Current AASHTO LRFD BDS guidance contains minimum height and capacity requirements for bridge rails. These provisions address the risk of vehicle instability and structural failure in impacts between bridge rail systems and errant vehicles. However, current guidance was informed by NCHRP Report 350 criteria and therefore does not reflect the state of the practice in the design and evaluation of roadside safety hardware. Multiple research efforts have yielded alternative height and force requirements better reflecting MASH criteria.
Minimum Barrier Height
When a vehicle strikes a bridge rail system, an overturning moment proportional to the height discrepancy between the vehicle’s center of mass and the resultant force of the rail is produced. For the vehicle to remain stable, the height of the barrier must be sufficiently tall such that the weight of the vehicle can negate the overturning moment. It should be noted that current AASHTO LRFD BDS minimum barrier heights are based on equation A13.2-1, which estimates the barrier height required for rotational equilibrium about the impacting tire (AASHTO 2020a). In other words, current AASHTO height requirements are set such that all four tires will theoretically stay on the ground.
Due to increases in vehicle weights and more severe impact conditions, vehicles under MASH criteria are subjected to greater overturning moments through the impact sequence. As a result, greater barrier heights are required for some test levels to arrest the vehicle’s motion and maintain stability. The insufficiency of current AASHTO LRFD BDS design heights is most evident in two unsuccessful MASH TL-4 tests in which an SUT overrode a 32-in. concrete barrier (Polivka et al. 2006; Bullard et al. 2010).
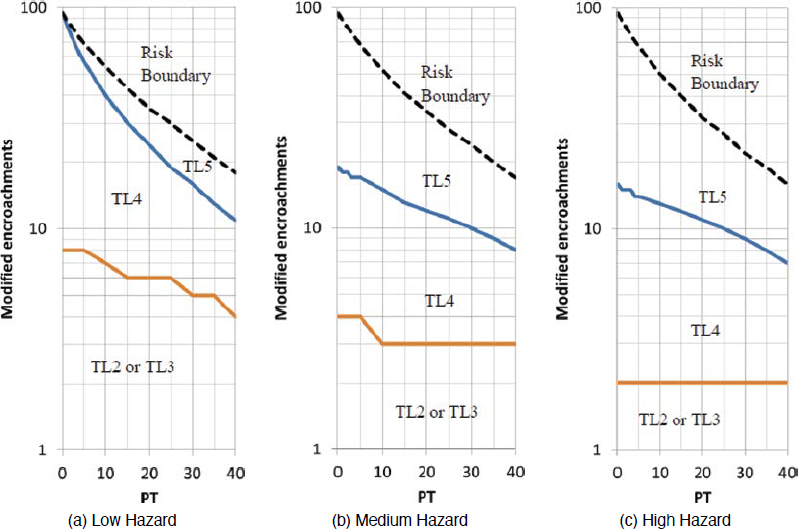
Minimum barrier heights can be estimated based on minimum barrier heights successfully tested to MASH criteria. Recent MASH-compliant crash tests have produced alternative minimum barrier heights for TL-1 through TL-4. These height proposals are reinforced by simulation studies performed by Bligh et al. (2017) and Silvestri-Dobrovolny et al. (2017). Minimum barrier heights, as determined through full-scale crash testing and computer simulation studies, are presented in Table 29.
In sum, crash-testing data indicate that reductions of the TL-1 and TL-2 minimum heights are permissible. Alternatively, the data indicate that the minimum barrier heights for TL-3 and TL-4 should be increased. TL-5 and TL-6 impact conditions were unchanged. It follows that no alternative barrier heights have been proposed for these test levels. It should be noted, however, that a simulated 62-in. barrier successfully redirected a MASH tanker trailer in a study performed by Whitfield (2018).
The simulation studies and full-scale crash tests summarized in Table 29 inform confident alternatives to current AASHTO LRFD BDS guidance. A summary of proposed changes to AASHTO LRFD BDS Section 13 barrier heights is shown in Table 30.
These increased barrier heights for TL-3 and TL-4 are more appropriate than current AASHTO LRFD BDS values, as they reflect MASH conditions and, in turn, the state of the practice. It should be noted, however, that these required heights apply only to rigid barriers. Flexible barriers of lesser heights may be capable of maintaining vehicle stability by virtue of reduced lateral loads.
Design Forces
AASHTO LRFD BDS design forces require modification to address the more severe impact conditions associated with MASH criteria. Estimating impact forces, however, is more challenging
Table 29. Minimum barrier heights addressing MASH criteria.
| MASH Test Level | Minimum Tested Height (in.) | Reference | Minimum Simulated Height (in.) | Reference |
|---|---|---|---|---|
| 1 | 19.75 | Rosenbaugh et al. 2009 | — | — |
| 2 | 20.00 | Silvestri-Dobrovolny et al. 2022 | — | — |
| 3 | 30.00 | Schmidt et al. 2019 | 29.0 | Silvestri-Dobrovolny et al. 2017 |
| 4 | 36.00 | Sheikh et al. 2011 | 34.5 | Rosenbaugh et al. 2012 |
| 5 | 41.30 | Buth and Menges 2011 | — | — |
| 6 | 90.00 | Hirsch and Fairbanks 1984; Beason et al. 1989 | 62.0 | Whitfield 2018 |
Table 30. Proposed changes to AASHTO LRFD BDS minimum barrier heights.
| MASH Test Level | Existing AASHTO LRFD Minimum Height (in.) | Proposed Minimum Height (in.) |
|---|---|---|
| 1 | 27 | 20 |
| 2 | 27 | 20 |
| 3 | 27 | 30 |
| 4 | 32 | 36 |
| 5 | 42 | 42 |
| 6 | 90 | 90 |
than estimating required barrier heights. While many methods exist for estimating impact forces (see Chapter 2), no one method is viewed as ideal. Whereas minimum barrier heights can be explicitly validated via full-scale crash testing, clear validations of force estimates are difficult to capture reliably during crash testing. The proposed design values presented herein are to be viewed with these limitations in mind; these values are simply the most recent estimates.
Proposed design forces can be separated into several categories to reflect the disparate methods from which they were formed. These categories are (1) computer simulation estimates, (2) instrumented barrier estimates, (3) theoretical estimates, and (4) crash-test inertial estimates.
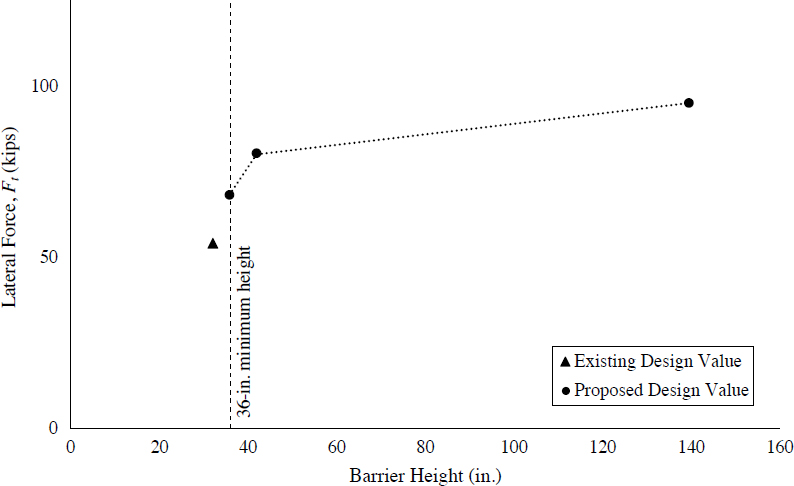
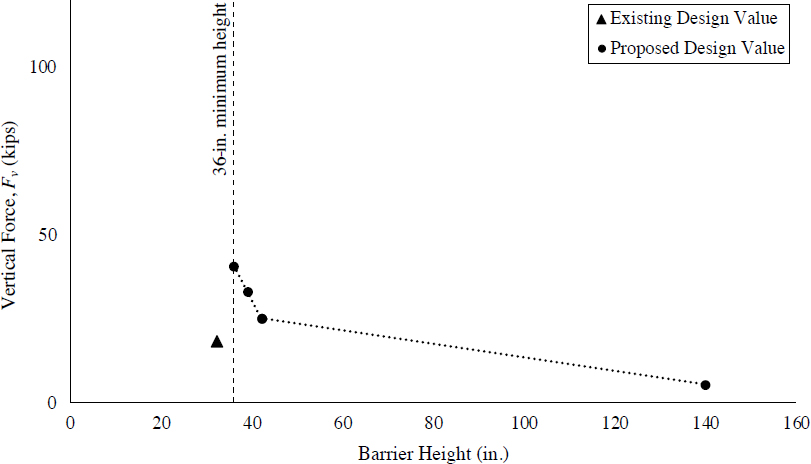
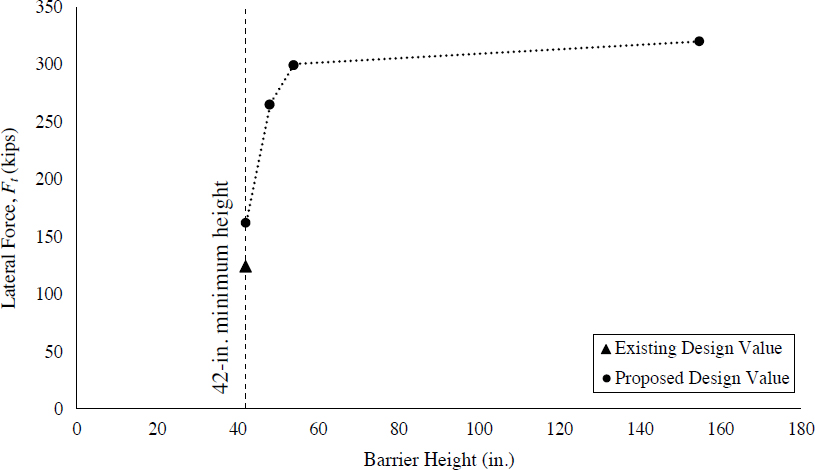
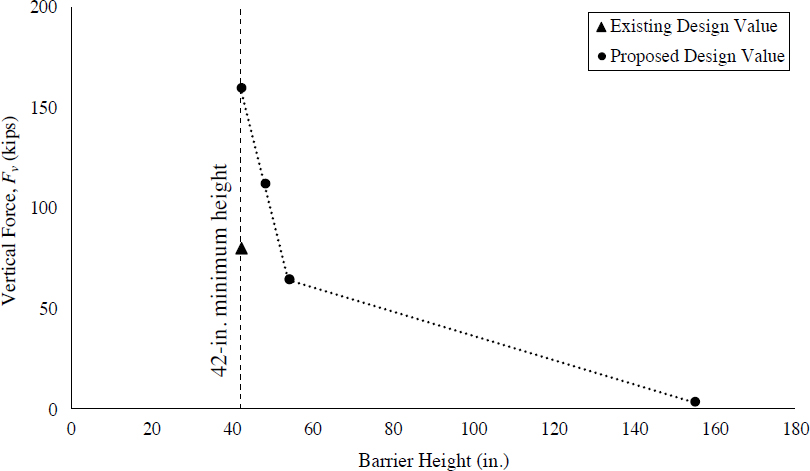
The first category, computer simulation estimates, is the most prominent category available in contemporary research. Computer simulations performed in LS-DYNA by Silvestri-Dobrovolny et al. (2017) and Bligh et al. (2017) yielded design force estimates for MASH conditions. Silvestri-Dobrovolny et al., under NCHRP Project 20-07(395), investigated lateral impact loads for TL-3 conditions. Similarly, Bligh et al. (2017) estimated lateral, vertical, and longitudinal impact loads for TL-4 and TL-5 conditions. In this study, a clear relationship between barrier height and impact force was observed: lateral impact forces increase with height, as vehicle roll is impeded by increasingly severe engagement between the cargo box and barrier; conversely, vertical impact forces decrease with height, as the impeded roll of the cargo box prevents the vehicle from leaning on taller barriers. Due to this relationship, Bligh et al. (2017) proposed that TL-4 and TL-5 be separated into two sublevels based on the height of the barrier. Proposed design forces extracted from these computer simulation studies are presented in Table 31.
While the sublevels proposed by Bligh et al. are binary and change drastically when the height of the barrier is increased above the minimum height, detailed results of the study indicate a
Table 31. Design forces proposed in simulation studies.
| Design Parameter | Railing Test Level | |||||
|---|---|---|---|---|---|---|
| TL-3 | TL-4-1 | TL-4-2 | TL-5-1 | TL-5-2 | TL-6 | |
| Bridge Rail Height, H (in.) | ≥ 29 | 36 | > 36 | 42 | > 42 | NA |
| Lateral Force, Ft (kips) | 71 | 70 | 80 | 160 | 260 | NA |
| Longitudinal Force, FL (kips) | NA | 22 | 27 | 75 | 75 | NA |
| Vertical Force, Fv (kips) | NA | 38 | 33 | 160 | 108 | NA |
NOTE: NA = not available.
more gradual variation of impact forces with barrier height. Variations of impact forces for TL-4 and TL-5 conditions, when simplified to linear relationships, are demonstrated in Figures 195 through 198. Expressed in terms of barrier height, lateral and vertical impact forces for TL-4 and TL-5 can be estimated via Equations 96 through 99. Lateral impact force distributions for TL-5 were more variable, as first, second, and third impacts exert different forces. The design force relationship demonstrated in Figure 197 and expressed in Equation 81 corresponds to the most severe lateral load exerted in the first, second, and third impact at each barrier height. A more detailed discussion of the relationship between impact force and barrier height is presented in Chapter 2.
| (96) |
| (97) |
| (98) |
| (99) |
Additionally, design force alternatives can be extracted from instrumented wall tests performed by Noel et al. (1981) and Beason et al. (1989). While these instrumented wall tests were performed to NCHRP Report 230 criteria (Michie 1981), a scaling expression can be used to modify the
measured impact forces to reflect MASH conditions. In fact, the current AASHTO LRFD BDS design forces were formulated by applying this same methodology. However, rather than scaling to MASH conditions, the instrumented wall measurements were scaled to NCHRP Report 350 conditions. The scaling expression, which was presented and discussed in Chapter 2, is reiterated below:
| (100) |
wherein Fi is the impact force, Vi is the impact velocity, θi is the impact angle, Li is the longitudinal distance from the front of the test vehicle to its c.g., Ki is the barrier contact area or stiffness, and Wi is the vehicle weight. Subscripts distinguish the impacts, with the parameters of the instrumented wall test denoted with subscript 1, and the impact with the desired conditions denoted with subscript 2.
If this scaling expression is applied to the results of the instrumented wall tests performed by Beason et al. (1989) (Table 32), alternative MASH design forces can be estimated. To determine the maximum lateral impact force for each test level, the instrumented wall test results were modified to reflect the nominal conditions of each test designation number within each MASH test level. The design forces extrapolated from instrumented wall testing presented in Table 33 represent the maximum force calculated within each test level. As the distance from the front of the vehicle to the c.g. is not stipulated for SUT test vehicles, this parameter’s ratio was considered to be equal to 1 for TL-4 force estimation.
Impact forces can also be estimated theoretically without guidance from simulations or physical testing data. Theoretical estimation methods are discussed in detail in Chapter 2. Theoretical design forces estimated via the Impulse-Momentum Method (Ritter et al. 1993) are provided in Table 34. As for Table 33, the values correspond to maximum values at each test level (i.e., using the heavier pickup truck rather than the small car for TL-1 through TL-3 and the SUT for TL-4). It should be noted that this method is not accurate for articulated vehicles, as tail-slap is not addressed. As such, the Impulse-Momentum Method was not used to estimate impact forces for MASH TL-5 and TL-6.
Additionally, impact forces can be estimated from vehicle decelerations measured in full-scale crash tests. This process, which is outlined by Eller and Reid (2007), involves using vehicle yaw data to align the vehicle’s coordinate system with that of the barrier and calculating lateral impact
Table 32. Instrumented wall test results (scaled to MASH) (Beason et al. 1989).
| Vehicle | Weight (lb) | Velocity (mph) | Impact Angle (degrees) | Maximum Impact Force (kips) |
|---|---|---|---|---|
| Automobile | 4,500 | 61.8 | 25.6 | 56 |
| Pickup Truck | 5,409 | 65.8 | 19.9 | 45 |
| SUT | 18,050 | 51.6 | 16.8 | 90 |
| Tractor-Van Trailer | 80,080 | 55.0 | 15.3 | 220 |
| Tractor-Tank Trailer | 79,900 | 54.8 | 16.0 | 408 |
Table 33. Design force estimates from extrapolated instrumented wall test results (scaled to MASH).
| Design Parameter | Railing Test Level | |||||
|---|---|---|---|---|---|---|
| TL-1 | TL-2 | TL-3 | TL-4 | TL-5 | TL-6 | |
| Lateral Force, Ft (kips) | 14 | 27 | 54 | 105 | 177 | 318 |
forces from lateral and longitudinal decelerations. Dynamic impact force estimates extracted from crash tests using this method are summarized in Table 34.
Last, researchers at MwRSF related impact severity to peak lateral impact load using linear regression. By investigating six tractor-tank trailer tests and comparing impact severity to the peak lateral load estimated using changes in vehicle inertia, a linear relationship between impact severity and peak load was formed. Development of this method included both a relationship for the total impact severity and a relationship for the impact severity associated with the rear tandem axle of the vehicle. For the MASH TL-5 tractor-tank trailer, both relationships estimated the peak lateral impact load at just under 250 kips.
In sum, current AASHTO LRFD BDS design loads correspond to NCHRP Report 350 impact conditions and require revision to reflect MASH criteria. Alternative lateral design loads have been proposed from computer simulation studies (Bligh et al. 2017); instrumented wall extrapolation (Beason et al. 1989); a theoretical, impulse-momentum method (Ritter et al. 1993); and crash-test inertial measurements (Eller and Reid 2007). Alternative lateral design loads are compared to existing AASHTO LRFD BDS design loads in Table 34. The shaded row is the primary reference used to establish recommendations for this report.
All available methods of determining forces have limitations. Historical impulse-momentum methods required approximations, simplifications, and assumptions for vehicle damage absorption
Table 34. Summary of impact force estimates.
| Lateral Design Force Estimate | TL-1 (kips) | TL-2 (kips) | TL-3 (kips) | TL-4 (kips) | TL-5 (kips) | TL-6 (kips) |
|---|---|---|---|---|---|---|
| Existing AASHTO LRFD BDS Design Force (AASHTO 2020a) | 13.5 | 27 | 54 | 54 | 124 | 175 |
| Computer Simulation in LS-DYNA (Bligh et al. 2017)a | NA | NA | 71 | 70b | 160b | NA |
| 80c | 260c | |||||
| Extrapolation of Instrumented Wall Data (Beason et al. 1989) | 14 | 27 | 54 | 105 | 177 | 318 |
| Impulse-Momentum Formulation (Ritter et al. 1993) | 17 | 35 | 70 | 98 | NA | NA |
| Crash-Test Vehicle Deceleration Measurement (Eller and Reid 2007) | NA | NA | 80–90 | 100–110 | 200+ | NA |
| Linear Regression from Impact Severity (Faller et al. 2004) | NA | NA | NA | NA | 250 | NA |
aImpact force estimates from NCHRP Project 20-07(395) (Silvestri-Dobrovolny et al. 2017) and NCHRP Web-Only Document 326 (Bligh et al. 2017) are the most recent estimates.
bIf the height of the rail is 36 in. for TL-4 or 42 in. for TL-5.
cIf the height of the rail is >36 in. for TL-4 or >42 in. for TL-5.
NA = not available.
and post-event trajectories and were more reliable for vehicle impacts that were not significantly influenced by vehicle roll.
Although physical tests would intuitively be expected to be the most reliable method, the force determination from tests is typically not a direct determination of force from mechanical deformation but from vehicle deceleration. The signal is high-frequency, susceptible to noise, and must be digitally processed with filters as a first step. Vehicle articulation further complicates force determination for 10000S and heavier vehicles. Translational and rotational components of 3D yaw, roll, and pitch must be inferred from the filtered data recorded by accelerometers, and then the vehicle mass is further assumed to behave as articulated rigid masses. Ballast movement during an impact event can reduce the reliability of force determination from crash tests. Additionally, force determination is limited to tested system configurations.
On the other hand, simulation results from LS-DYNA or comparable software platforms provide direct definition of impact loads by integrating contact forces over surfaces. While this approach is cleaner than the complicated post-processing required for crash-test accelerometer data, it is also entirely dependent on the accuracy of modeled vehicle geometry, material properties such as metal yield strengths, and connection or interaction definitions between components. The vehicle models used in NCHRP Web-Only Document 326 were validated and deemed adequately reliable to determine forces during impacts for that study (Bligh et al. 2017). Modeled barriers were then able to be easily parameterized to examine the influence of varying barrier heights, which was intuitively anticipated to influence impact forces due to restrained vehicle roll.
Based on the acceptance that the 10000S and 36000V models used in NCHRP Web-Only Document 326 were validated and deemed reliable and the fact that the barriers were simply rigid walls that did not pose complications from vehicle snag on joints or irregular surface features, the results from NCHRP Web-Only Document 326 simulations are proposed for incorporation into Section 13 to represent peak dynamic vehicle impact loads on railings (Bligh et al. 2017).
Location and Dimensions of Load Application
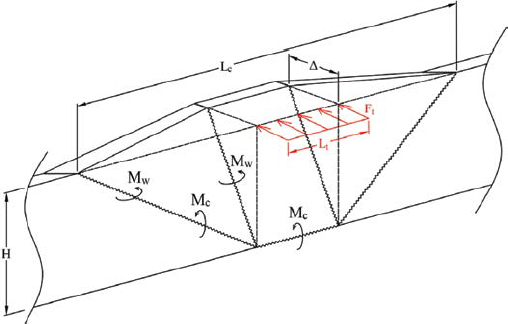
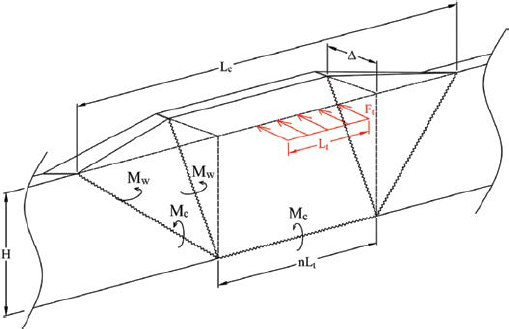
The computer simulation study performed by Bligh et al. (2017) yielded data regarding the manner in which impact loads are applied to the impacted barrier. Through simulated impacts, various TL-4 and TL-5 load application parameters were measured, including (1) the application height of lateral loads, (2) the longitudinal distribution of lateral forces, and (3) the longitudinal distribution of vertical forces. Additionally, a TL-3 lateral load application height was extracted from impact simulations performed by Silvestri-Dobrovolny et al. (2017). Descriptors of the load application are presented in Table 35. No alternative values have been proposed for TL-1, TL-2, or TL-6. As for impact load magnitudes, the footprint dimensions proposed by Bligh et al. (2017) vary with barrier height due to variable engagement between the cargo box and the barrier. Table 35 presents the binary relationship recommended by Bligh et al. (2017). However, a more detailed relationship between load application dimensions and barrier height is demonstrated in Tables 6 and 7.
Although the impact severities associated with MASH criteria are much higher than those of the preceding standards, no new trends in barrier inadequacy have been noted. If impact forces alone were considered, this trend may be expected. However, impact load application heights proposed in contemporary research are nearly universally lower than those currently suggested by AASHTO LRFD BDS guidance. Additionally, current guidance recommends that lateral loads are applied at the top of the barrier, rather than at He. Instead, He is used only for stability evaluations. As such, current barrier design practices neglect the reserve capacity resulting from impact loads applied lower than the full barrier height, thus resulting in overdesigned barriers that can resist not only the preceding design forces but the increased proposals as well. A more detailed discussion of the relationship between barrier capacity and impact load application height is presented in Chapter 2.
Table 35. Proposed load application dimensions (Bligh et al. 2017).
| Design Parameter | Railing Test Level | ||||
|---|---|---|---|---|---|
| TL-3 | TL-4-1 | TL-4-2 | TL-5-1 | TL-5-2 | |
| Barrier Height, H (in.) | 29 | 36 | >36 | 42 | >42 |
| Height of Lateral Load Application, He (in.) | 19 | 25 | 30 | 34 | 43a |
| Longitudinal Distribution of Lateral and Longitudinal Loads, Lt or LL (ft) | — | 4 | 5 | 10 | 10 |
| Longitudinal Distribution of Vertical Loads, Lv (ft) | — | 18 | 18 | 40 | 40 |
aIf H > 54 in., He = 52 in.
Concrete Bridge Rails
Solid concrete barriers are the most common type of bridge rail system. As such, substantial research has been performed regarding these systems since the implementation of current AASHTO LRFD BDS guidance. These efforts have culminated in modifications to the current yield-line method and an additional capacity check addressing punching shear failure.
Modifications to the Yield-Line Method
Current AASHTO LRFD BDS guidance recommends that concrete barriers are evaluated using the yield-line method proposed by Hirsch (1978). This method, discussed in Chapter 2, is underpinned by three primary assumptions: (1) the yield-line mechanism follows a V-notch pattern, (2) the barrier is rigid, and (3) the lateral impact load is applied at the top of the barrier. Contemporary investigations into these assumptions have yielded modifications to the current yield-line method outlined in AASHTO LRFD BDS guidance.
Trapezoidal Failure Mechanism
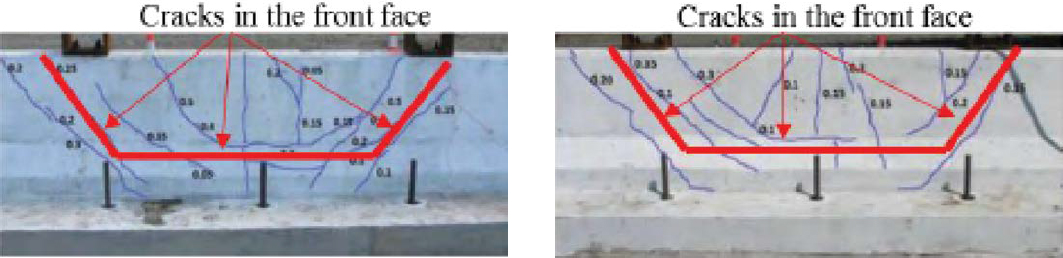
The V-notch failure pattern described in AASHTO LRFD BDS, though generally accepted since 1978, has not proven to be a realistic mechanism. This mechanism is rarely, if ever, observed in static testing, full-scale crash tests, computer simulations, or field impacts (Frosch and Morel 2016). In response to this disparity, an alternative, trapezoidal yield-line mechanism was proposed by Jeon et al. (2008) and has since been further investigated by Khederzadeh and Sennah (2014) and Cao et al. (2019).
Each of these studies produced a yield-line mechanism with traffic-face yield lines in the shape of a trapezoid. However, each mechanism is slightly different: (1) the Jeon mechanism, the first of its kind, is characterized by vertical yield lines on the back of the barrier and a base width of Lt, (2) the mechanism proposed by Khederzadeh and Sennah included variability in the length of the trapezoid base, and (3) the Cao mechanism assumes the yield-lines on the back of the barrier angle inward opposite those on the front of the barrier. The Jeon, Khederzadeh, and Cao mechanisms are demonstrated in Figures 199, 200, and 201, respectively.
The Jeon mechanism is identical to the mechanism proposed by Khederzadeh and Sennah, but the latter allows the length of the lower, horizontal yield line to vary as a function of Lt. Alternatively, the Cao mechanism features a slightly different failure pattern. In Cao’s derivation, the yield lines on the nonimpact face of the barrier extend inward at an angle, rather than

directly upward. With this assumption, both the vertical-axis and longitudinal-axis bending strengths participate along the interior yield lines rather than the vertical-axis bending strength only. Due to the inclusion of both directional bending strengths along the interior yield lines, Cao’s mechanism consistently produces the greatest barrier capacity estimates. The increase in strength from Jeon’s equation to Cao’s equation can be clearly observed in a direct comparison by generalizing the two equations:
| (101) |
where α is the angle formed between the deck surface and the diagonal yield lines. In Jeon’s equation, c1 is equal to 4, and c2 is equal to 2 (Jeon et al. 2008). Alternatively, in Cao’s equation, c1 is equal to 2, and c2 is equal to 6 (Cao et al. 2019). As such, Cao’s equation will result in higher capacities unless Mw is drastically larger than Mc.
The angle at which diagonal yield lines extend from the deck is uncertain and varies between the proposed mechanisms. By minimizing the general capacity estimate, Jeon et al. (2008) produced a relationship between the yield-line angle and the directional capacities of the barrier
| (102) |
indicating that, as Mc is increased, the critical length decreases, and as Mw is increased, the critical length increases. Alternatively, Cao et al. (2019) assumed that α is equal to 45°.
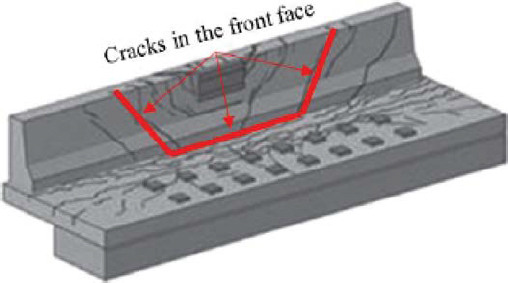
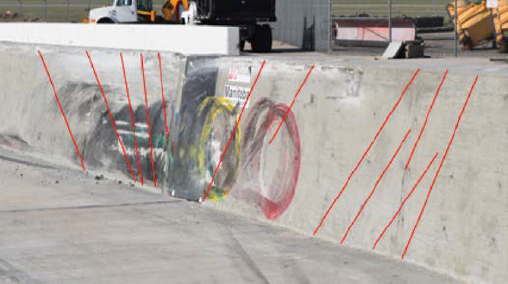
Throughout the refinement of the modified yield-line method, laboratory experiments have been performed in which the trapezoidal failure shape has been observed (Ahmed, Dulude, and Benmokrane 2013; Namy et al. 2015). Some of these experiments are shown in Figures 202 and 203. Additionally, the trapezoidal failure shape has been observed in several full-scale crash tests and was particularly prevalent in a full-scale crash test performed by MwRSF on a TL-5, single-slope concrete bridge rail (Rosenbaugh et al. 2016). Damage sustained by the barrier in this test, with cracks highlighted for visibility, is shown in Figure 204. The trapezoidal cracking pattern was also noted in a full-scale crash test of a GFRP-reinforced concrete parapet, shown in Figure 205 (Sennah et al. 2018). While the trapezoidal cracking pattern on the impact face is common and evident in a multitude of barrier tests, damage patterns on nonimpact faces are inconclusive and favor neither the vertical yield lines proposed by Jeon et al. (2008) and Khederzadeh and Sennah (2014) nor the inverted trapezoid proposed by Cao et al. (2019).
In sum, the trapezoidal failure mechanism is significantly in better agreement with experimental and field impact observations. Three mechanisms have been proposed, all of which consistently produce higher capacity estimates than current AASHTO LRFD BDS guidance. However, the yield-line orientation is inconsistent between the methods, and the positioning of the interior yield lines described in the methods does not coincide with physical testing observations. As such, further investigation is required to determine the validity of these alternative yield-line mechanisms.
The methods proposed for AASHTO LRFD BDS Section 13 are based on the proposed modified trapezoidal yield-line methods by Jeon et al. (2008) and Khederzadeh and Sennah (2014), primarily due to their simplicity, and they were deemed to be more familiar to users of the V-notch yield-line method in the current AASHTO LRFD BDS.
Inertial Activation
When a concrete barrier is impacted by a vehicle, the span of the barrier is sent into motion. This activation of barrier inertia would theoretically resist a portion of the lateral impact load. This behavior has been described in studies performed by Schrum et al. (2016) and Badiee (2014). Detailed descriptions of these methods are presented in Chapter 2.
Schrum et al. (2016) accounted for inertial activation by modifying the critical length used in the existing AASHTO LRFD BDS yield-line equation. The modified critical length is determined
via two assumptions: (1) barrier reinforcement reaches 6% strain, and (2) the length of barrier sent into motion is equal to the critical length. The governing relationship, from which the modified critical length can be numerically estimated, is
| (103) |
wherein L is the critical length, which is used to determine Rw using the current AASHTO LRFD BDS equation. Several observations bring into question the validity of this method. First, while Schrum et al. assumed 6% rebar strain, simulated static load tests performed by Cao et al. (2019) yielded rebar strain measurements of just 1%. Additionally, this method assumes that a block of concrete with length equal to L is set into translational motion. In reality, however, a V-notch section of the barrier is set into rotational motion. As such, the method proposed by Schrum et al. (2016) may account for too much barrier mass activation.
Similarly, Badiee (2014) accounted for mass activation, assuming that a block of concrete with length equal to Lt is set into motion during vehicular impact. Again, the entire section was assumed to be activated, rather than a reduced mass reflecting the actual yield-line pattern. In a departure from Schrum’s method, Badiee accounted for rotational activation by calculating the moment of inertia of the barrier and deck sections and increased the barrier capacity accordingly.
While inertial activation would dissipate impact energy and effectively increase barrier capacity, neither of these methods is appropriate for implementation in their current state. Actual mass activation reflecting yield-line patterns is neglected in favor of overestimates that result in unrealistic capacity increases. Even still, these increases are relatively minor when compared to other yield-line modifications, such as trapezoidal mechanisms and height modifications. Additionally, inertial activation methods are computationally tedious in light of the insignificant strength modifications they yield.
Effect of Impact Height on Barrier Capacity
All yield-line mechanisms, both in existing AASHTO LRFD BDS guidance and proposed in contemporary research, are predicated on the assumption that the lateral impact load is applied at the top of the barrier. However, as suggested by Silvestri-Dobrovolny et al. (2017) and by the adequacy of existing barriers under increased load estimates reflecting MASH criteria, barrier capacity increases with decreasing impact height. Theoretically, the product of deflection and barrier height is equal along the barrier height, as demonstrated in Figure 206. As such, the flexural capacity of a concrete barrier can be determined by scaling the result of the yield-line capacity equation, Rw, using Equation 104. The relationship presented in Equation 104 was achieved by applying the impact load at a height lower than the top of the barrier in the traditional yield-line formulation and adjusting the derivation accordingly. The relationship between impact height and barrier capacity is explained in further detail in Chapter 2. This relationship likely applies to metal post-and-beam systems, as well, though this suggestion requires further investigation.
| (104) |
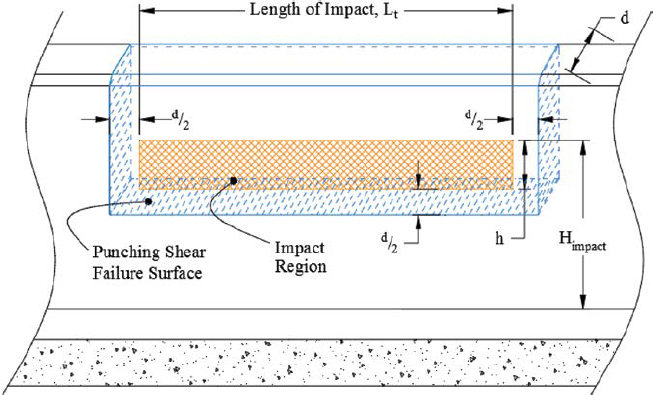
Punching Shear Capacity
Punching shear failure of a concrete barrier is characterized by the formation of a rectangular failure plane through the concrete that is irrespective of reinforcement. Punching shear capacity
is based entirely upon the thickness of the barrier, the concrete strength, and the load application footprint. A demonstration of interior punching shear is shown in Figure 207, and a more detailed discussion of the failure mode is presented in Chapter 2.
Punching shear failure of concrete barriers is not addressed in current AASHTO LRFD BDS guidance. However, this behavior has been well-documented in contemporary research and is thought by some to be the controlling limit state for concrete barriers. Alberson et al. (2005) suggest that the damage patterns observed in a static load testing series were more consistent with punching shear than flexure. Further, clear punching shear failures of solid and open concrete bridge rails were observed by Williams, Buth, and Menges (2007) in both static and dynamic tests conducted at interior and exterior rail locations. Most recently, Frosch and Morel (2016) conducted static load testing of bridge rail specimens of varying lengths and concluded that punching shear governs failure for continuous spans greater than 30 ft. Additionally, Frosch and
Morel suggested that punching shear failure is more consistent with field observations of barriers impacted in actual accidents. An example of an apparent punching shear failure is shown in Figure 208. Punching shear failures are primarily identified by evidence of brittle failure and cracks on the top face of the barrier fanning outward at 45°.
ACI 318-19 presents three equations for determining the punching shear strength of a concrete slab (ACI 2019). Each equation is of the form
| (105) |
where λ is the lightweight concrete factor, bo is the critical perimeter, d is the average depth of the slab in the shear region, λs is a size effect factor that penalizes shear strength for slabs thicker than 10 in., and K is a shear strength modifier reflecting the geometry of the load application area. ACI 318-19 suggests that K varies between 2 and 4, corresponding to the one-way and two-way shear strength of concrete, respectively. As the load application area becomes more slender, K approaches its minimum value of 2. As such, assuming a K value of 2 is conservative for bridge rail applications, as the height of the impact load application footprint is not well-documented. The punching shear strength of concrete barriers, then, can conservatively be estimated as
| (106) |
where bo is calculated according to ACI 318-19 Article 22.6.4. The contribution of vertical and longitudinal steel strength to the punching shear capacity is only permitted by ACI if certain requirements are met. ACI 318-19 states that, in order for steel perpendicular to the load to be accounted for in the calculation, the slab must be at least 6 in. deep and at least 16 times as deep as the shear reinforcement bar diameter (ACI 2019).
It should be noted that AASHTO LRFD BDS Section 13 currently presents a punching shear capacity equation. This equation is used to estimate the capacity of bridge deck overhangs to resist punching shear forces exerted by post-to-deck connections. However, although it is applied to deck overhangs, the equation is equivalent to Equation 106, except for the size effect factor and a unit conversion from pounds to kips.
Design Comparisons
The capacities of three concrete bridge rail systems were calculated with each proposed method described herein to compare the results to the existing, traditional yield-line method in AASHTO LRFD BDS guidance. Due to the relative complexity of the method and the reliance
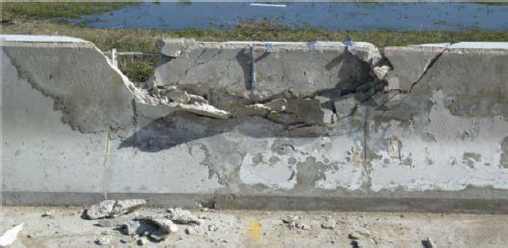
Table 36. Comparison of proposed concrete barrier design methods.
| Barriera | Traditional YLM (kips) | Trapezoidal YLM (kips) | Inertial Activation (kips) | Height Scalingb (kips) | Punching Shear (kips) | |||
|---|---|---|---|---|---|---|---|---|
| Jeon et al. (2008) | Khederzadeh and Sennah (2014) n = 2c | Khederzadeh and Sennah (2014) n = 0.5c | Cao et al. 2019 | |||||
| A | 48.9 | 57.0 | 114.2 | 67.7 | 70.4 | 50.7 | 69.7 | 38.7 |
| B | 49.0 | 54.3 | 134.5 | 76.2 | 89.7 | 57.1 | 70.6 | 55.7 |
| C | 124.3 | 170.5 | 285.7 | 256.3 | 149.5 | — | 153.3 | — |
aBarrier A: Jacksonville Skyway Barrier (Loken et al. 2019); B: TL-4 New Jersey safety shape rail; C: TL-5 vertical wall.
bTL-2, TL-4, and TL-5 impact heights were used for barriers A, B, and C, respectively.
cn is a coefficient applied to Lt defining the length of the horizontal yield line (Khederzadeh and Sennah 2014).
on deck conditions, the flexibility method proposed by Badiee (2014) was not included in this comparative study. It should be noted that these capacity estimates are for comparison purposes only and do not reflect the accuracy of any method. Instead, this brief investigation serves to show the magnitude of estimates produced by each method with respect to the existing yield-line method.
Three bridge rail systems were chosen to reflect various heights and test levels. The evaluated systems were (1) a vertical parapet used on the Jacksonville Automated Skyway Express, which is comparable to a TL-2 system; (2) a 36-in. New Jersey safety shape rail; and (3) a TL-5 vertical parapet. These systems were evaluated using the existing yield-line method, each of the proposed trapezoidal yield-line mechanisms, the inertial activation method, impact height scaling, and the punching shear limit state.
Calculated barrier capacities are presented in Table 36. Additionally, to more clearly compare the alternative methods to the existing yield-line method, capacities are presented as percentages of the traditional yield-line method estimate in Table 37.
The results of this comparison indicate significant potential reserve strength in barriers designed using the existing yield-line method. For each barrier, each alternative analysis method
Table 37. Comparison of proposed concrete barrier design methods as percent of the yield-line method (YLM) result.
| Barriera | Traditional YLM (%YLM) | Trapezoidal YLM (%YLM) | Inertial Activation (%YLM) | Height Scalingb (%YLM) | Punching Shear (%YLM) | |||
|---|---|---|---|---|---|---|---|---|
| Jeon et al. (2008) | Khederzadeh and Sennah (2014) n = 2c | Khederzadeh and Sennah (2014) n = 0.5c | Cao et al. (2019) | |||||
| A | 100 | 117 | 234 | 138 | 144 | 104 | 143 | 79 |
| B | 100 | 111 | 274 | 156 | 183 | 117 | 144 | 114 |
| C | 100 | 137 | 230 | 206 | 120 | — | 123 | — |
aBarrier A: Jacksonville Skyway Barrier (Loken et al. 2019); B: TL-4 NJSS; C: TL-5 Vertical Wall.
bTL-2, TL-4, and TL-5 impact heights were used for barriers A, B, and C, respectively.
cn is a coefficient modifier applied to Lt defining the length of the horizontal yield line (Khederzadeh and Sennah 2014).
produced greater capacity estimates than the existing yield-line method. However, if reserve flexural strength is available, it becomes more likely that punching shear will govern the failure of concrete barriers. Punching shear must be addressed independently, as design modifications that would increase the flexural strength of a barrier do not necessarily affect the punching shear strength. From the design perspective, punching shear strength is a function of only the lateral barrier depth and the specified compressive strength of the concrete, as the designer does not have control over the load application footprint and, in turn, the critical perimeter.
It should be noted that the methods described above are independent and can be used alone or in combination. For example, height scaling and inertial activation methods could be applied simultaneously with a trapezoidal yield-line mechanism. However, the three trapezoidal yield-line methods are mutually exclusive.
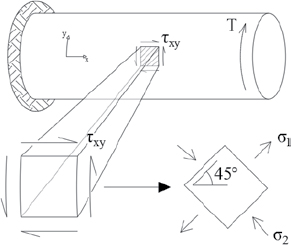
Potential Torsional Failure Mechanisms
Although no studies have been performed to investigate a torsional limit state for concrete barriers, damage patterns observed in physical tests indicate potential torsional failures. When an element is subjected to pure torsion, tensile and compressive principal stresses act along 45° seams throughout the element. This behavior is demonstrated in Figure 209.
Were the element depicted in Figure 209 composed of concrete, cracking along the tensile seams would be expected. The torsional failure mechanism, then, would manifest as a 45° tensile crack penetrating from the free end of the element to the fixed end. Theoretical behavior of a rectangular concrete element subjected to pure torsion is shown in Figure 210.
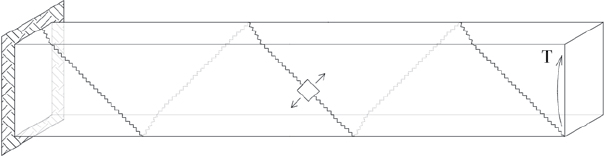
The cantilevered concrete element can be modified to produce a model roughly analogous to the free end of a concrete barrier. To reflect the barrier anchorage, the lower face is fixed; to reflect the impact load, a force is applied at the free corner. The modified system representing a concrete barrier subjected to vehicle impact is shown in Figure 211.
Although not explicitly investigated in any research effort, damage consistent with a torsional failure mechanism was observed in a dynamic test performed by Williams, Buth, and Menges (2007). The damage pattern, shown in Figure 212, is anomalous if analyzed considering a yield-line
failure mechanism, which would have predicted a line of crushing failure extending down and to the left from B on the back face. However, the pattern is in reasonable agreement with the mechanism depicted in Figure 211. The traffic-face crack extends upward at roughly 45° (shown in Figure 212a and Figure 212b, A-B), traverses across the top face of the barrier at roughly 45° (shown in Figure 212a, passing through B), and travels down the back of the barrier in the same direction (shown in Figure 212c, B-C).
Additionally, a failure mechanism highly consistent with free-end torsional failure was observed in full-scale crash testing performed by Williams, Bligh, et al. (2015) on the Lake Pontchartrain retrofit bridge rail. The cracking pattern is shown in Figure 213. The barrier sustained significant damage, and analysis of the crash-test footage indicated that the diagonal crack on the rear face formed at the onset of structural failure.
For interior conditions in which the barrier is effectively fixed on either end by virtue of its mass and cumulative anchorage, the torsional failure mechanism would differ from that at the free end. A potential, simplified torsional failure mechanism for an interior span is demonstrated in Figure 214. A comparison of this failure mechanism to the modified, trapezoidal yield-line mechanism reveals a strong similarity between the two cracking patterns. As such, distinguishing a torsional failure mechanism from a flexural mechanism may be difficult, especially if the two occur simultaneously.
This analysis, though preliminary and qualitative, is informed by the review of dozens of concrete cracking patterns from physical testing. It is believed that torsional failure mechanisms for concrete barriers should not be neglected and may warrant further investigation.
FRP-Reinforced Concrete Bridge Rails
GFRP reinforcement is more elastically flexible than steel but also nonductile. Yield-line analysis is therefore not applicable to GFRP-reinforced barriers. Matta and Nanni (2009)

proposed a GFRP-reinforced open concrete rail design accounting for the mechanical behavior and limitations inherent to GFRP. A GFRP-reinforced open concrete rail was designed and crash tested according to NCHRP Report 350 test designation 3-11 (Buth et al. 2003). The barrier exhibited only minor damage. However, design calculations were not included in the report, and it is unclear to what degree the barrier may have been overdesigned. Additionally, one test was performed with a steel tube mounted to the top of the concrete rail. It is unclear to what extent the steel tube may have participated in load redistribution along the length of the rail. A GFRP-reinforced solid barrier was designed and crash tested according to MASH TL-5 (Sennah and Hedjazi 2019; Sennah and Mostafa 2018), but the barrier capacity was governed by punching shear rather than flexural capacity (Sennah et al. 2018). Literature is not available to substantiate GFRP-reinforced barrier performance during MASH crash testing for barriers limited by flexural capacity.
Other Bridge Rails
In this review, several studies were identified that describe bridge rail practices not currently addressed in existing AASHTO LRFD BDS guidance. These systems include flexible guardrail systems and bridge rails secured to MSE walls. Additionally, miscellaneous studies were identified that address shortcomings of and updates to the current guidance, including the treatment of rail terminals, pedestrian and bicycle railings, and improved safety practices for motorcycle impacts.
Flexible Bridge Rails
Flexible bridge rail systems, which are discussed in detail in Chapter 2, are guardrail-like systems that undergo significant deformation when impacted. Examples are shown in Figure 215. Flexible bridge rails are not addressed in current AASHTO LRFD BDS guidance. However, academic and practical interest in these systems is growing, as they do not require transitions from compatible approach rails and limit damage to the bridge deck.
Flexible bridge rails cannot be designed using the inelastic method for rigid post-and-beam systems. The strength of these systems is owed mainly to the tensile membrane action of the W-beam or thrie beam rather than the bending strength of the posts, thus rendering the inelastic method obsolete. Using the inelastic method to design a flexible system will result in a severe
underestimate of strength. As demonstrated in MASH-compliant TL-2 and TL-3 systems produced by Thiele et al. (2010), Williams, Bligh, et al. (2016), and Rosenbaugh et al. (2019), the design of flexible systems is largely based on experience and the proportioning of previously crash-tested systems. Additionally, computer simulation software, such as LS-DYNA, can aid in the design process of flexible systems. Theoretical evaluations play a lesser role in the design of flexible systems when compared to rigid systems. No formal design equations exist for these systems.
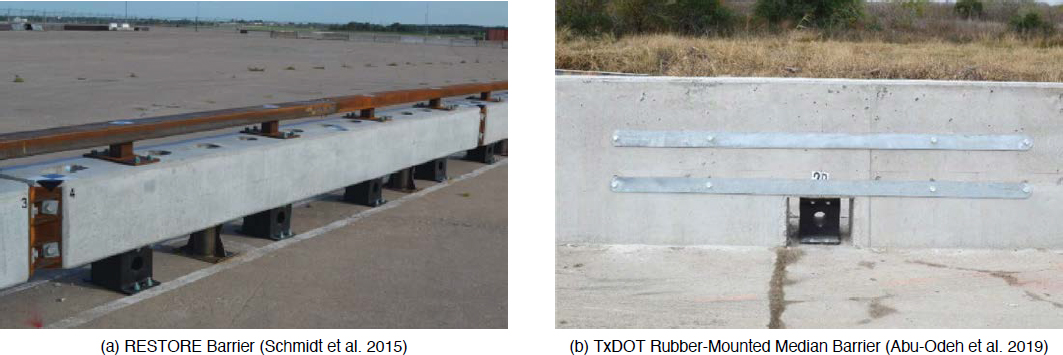
An alternative type of flexible barrier system involves the use of rubber shear fenders, which allow for significant deformation of otherwise rigid barriers. Examples of this barrier type include the RESTORE barrier developed at MwRSF (Schmidt et al. 2015) and the TxDOT rubber-mounted, single-slope median barrier developed at TTI (Abu-Odeh et al. 2019). The designs of these systems are shown in Figure 216.
Bridge Rails Secured to MSE Walls
It is common practice for bridge rail systems to be installed over MSE walls. However, this practice is not addressed in AASHTO LRFD BDS Section 13. The design of bridge rail systems installed on MSE walls is described in AASHTO LRFD BDS Section 11 and has been recently refined in two extensive studies performed by Bligh et al. (2017; 2010). References to other sections are common in AASHTO LRFD BDS. As such, it is believed that, while the design of these systems is outside of the scope of AASHTO LRFD BDS Section 13, mention should be made of the design practices found in AASHTO LRFD BDS Section 11. Bridge rail systems secured to MSE walls are discussed in further detail in Chapter 2.
Transitions and End Treatments
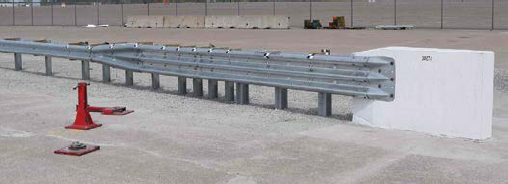
Most bridge rail systems are significantly stiffer than the guardrail systems that approach them. As such, approaching guardrail systems cannot be connected directly to the bridge rail terminal. Such a practice would result in risks of pocketing and extreme decelerations of an impacting vehicle. Instead, transition systems are installed between approaching guardrail and bridge rail terminals to provide a gradual transition of stiffness between the disparate systems. An example of a transition between a flexible guardrail and a rigid bridge rail is shown in Figure 217. If an approach guardrail system is not provided, the free end of the bridge rail can be shielded with an impact attenuator or crash cushion.
Current AASHTO LRFD BDS guidance requires end treatments in high-speed rural areas only. AASHTO’s RDG, however, suggests that all transitions between semi-rigid and rigid systems should be treated, regardless of locale (AASHTO 2011). Untreated ends of rigid bridge rail systems are likely to cause serious injury in the event of an impact.
Pedestrian and Bicycle Railings
Pedestrian and bicycle railings protect bridge walkway users from dangerous conditions adjacent to or underneath the bridge structure. Current AASHTO LRFD BDS guidance stipulates height and strength requirements for pedestrian and bicycle railings.
No changes to the height or strength requirements for pedestrian rails have been proposed. However, for a pedestrian rail to be considered ADA-compliant, inclusion of a supplementary handrail with a top edge height between 34 in. and 38 in. would be required (U.S. DOJ 2010). Additionally, the top rail of the handrail must meet certain geometric criteria described in Chapter 2.
Alternatively, a new required height for bicycle railings was proposed by Lewendon et al. (2004) in NCHRP Project 20-7(168). Informed by data regarding the height of the center of mass of bicycle riders and surveys of state DOTs, European agencies, and bicycle advocacy groups, Lewendon et al. proposed a height requirement of 48 in. The existing height requirement in AASHTO LRFD BDS guidance is 42 in., though the requirement has been as high as 54 in. in past versions of the document. Additionally, Lewendon et al. described high-risk scenarios in which a 54-in. rail height would be appropriate.
Motorcycle Considerations
Motorcycles engage roadside safety hardware in a manner unique from traditional passenger vehicles. Impacts between motorcycles and roadside barriers can be separated into two categories: (1) the motorcyclist impacts the barrier in an upright position, potentially vaulting over the barrier, and (2) the motorcyclist impacts the barrier while sliding on the roadway surface. These categories of impact are addressed with separate solutions.
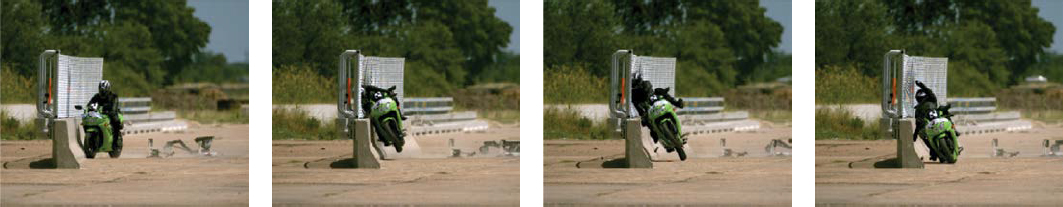
To address the first category of impact in which the motorcyclist is upright at the point of impact and at risk of vaulting over the barrier, Silvestry-Dobrovolny et al. (2019) developed a motorcycle containment system. Capable of attachment to existing concrete barriers, the system is composed of inset metal bars to which a chain link mesh is secured. The system, shown in Figure 218, was crash tested in 2019 with promising results; measured head accelerations of the surrogate rider were within acceptable limits. The system still requires full-scale crash testing with MASH test vehicles to ensure it does not create a snagging hazard.
Several European agencies have designed hardware to address the second category of impact in which the motorcyclist impacts the barrier while sliding on the roadway surface. These solutions are summarized in an overview provided by EuroRAP (2008) and are discussed in greater detail in Chapter 2. Solutions include under-rails to prevent impact with posts; crash cushions installed at each post; and alternative post designs featuring rounded, less harsh geometry.
Bridge Deck Overhangs
The design of the deck overhang to which the bridge rail system is secured is a crucial design aspect. Bridge owners may prefer to limit damage to bridge rails and avoid repairing damaged decks after a vehicle impact. Furthermore, for the expected strength of the bridge rail system to be achieved, the overhang must have sufficient strength to confine failure modes to the barrier. Deck overhang parameters affecting bridge rail behavior include thickness, reinforcement, anchorage design, and material.
Design Case Guidance
Current AASHTO LRFD BDS guidance specifies three design cases by which deck overhangs must be analyzed. These cases address the variety of demands to which deck overhangs are subjected and include (1) transverse and longitudinal forces developed in vehicle impacts with bridge rail, (2) vertical forces developed in vehicle impacts with bridge rail, and (3) vehicle wheel loads occupying the overhang region. Cases 1 and 2 are directly related to the bridge rail system and are addressed in this review. A detailed discussion of these design cases is presented in Chapter 2.
Current AASHTO LRFD BDS gives little guidance on how these design cases should be applied. Contemporary research has described this application in greater detail. In an investigation of bridge deck overhang design, Frosch and Morel (2016) provided additional guidance for applying the design cases found in current AASHTO LRFD BDS guidance. Frosch and Morel proposed that, for Design Case 1, two critical sections should be evaluated: (1) the deck section coincident with the face of the rail and (2) the deck section coincident with the critical girder section, where the critical girder section is determined in AASHTO LRFD BDS Article 4.6.2.1.6 (AASHTO 2020a). For example, the critical section of a precast I-shaped concrete beam is one-third of the flange width inset from the outer face of the flange. Alternatively, for Design Case 2, the deck section coincident with the rail face does not require flexural analysis, as the vertical impact force acts at a very small moment arm.
Decks Supporting Solid Concrete Bridge Rail
Solid concrete bridge rails are secured to bridge decks along a continuous face. As such, when an errant vehicle impacts a solid concrete bridge rail, impact forces penetrate downward into
the barrier, eventually reaching the deck and exerting distributed shear and flexural demands on the overhang. To properly design a solid concrete bridge rail system, the manner in which impact forces travel through the barrier and into the deck must be carefully considered.
Current AASHTO LRFD BDS guidance suggests that lateral barrier forces distribute outward at 45° as they travel downward toward the deck. This assumption is used to calculate the lateral deck tension which, in conjunction with the slab design moment, Ms, is used to design the deck overhang. It is recommended that Ms is equal or greater to the cantilever moment capacity of the barrier, Mc, at the base of the barrier. It is important to note that this design practice can result in significantly overdesigned deck overhangs if the barrier itself is overdesigned.
While current AASHTO LRFD BDS guidance states that the slab “may be” designed for the full barrier cantilever moment at its base, experiments performed by Alberson et al. (2005) indicate that this practice is unnecessarily conservative. In three static load tests performed on full-scale bridge rail specimens, it was concluded that overhang slab capacities as low as 0.45Mc are sufficient to develop the full barrier strength. Additionally, several full-scale crash tests have been performed in which the deck strength was significantly lower than the cantilever bending capacity of the barrier. These tests are summarized in Table 38.
The ratio of Mw to Mc is expected to affect the acceptable deck overhang strength. As Mw decreases relative to Mc, more of the impact demand must be accepted by the vertical reinforcement. As such, the demand on the deck increases. Additionally, the stiffening effect of the bridge rail on the deck edge could also affect the acceptable ratio of deck-to-barrier strength. As a result of these complexities and the sparseness of available data in literature, it is not possible to quantify an acceptable ratio of deck-to-barrier strength that would be adequate for all systems at this time.
An alternative design philosophy has grown in popularity with state DOTs and roadside safety agencies. In this philosophy, a lateral force is used to determine the flexural demand in the deck. Multiple versions of this method exist; some use the lateral capacity of the barrier, Rw, whereas others use a factored impact load, βFt.
Table 38. Summary of tests performed on decks with less flexural capacity than barrier.
| Specimen | Test | Test Level | Rw (kips) | Failure Strength (kips) | Deck Damage | |
| F-Shape Barrier (Alberson et al. 2005) | Static | 4 | 73 | 0.74 | 64 | Minor cracking |
| F-Shape Barrier (Alberson et al. 2005) | Static | 4 | 104 | 0.74 | 104 | None |
| F-Shape Barrier (Alberson et al. 2005) | Static | 4 | 104 | 0.45 | 104 | Minor cracking |
| Optimized Concrete Rail (Rosenbaugh 2019) | Full-scale | 4 | 80 | 0.91 | — | None |
| Manitoba Tall Wall (Rosenbaugh et al. 2016) | Full-scale | 5 | 199 | 0.85 | — | Hairline cracking |
| F-shape Barrier (Rosenbaugh et al. 2016) | Full-scale | 5 | — | 0.85 | — | None |
| Vertical Parapet (Rosenbaugh et al. 2016) | Full-scale | 5 | 200 | 0.71 | — | None |
| Open Concrete Rail (Rosenbaugh et al. 2016) | Full-scale | 5 | 211 | 0.47 | — | Minor spalling |
NOTE: — = not available.
The Washington State Bridge Design Manual (WSDOT 2019) from WSDOT documents the use of this technique. WSDOT recommends that the design moment is determined as the moment produced by the flexural resistance of the barrier acting at the full barrier height distributed at a 45o fanning angle. Additionally, WSDOT provides flexure and tension design values at end segments. This method is similar to the current AASHTO LRFD BDS method, as it employs the resistance of the barrier but accounts for the overall resistance of the barrier rather than Mc alone. However, this practice could likewise result in overdesigned deck overhangs if Rw is far in excess of Ft.
Similarly, other state DOTs use a factored impact load, βFt, to estimate the deck overhang demand. Common load factors are 1.20 and 1.33. An unfactored (β=1) Ft was used to design an optimized TL-4 concrete bridge rail at MwRSF (Rosenbaugh 2019). In this design, the effective height proposed in NCHRP Web-Only Document 326 was used as the impact force’s moment arm, rather than the full height of the barrier (Bligh et al. 2017). This design philosophy resulted in a system with a deck overhang whose strength was 91% of the barrier strength. The system was tested to MASH TL-4 criteria, and the deck overhang sustained no apparent damage.
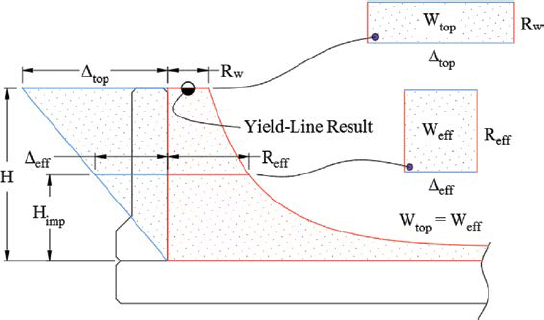
A rational approach would be to design the deck to sustain the actual moment that will be created in the impact event. Such an approach would require that decks be designed using the impact load, Ft, which is applied at the effective impact height, He, creating a moment that distributes according to Figure 219 or Figure 220. An overstrength factor, β, can be applied at
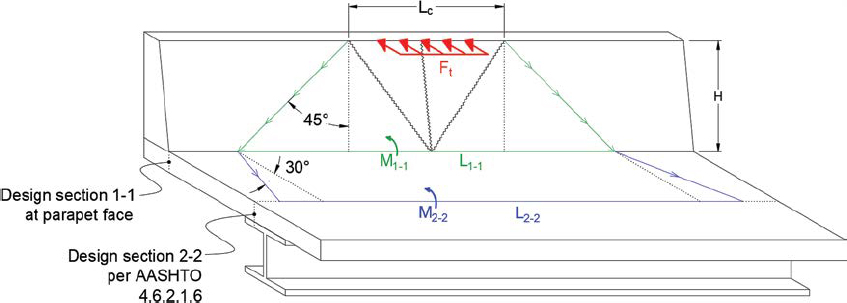
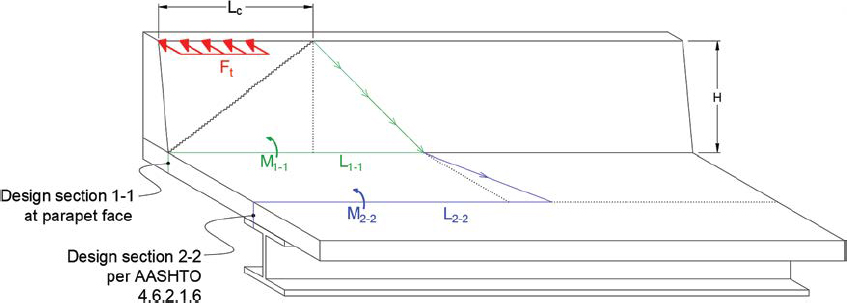
the designer’s discretion to capacity protect the deck overhang. To ensure safety, the capacity of the deck should not be permitted below a floor relative to the barrier’s cantilever bending capacity, Mc. The proposed design moment for the deck overhang at interior and end conditions is therefore as shown in Equation 107
| (107) |
where Ms′ is the required flexural capacity of the deck at interior (int) and end (end) regions, β is the overstrength factor applied to the impact force, Ft, which acts at an effective height, He. The moment created by the impact force is assumed to distribute at a 45° fanning angle outward from the extents of the critical length, Lc, for an additional distance equal to the height of the barrier, H. The demand should not be taken as less than αMc, where α ≤ 1 to establish a floor relative to the cantilever bending capacity of the barrier, Mc. The flexural demand acts coincident with an axial tension in the deck, T′, which is determined in Equation 108
| (108) |
which reflects the current AASHTO LRFD BDS guidance, except for the substitution of the barrier’s lateral force capacity, Rw, for the factored impact load. The flexural demand, Ms′, and the tensile demand, T′, must be considered at design sections 1-1 and 2-2.
The deck structure is significantly more expensive and difficult to repair than the railing system. As such, capacity protecting the slab and ensuring damage is isolated to the rail is an economical practice. Applying an overstrength factor, β, to the impact load or designing for the full Mc are techniques that would encourage failure in the barrier, rather than the deck. However, in cases where a new, MASH-compliant rail is to be installed on an existing deck, meeting the current AASHTO LRFD BDS capacity requirement of Mc may be difficult or impossible. In these situations, an aggressive design philosophy that removes the overstrength factor can be used. As noted previously, a MASH TL-4 concrete bridge rail was designed using Equation 107 with no overstrength factor and resulted in a successful design with no apparent damage to the deck.
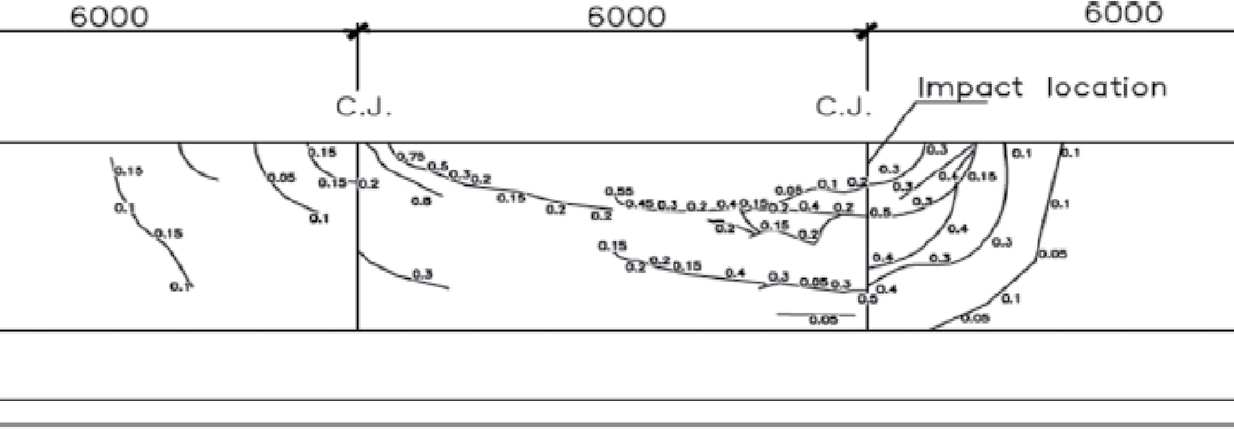
The preceding discussion considers the design of the parapet-face section under AASHTO LRFD BDS Design Case 1. For Design Case 2 in which the deck overhang is designed for vertical impact forces, Frosch and Morel (2016) recommend that only the overhang section coincident with the critical section of the supporting component is analyzed. This critical section depends on the type of component and is described in AASHTO LRFD BDS Article 4.6.2.1.6. Just as the behavior of impact forces as they travel downward through the barrier is important for Design Case 1, the manner in which forces distribute as they travel inward through the overhang is important for Design Case 2. The PCI Bridge Design Manual (PCI 2014) recommends a distribution angle of 30°. However, Frosch and Morel (2016) suggest that some designers use a distribution angle of 45°. These force transmission patterns are demonstrated in Figures 219 or Figure 220. A rudimentary simulation was performed in LS-DYNA to validate the load transmission pattern. The simulation in which a 40-ft, linear elastic concrete bridge rail and deck system was impacted with a dynamic load, is shown in Figure 221. Contours correspond to tensile deck force intensity. Moment demands measured in this simulation suggest that the length of deck engaged in an impact event is even longer than represented in Equation 107; moment demands on the expected engaged length at design section 2-2 were just 33% of the theoretical value (Ft * He). This finding is substantiated by those of Frosch and Morel (2016), which indicated that lengths of deck in excess of 10 Lt can participate in resisting impact loading.
The proposed design philosophy can be demonstrated through brief case studies of the TL-4 optimized concrete bridge rail designed and tested in 2019 (Rosenbaugh 2019) and the TL-5 Manitoba concrete bridge rail designed and tested in 2016 (Rosenbaugh et al. 2016). These case studies are summarized in Table 39. A load (overstrength) factor, β, of 1.0 is used in these examples.
The TL-4 optimized bridge rail was designed using the load-based design moment, Ms′, of 7.1 k-ft/ft, consistent with Equation 107. In the full-scale crash test of the system, the deck experienced negligible damage, indicating that a weaker deck may have still been sufficient.
Alternatively, the TL-5 Manitoba tall wall was not designed using the load-based design moment. Instead, it was designed to achieve an Ms-to-Mc ratio of 0.85. The deck experienced minimal damage in a full-scale crash test. In this case, had the load-based philosophy been used with β = 1, the ratio of the deck capacity to the barrier capacity would have been 1.0.
These case studies demonstrate the alternative deck design procedure informed by the literature and DOT practice. The results show a system, which was designed using the load-based procedure and whose deck capacity was lower than its barrier, being successfully crash tested with no damage to the deck overhang. Additionally, the results show a system designed using a prescribed ratio of Ms to Mc less than 1 performing successfully in a full-scale crash test.
Decks Supporting Post-and-Beam Bridge Rail
Deck overhangs supporting post-and-beam bridge rails are designed with a philosophy different from that of decks supporting solid parapets. These decks are subjected to more concentrated vertical and lateral loads at post landings. As such, current AASHTO LRFD BDS guidance addresses punching shear failure of the overhang in addition to concentrated moment demands.
Table 39. Deck design case studies.
| System | Rw (kips) | Mw (k-ft) | Mc (k-ft/ft) | Ms (k-ft/ft) | Deck Damage | M′w (k-ft/ft) | Ms,min (k-ft/ft) | ||
| TL-4 Optimized Concrete Rail | 80a | 13.9 | 7.7 | 7.0 | 0.91 | None | 7.1 | 0.92 | 5.4 |
| TL-5 Manitoba Tall Wall | 266b | 39.1 | 58.3 | 49.5 | 0.85 | Hairline cracking | 58.2 | 1.00 | 40.8 |
aBarrier capacity was adjusted for height consistent with Equation 104.
bBarrier capacity was determined using traditional AASHTO method without height adjustment.
Arnold and Hirsch (1985) presented good design practices that provide increased deck overhang capacity and reduced deck damage in a full-scale load testing series performed at TTI. By altering standard overhang and rail designs and testing the designs to failure, Arnold and Hirsch identified details for deck overhangs supporting metal post-and-beam bridge rails and open concrete bridge rails resulting in more favorable behavior.
Modifications to metal post-and-beam systems resulting in improved behavior are as follows:
- Extending transverse steel nearer to the field edge of the deck slab.
- Increasing the number of longitudinal bars between the anchor bolts and the field edge of the deck slab.
- Adding welded wire mesh underneath the posts.
- Enlarging the post anchor plate.
- Increasing the post edge distance.
- Increasing the deck slab thickness.
Modifications to open concrete rails resulting in improved behavior are as follows:
- Extending transverse steel nearer to the field edge of the deck slab.
- Increasing the post edge distance.
- Increasing the deck slab thickness.
- Adding additional longitudinal slab reinforcement about the deck-to-post joint.
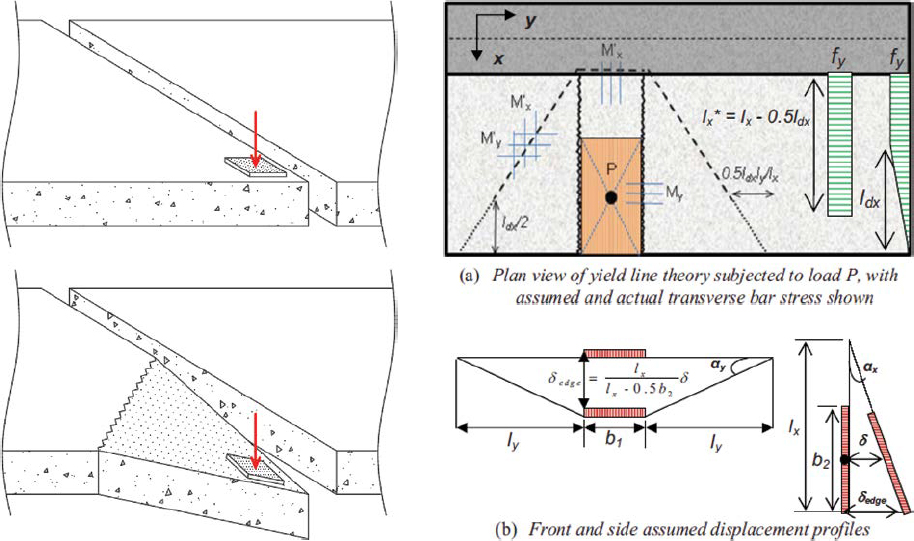
In current AASHTO LRFD BDS guidance, the deck overhang is viewed as a cantilever. Mander et al. (2011), however, suggest that it may be more appropriate to analyze the deck overhang as a two-way slab susceptible to yield-line mechanisms. Based on cracking patterns observed in load tests of deck overhangs (Mander et al. 2009; Trejo et al. 2008), Mander et al. (2011) proposed a yield-line method for bridge deck overhangs. The method, which is demonstrated in Figure 222, accounts for incomplete development of transverse deck bars as they approach the edge of the slab.
Accounting for Deck Flexibility
Two research efforts have been performed to analyze the effect of deck flexibility on the capacity of bridge rails: Badiee 2014; and Matta and Nanni 2009. Badiee (2014) incorporated deck flexibility into the traditional yield-line mechanism by reducing the overall external work done on the barrier by the strain energy absorbed in the cantilever bending of the deck overhang. This practice results in increased effective barrier capacity. Alternatively, Matta and Nanni (2009) incorporated deck flexibility into the lateral load-deflection response of a single post within a GFRP-reinforced open concrete rail. Both methodologies included determining the moment of inertia of the deck overhang and estimating the rotation of the overhang based on cantilever bending relationships and an assumed length of load distribution. Badiee (2014) assumed an application length of Lt; Matta and Nanni assumed an application length equal to the length of the post.
Both research efforts indicate that accounting for deck flexibility could increase the capacity of bridge rail systems. However, with only two investigations and no crash testing to validate the anticipated deck deflections, this topic is considered to be in its early stages and not yet sufficiently mature for inclusion outside of the commentary of the revised AASHTO LRFD BDS Section 13.
Bridge Rail Anchorage
A range of anchorage systems has been tested and implemented for various bridge rail systems. Cast-in-place concrete barriers are anchored to the deck via steel reinforcement. Alternatively, precast concrete barriers are fabricated with anchor plates or bolt sleeves for attachment to the deck. Similarly, metal post-and-beam systems are bolted to the deck with either top-mounted or side-mounted baseplates. A discussion of in-use anchorage systems is presented in Chapter 2.
Current AASHTO LRFD BDS guidance requires that the yield strength of anchor bolts for steel post-and-beam rails and precast concrete barriers is fully developed by bond, hooks, or attachment to embedded plates. For cast-in-place concrete barriers, embedment lengths sufficient for full development are required.
AASHTO LRFD BDS Section 13 provides no guidance on the actual design of anchorage systems or anchor bolts. Additionally, ACI 318-19, Chapter 17 (ACI 2019) limits its scope to exclude anchor bolts subjected to impact loading, resulting in a perceived information gap for designers utilizing AASHTO LRFD BDS Section 13 for anchor bolts. However, Dickey et al. (2012) demonstrated that ACI 318 provisions for anchoring to concrete result in very conservative strength estimates under dynamic loading, roughly on the order of 50% of the actual, as-tested strength. Using ACI 318 to design concrete anchors under impact loading is acceptable and likely to result in conservative designs. This approach is supported by AASHTO LRFD BDS Section 5.13 (AASHTO 2020a).
For decks of reduced thickness, achieving full development of reinforcement can be problematic. AASHTO LRFD BDS Section 5.10.8.2.4 and ACI 318-19 Article 25.4.3.1 (ACI 2019) require hook development lengths specified in Equations 109 and 110, respectively. Both requirements establish an absolute minimum embedment length of 6 in. irrespective of bar diameter.
| (109) |
| (110) |
where [psi] is pounds per square inch; Ψe is a modification factor for epoxy coating; Ψr is a modification factor for confining reinforcement; Ψo is a modification factor for location; abd Ψc is a modification factor for concrete strength.
Decks of thicknesses less than 6 in. that are cast over precast concrete box beams, then, cannot provide full development for barrier anchor bars. Similarly, decks with a free bottom face with thicknesses less than 7.5 in. or 8 in. cannot provide full development and meet cover requirements for no. 5 and no. 6 anchor bars, respectively. AASHTO LRFD BDS Section 13 requires that full development of anchor bars is achieved, indicating a significant design hurdle for decks of reduced thickness.
Arrington et al. (2011) conducted a full-scale crash test to MASH TL-3 criteria on an open concrete rail with anchor bars embedded at only 5 in. The crash test was successful, and neither the deck nor the anchorage system showed visible damage. As such, it was determined that the 5-in. embedment length was acceptable. The results of this test indicate that full development of anchor bars is not uniformly necessary to produce MASH-compliant systems.
Barrier Geometry
Various geometric characteristics of bridge rails independent of the strength or height of the system can have a significant effect on impact behavior. Parameters to consider include snag potential related to rail geometry; risk of impact between the vehicle occupant’s head and the rail; objects placed on or behind the rail; aesthetic asperities or surface treatments; and barrier discontinuities, such as expansion joints. Although the strength and height of bridge rails are of great importance for preventing catastrophic failures, these more subtle design aspects can greatly impact a system’s overall level of safety in the event of a collision.
Post-and-Beam Setback and Spacing
Post-and-beam bridge rails, if not proportioned correctly, can pose a significant snagging hazard to errant vehicles. Post setback, vertical rail spacing, and the ratio of rail face height to the total height of the system should all be considered in the design of post-and-beam bridge rails. Current AASHTO LRFD BDS practices for post spacing and setback are discussed in Chapter 2.
When proportioning bridge rail systems, design tables presented in AASHTO LRFD BDS guidance are used to reduce snagging potential. Though formulated under NCHRP Report 230 criteria (Mitchie 1981), these design charts were determined to be appropriate for MASH criteria by Silvestri-Dobrovolny et al. (2017). In a more comprehensive approach, Pena et al. (2019) compared MASH test vehicle bumper heights to rail heights in the design process of a metal post-and-beam system. Pena et al. further reduced snagging potential by proportioning the system such that the structural components of the MASH passenger car, pickup, and SUT test vehicles were directly engaged by at least one rail at the point of first impact. These studies investigating post spacing and setback criteria are discussed in further detail in Chapter 2. It is important to note that NCHRP Project 22-35 investigated snagging potential under MASH conditions in
further detail and that the objective of this effort was to update AASHTO LRFD BDS Section 13 (Williams, Schulz, and Abu-Odeh 2022).
Head-Slap Mitigation
Redirection of vehicles impacting safety shape barriers is typically characterized by vehicle roll away from the barrier. Alternatively, vertical and single-slope barriers do not allow significant climb and exert more severe lateral forces onto impacting vehicles. As such, a significant risk of head-slap, or impact between the barrier and the vehicle occupant’s head, arises for vertical and single-slope barriers. Head-slap is associated with high risks of serious injury or fatality.
As part of a research effort to design a TL-5 median barrier, Rosenbaugh et al. (2007) analyzed digital video of NCHRP Report 350 crash tests to develop a head ejection envelope for vertical and single-slope barriers. In total, eight small-car tests and three pickup truck tests were analyzed. SUT and tractor-trailer impacts were not analyzed, as these vehicles are sufficiently tall to mitigate head-slap risks. Lateral and vertical head ejection for seat-belted dummies were measured from the lower edge of the window, as shown in Figure 167. By superimposing head ejection envelopes of each test, Rosenbaugh et al. developed exclusion zones for small-car impacts and pickup truck impacts. Additionally, the head ejection envelope was adjusted to account for vehicle roll toward the barrier and interpolated to account for midsize vehicles, such as SUVs and small pickups. The final head ejection envelope is presented in Figure 223.
Zone-of-Intrusion (ZOI) Considerations
When a vehicle impacts a barrier, protrusion of the vehicle over and behind the barrier is likely to occur. This region above and behind the barrier into which the vehicle may penetrate is
the ZOI. If objects, such as signs or mounted luminaire poles, are placed in the ZOI, they pose a potential risk of snagging or occupant compartment penetration. Unless adequate safety performance is validated in full-scale crash testing, the ZOI should be free of fixed objects.
In 2003, researchers at MwRSF performed a comprehensive review of full-scale crash tests of bridge rails and median barriers to define the ZOI for traffic barriers (Keller et al. 2003) corresponding to NCHRP Report 350 criteria. An additional computer simulation study was later performed to estimate the lateral ZOI for the 2000P test vehicle (Reid and Sicking 2010).
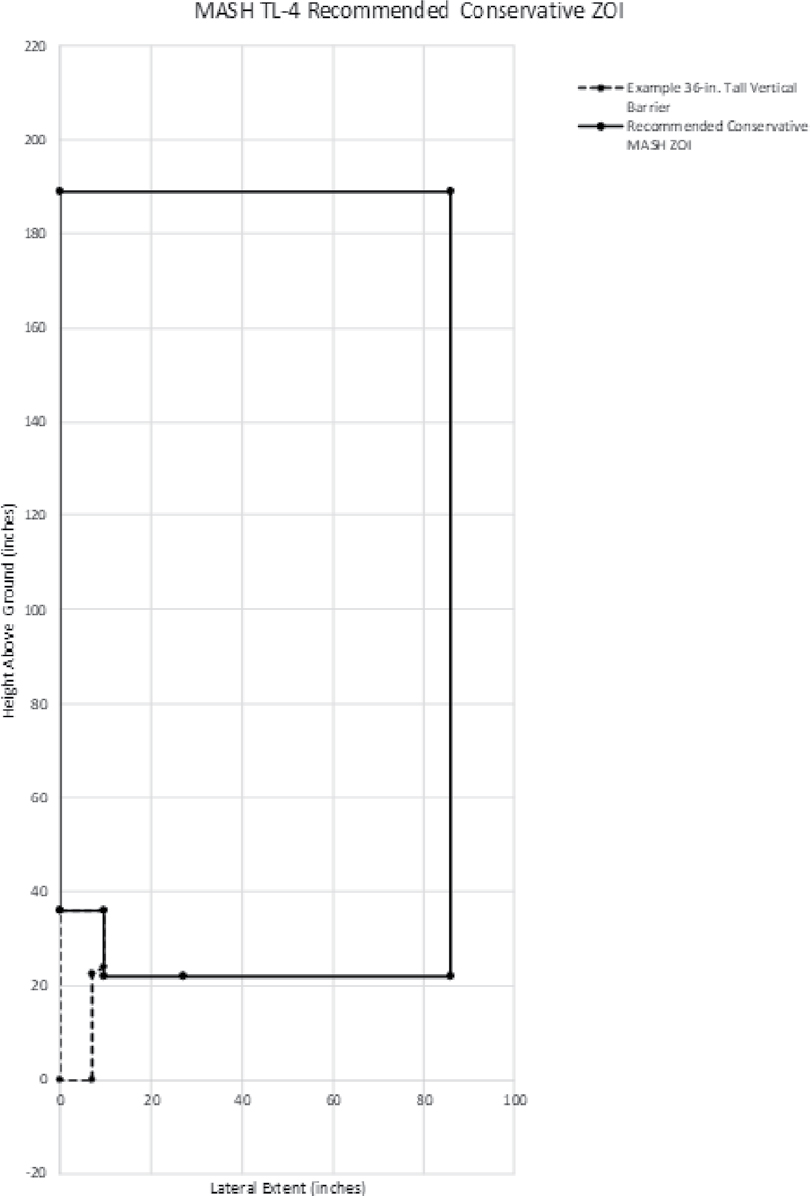
A research effort was recently performed by researchers at MwRSF to establish ZOI envelopes for updated MASH impact criteria under NCHRP Project 22-34 (Stolle et al. 2022). The research produced preliminary ZOI envelopes for MASH TL-2 through TL-5 criteria. By analyzing MASH crash-test data, Stolle et al. developed conservative ZOI envelopes considering all barrier types. These preliminary ZOI envelopes, shown in Figures 178 through 181, are uniformly more extensive than those established by Keller et al. (2003) for NCHRP Report 350 conditions. The preliminary TL-4 ZOI envelope proposed by Stolle et al. (2022) is shown in Figure 224.
Asperities and Surface Treatments
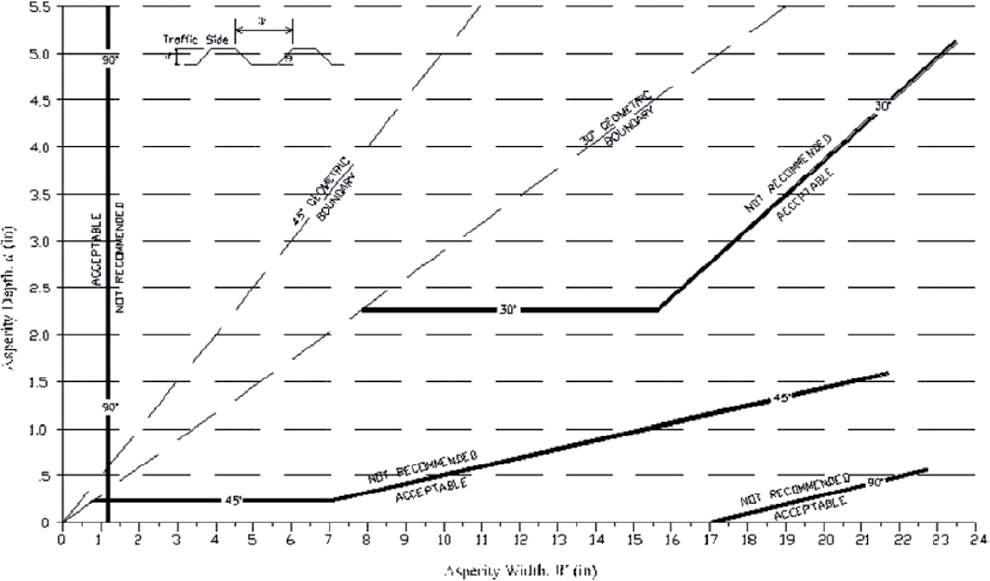
Occasionally, aesthetic treatment of bridge rails is desired. To evaluate the effect of aesthetic asperities and surface treatments on the safety performance of traffic barriers, Bullard et al. (2006) conducted finite element simulations and full-scale crash tests on aesthetic features deemed common in a literature review of domestic and foreign barrier designs. From the investigation, Bullard et al. determined that, for a given asperity width, the permissible asperity depth depends on the angle at which the asperity is carved into the barrier. Acceptable combinations of asperity widths, depths, and angles were defined for safety shape barriers in the design table shown in Figure 225.
Barrier textures and asperities were previously investigated by White et al. (2002) through eight full-scale NCHRP Report 350 crash tests. Based on the results of these tests, the following general guidelines were established:
- Single-slope barriers with shallow features, rounded features, and/or beveled leading edges will not typically result in significant snagging.
- Deep textures and patterns near the base of a barrier are likely to cause wheel snagging.
- Textures that feature upward-sloping edges in the direction of travel encourage wheel climb and rollover.
Expansion Joints and Barrier Discontinuities
Expansion joints and barrier discontinuities can have a significant effect on the impact behavior of a bridge rail system. Barrier discontinuities are characterized not only by reduced capacity but by snagging hazards, as well. Joint snagging hazards increase with increasing gap width.
Crash-testing data provides insight into the relationship between vehicle snag potential and gap width. Under NCHRP Report 230 criteria (Mitchie 1981), two PL-2 tests were conducted with impacts at a 4.5-in. expansion joint (Holloway et al. 1996). The tests, which included a pickup and SUT impact, were both successful, though vehicle snagging was evident. More recently, researchers at TTI performed a successful MASH TL-4 test with an SUT impacting a 2-in. barrier gap. Additionally, 4-in. barrier gaps have been successfully tested to MASH TL-3 conditions, marking 4 in. as the largest barrier gap successfully tested to MASH criteria. As such, considering crash-test data, researchers at MwRSF recommend that barrier gaps exceeding 2 in. for TL-4 and 4 in. for TL-3 are treated with cover plates or other gap-spanning hardware to reduce the propensity for snagging (Mander et al. 2011).
Alternatively, the barrier asperity guidance provided by Bullard et al. (2006) (Figure 225) can be used to determine acceptable barrier gap widths. If barrier gaps are considered to be vertical asperities, then the acceptable gap width as determined by Bullard et al. is roughly 1 in. As such, vehicle penetration, which can be geometrically estimated based on impact angles, should be limited to 1 in. Based on this estimation method, for a 25° impact angle, gap widths not exceeding 2 in. are permissible (Mander et al. 2011).
In sum, the permissible, untreated gap width has not been explicitly investigated, though it can be estimated through crash-test data and theoretical models. If maximum gap widths successfully tested to MASH criteria are considered, untreated widths of 2 in. and 4 in. appear adequate for TL-4 and TL-3 conditions, respectively. Alternatively, if vertical asperity limits are combined with impact geometry, the maximum permissible gap width is 2 in. for any test level.
Dynamic and Static Increase Factors
Dynamic Increase Factors (DIFs)
Material properties vary with the rate at which they are loaded. When loaded at high strain rates, materials can exhibit higher strengths than when loaded statically. The ratio of dynamic to static strength is often reported as a DIF. DIFs for concrete and steel, which are of particular importance to the impact performance of roadside safety barriers, have been well-documented in several research efforts.
DIFs for concrete loaded in tension and compression are unique. For concrete in compression, the CEB-FIP Model Code (CEB 1993) developed in 1990 is the generally accepted method for
estimating the DIF. Alternatively, for concrete in tension, the modified CEB model proposed by Malvar and Crawford (1998) is considered to be the most accurate method for estimating the DIF. Compressive and tensile DIF estimation methods are discussed in Chapter 2.
DIFs for steel are well-documented. The method of estimating the DIF of steel that is most applicable to the design of bridge rail systems is the Cowper-Symonds relation (Cowper and Symonds 1957), which is discussed in further detail in Chapter 2.
Although the methods for estimating the DIF of concrete and steel are confident, their accuracy relies heavily on the accuracy of the strain rate estimate. Estimating the strain rate associated with vehicle impact is difficult, and very little research has been performed investigating the strain rate experienced by roadside safety barriers when subjected to vehicle impacts. Based on experiments performed by Tedesco et al. (1993) and Riisgaard et al. (2007), the strain rate of vehicular impacts is estimated to be between 10-6 and 10-3 s-1. Without further investigation, such a large range of estimates renders the use of DIFs in roadside safety applications useless, as low-estimate strain rates in this range produce dynamic strengths negligibly larger than static strengths. The strain rate of vehicle impacts is discussed in Chapter 2.
For reference, MASH 2016 notes that a DIF of 1.5 is typically used in practice for steel posts (AASHTO 2016). Additionally, it is noted that no DIF should be used for wood members. No DIF estimate is provided for concrete barriers. This anecdotal design value is not consistent with the results of dynamic component testing of steel posts performed by Mauricio et al. (2019). In this testing suite, isolation of the strength increases due to dynamic loading indicated a DIF of just 1.04.
Additionally, DIF estimates for epoxy anchors have been presented in the identified literature. These DIFs range from 1.25 to as high as 2.60 (Berra and Solomos 2005; ACI 1997; Braimah et al. 2009; Hilti 2023). Epoxy developer Hilti recommends a DIF of 1.40. This DIF was applied alongside steel and concrete increase factors in a research effort performed by Dickey et al. (2012); as a result, the margin of as-tested to expected strength narrowed from 93% to 33%.
Static Increase Factors
When structural materials are fabricated, the actual strength of the material is greater than the reported strength of the material. This practice ensures that the vast majority of the fabricated material is as strong as necessary while maintaining economical manufacturing tolerances. The ratio of a material’s actual strength to its reported strength is addressed with an SIF. SIFs are independent of strain rate. Informed by reviews of steel mill test reports, Dalton et al. (2008) suggest that an SIF of 1.10 is appropriate for the yield stress of Grade 60 reinforcing steel. This suggestion is corroborated in the 2017 Bridge Security Design Manual (Davis et al. 2017). Additionally, based on experimental data, the Bridge Security Design Manual notes an SIF of 1.10 for the compressive strength of 28-day cured concrete. In sum, an SIF of 1.10 is recommended for Grade 60 steel reinforcement and concrete.
Seismic Design Guidance
When a structure is subjected to seismic loading, member overstrength must be considered in design to avoid unfavorable behavior. To ensure energy-dissipating mechanisms occur at desired locations, seismic design principles dictate that overstrength be considered in the design process. As such, the AASHTO Guide Specifications for LRFD Seismic Bridge Design with 2012 and 2014 Interim Revisions contains various overstrength factors for structural members and expected material strengths (AASHTO 2014).
Expected Material Strengths
AASHTO LRFD seismic design guidance provides material strength estimates to account for bias of expected versus nominal material strength. For ASTM A 709 Grade 50, A 709 Grade 50W, and A 992 steels, the expected yield stress, Fye, is 1.1 times the nominal yield stress, Fy. For ASTM A 500 Grade B and ASTM A 501 steels, the expected yield stress is 1.4 times the nominal yield stress. Additionally, the expected yield stress for ASTM A 706 and A 615 Grade 60 reinforcing steel bars is 68 ksi, as determined from data collected by Caltrans. The expected compressive strength of unconfined concrete, fce ′ , is also specified at 1.3 times the nominal compressive strength, fc′.
Overstrength Factors
Capacity design for seismic effects requires that overstrength factors be applied to ensure damage is limited to selected regions in a structure. This same philosophy can be applied to barrier design to protect decks from damage by ensuring a high estimate of barrier strength relative to deck strength. According to AASHTO LRFD Seismic Bridge Design Article 8.5, the overstrength capacity of reinforced concrete members is obtained by multiplying the expected capacity (accounting for material bias) by an overstrength factor, λmo, of 1.2 or 1.4. Similarly, for steel members, the expected moment strength is multiplied by an overstrength factor of 1.2 to determine the overstrength capacity.
Static Equivalent Design Loads
Existing and proposed methodologies for designing and analyzing bridge rail systems are heavily reliant on the appropriate selection of an equivalent static design load to representatively simplify a complex dynamic impact. In general, static equivalent loads can be higher or lower than peak dynamic loads, depending on the load duration, and structure mass, stiffness, and damping. The ratio of the deflection under a dynamic load and the deflection under a static load of the same magnitude is called the “dynamic response factor,” Rd, and is calculated as
| (111) |
where udynamic is the transient dynamic deflection response of a structure with stiffness k, and ustatic is the deflection of the structure under a static load, P.
If the relationship between deflection and force is assumed to be linear, this factor acts as a coefficient modifier, which reduces or magnifies the effect of an impact load:
| (112) |
in which Fdynamic is the peak dynamic load and Fstatic is the static equivalent load.
Because the barrier takes time to be activated and set into motion, the duration of the load is closely related to the deflection of the barrier. As such, the dynamic response factor is a function of the ratio of the load duration to the natural period of the structure
| (113) |
where td is the duration of the impact pulse and Tn is the structure’s natural period. The dynamic response factor is also a function of the impact pulse shape. It is different for rectangular pulses,
triangular pulses, and so on. The dynamic response factor and its relationship to the pulse duration, pulse shape, and structure period are demonstrated in Figure 226.
If the pulse load duration is too short, the structural response will be less severe than under a static load of the same magnitude. To apply this theory to bridge rail design, two values must be estimated:
- Duration of impact load pulses and
- Natural frequency of bridge rail systems in response to lateral loading.
The first of these values can be estimated from a review of available load histories from vehicle crash tests and impact simulations in LS-DYNA. To create a preliminary range of impulse load durations for MASH TL-4 impacts, three full-scale tests performed at MwRSF (Rosenbaugh 2019; Rosenbaugh et al. 2019) and four LS-DYNA simulations performed under NCHRP Project 22-20(02) (Bligh et al. 2017) were analyzed. The results of this analysis are shown in Table 40. As tail-slap loads typically exceed initial impact loads, tail-slap pulse loads were used to populate this table. From this investigation, the typical impact load duration can be confidently estimated within a range of 50 ms to 100 ms.
To create a preliminary estimate for the natural frequency of a bridge rail under lateral impact load, a rudimentary simulation was performed in LS-DYNA. An unreinforced concrete, linear elastic bridge rail model was subjected to a ramping load and then released into free vibration. The model consisted of a 36-in. parapet secured to a 7-in.-thick, 4-ft-long overhang. The model was fixed at its longitudinal ends and the interior edge of the overhang. The magnitude and dimensions of the load application were consistent with the proposed values reported in NCHRP Web-Only Document 326 (Bligh et al. 2017). From the free vibration response, the natural period of the bridge rail was estimated. The bridge rail model with applied load is shown in Figure 227, and the free vibration response is demonstrated in Figure 228. The average oscillation period of the bridge rail model was roughly 30 ms.
In summary, this preliminary investigation estimates the duration of impact load pulses between 50 ms and 100 ms and very roughly estimates the natural period of a concrete bridge rail at 30 ms. This analysis is approximate and does not consider period contraction for an undamaged
Table 40. Impact load pulse durations.
| Test | Type | Barrier Type | Tail-Slap Impulse Duration (ms) | Tail-Slap Impulse Shape |
|---|---|---|---|---|
| STBR-1 | Full-scale | Rigid metal post-and-beam | 100 | Triangular |
| STBR-4 | Full-scale | Rigid metal post-and-beam | 70 | Triangular |
| 4CBR-1 | Full-scale | Single-slope concrete barrier | 50 | Triangular |
| NCHRP Project 22-20(02) 36 in. | Simulation | Rigid barrier | 60 | Half-sine |
| NCHRP Project 22-20(02)a 39 in. | Simulation | Rigid barrier | 50 | Half-sine |
| NCHRP Project 22-20(02)a 42 in. | Simulation | Rigid barrier | 50 | Half-sine |
| NCHRP Project 22-20(02)a Tall | Simulation | Rigid barrier | 50 | Half-sine |
aNCHRP Web-Only Document 326 (Bligh et al. 2017).
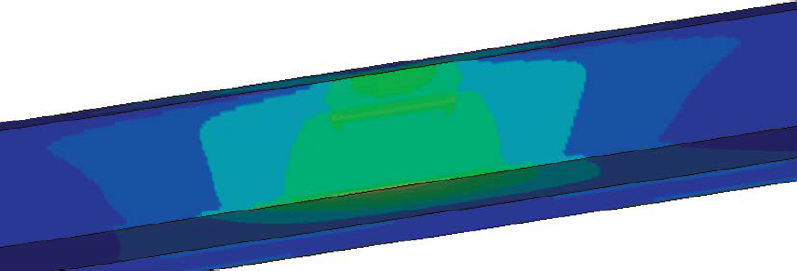

barrier with higher stiffness available from internal reinforcing. Alternatively, period elongation would be observed with the inclusion of damping or reduced stiffness from flexural cracking. On balance, for a severe impact, period elongation would be expected. A comparison of these findings suggests that impact load pulses are likely of sufficient duration to activate the barrier, and dynamic response factors for bridge rails subjected to traffic impacts are not likely to be less than one.
Although the results of this preliminary investigation do not support the reduction of impact loads due to their short duration, Williams, Abu-Odeh, and Bligh (2019) suggested that the adequacy of structures under perceived overburden may be due to the extremely short duration of traffic impact loads. Williams, Abu-Odeh, and Bligh simulated MASH TL-4 impact of a bridge rail mounted to a retaining wall, which caused the soil pressure to reach 164% of its maximum allowable static stress. However, the system performed adequately, deflecting laterally by just 1 mm. While this is an interesting study and outcome, the inherent uncertainties and conservativism in soil strength quantification complicate the comparative evaluation of dynamic versus static load.
No research has been performed to adequately determine the relationship between traffic impact load duration and barrier natural frequency. As such, static equivalents cannot be confidently estimated in this manner at this time. Instead, static equivalents are typically drawn from load-time histories with 50-ms data filtering, as in NCHRP Project 22-02(2) (Bligh et al. 2017). Such a practice assumes a one-to-one relationship between static and dynamic loads, which would be valid only if the duration of the impact load is compatible with the barrier mass and stiffness and if the barrier behaves as a single-degree-of-freedom dynamic system with a concentrated mass subjected to the impact load.
Test Level Selection Guidance
No structured recommendations for test level selection are provided in current AASHTO LRFD BDS guidance; instead, only qualitative guidelines are provided. Ray and Carrigan (2015) used risk analysis software to establish more structured guidelines for selecting appropriate test levels under NCHRP Project 22-12(03). The guidelines consider traffic and site conditions, and the process includes (1) traffic volume (AADT), (2) total encroachments expected over the 30-year life of a 1,000-ft span of bridge, (3) expected number of encroachments adjusted for site-specific conditions, (4) selection of the test level from a design chart, (5) additional considerations, and (6) evaluation of the appropriateness of the preceding guidelines. At the end of the procedure, with the hazard environment, the traffic profile (percent trucks, PT), and the number of encroachments estimated from provided design charts, the test level is selected via Figure 229. The test level produced by this procedure corresponds to a probability of severe or fatal injury of 1% over 30 years for a 1,000-ft span of the bridge. A more detailed discussion of the selection guidance is provided in Chapter 2.