Aligning Investments in Therapeutic Development with Therapeutic Need: Closing the Gap (2025)
Chapter: 3 Degree and Patterns of Mismatch Between U.S. Disease Burden and Public and Private Investment in Innovative Therapeutic Development
3
Degree and Patterns of Mismatch Between U.S. Disease Burden and Public and Private Investment in Innovative Therapeutic Development
Building on Chapter 2, which defined key constructs needed to assess mismatches between disease burden and investment in innovation, this chapter seeks to review the existing empirical data that were accessible to the committee and answer the question of what is currently known about the patterns of mismatch between U.S. disease burden and investment. Several groups have attempted to study the mismatch between disease burden and investment in therapeutic development and to develop a list of areas where future investments are needed, and the following sections provide an overview of some of those efforts. However, it should be noted that such lists of underinvested disease areas vary depending on the specific data, methodology, and values used to develop them. Many existing lists prioritize one set of criteria or do not account for some, often hard-to-measure, factors. For example, as discussed in Chapter 2, disease burden is often estimated via total disability-adjusted life-years (DALYs); however, disease burden has multiple dimensions. Data aggregation poses another challenge—that is, existing data on disease burden may use categories for disease causes that do not match classifications for therapeutic areas, which complicates the assessment of alignment. One aspect of this challenge is that the burden of disease is often assessed for broad categories that encompass many diseases and lack the granularity necessary to identify mismatch for more specific conditions or to understand the nuances that contributed to a mismatch.
Recognizing the limitations of existing data, the committee began by reviewing findings from the most commonly used paradigm for assessment investment mismatch, which compares total burden of disease to public
research investment, focusing on the National Institutes of Health (NIH) as the primary funder of biomedical research in the United States. The chapter proceeds with a discussion of private investment and closes with commentary on additional nuances to take into account when assessing mismatch between disease burden and investment. Throughout, the committee highlights limitations of the data available for this exercise.
PUBLIC INVESTMENT IN THERAPEUTIC DEVELOPMENT
As described in Chapter 2, the public sector, through federal agencies such as NIH, has contributed significantly to drug development, particularly through a focus on basic science and discovery research (see Chapter 2, section “Investment in Therapeutic Innovation”). Driving the agency’s research agenda, NIH’s mission is to “seek fundamental knowledge about the nature and behavior of living systems and the application of that knowledge to enhance health, lengthen life, and reduce illness and disability” (NIH, 2024). The agency is focused on supporting innovation, creativity, and science in advancing fundamental knowledge on human health. Its work supports a spectrum of research on the causes, diagnosis, prevention, and cure of human diseases. NIH activities cover a wide range of basic, clinical, and translational research, focused on particular diseases, areas of human health and development, or more fundamental aspects of biology and behavior (Congressional Research Service, 2023).
NIH considers disease burden rates when determining funding priorities, specifically, using the Research, Condition, and Disease Categorization (RCDC) system, which publicly reports funding for medical research across diseases and conditions (NIH RePORT, n.d.). NIH’s funding decisions, including about biopharmaceutical research, are made through a dual-level peer-review process that prioritizes support of scientific ideas with “the greatest potential impact to improve human health or otherwise advance biomedical research” (NIH, 2023).
In fiscal year (FY) 2024, NIH received program-level funding totaling over $47.311 billion, a decrease in its overall program level in nominal dollars for the first time since FY2013 (Congressional Research Service, 2024). The FY2025 budget maintains NIH and Advanced Research Projects Agency for Health (ARPA-H) program funding at approximately the same level as FY2024.1 However, the President’s proposed budget for FY2026 calls for a nearly $18 billion reduction to NIH, which would amount to a roughly 40 percent cut (OMB, 2025).
___________________
1 Full-Year Continuing Appropriations and Extensions Act, 2025. Public Law 119-4, 119th Congress (March 15, 2025).
Several groups have analyzed NIH funding information to assess how well the allocations align with disease burden (e.g., Ballreich et al., 2021; Gillum et al., 2011; Rees et al., 2021). The dominant paradigm in these assessments is to compare total DALYs versus NIH funding to identify diseases that have disproportionately low investment. In one example published in 2021, an analysis of NIH funding by disease category examined DALYs in 2008 and 2019 to determine alignment with funding for 46 diseases (Ballreich et al., 2021). These 46 diseases represented more than 66 percent of all DALYs in both 2008 and 2019, leaving out 34 percent of diseases that affect the U.S. population. The analysis found that NIH funding allocations appeared to shift minimally over 10 years, despite substantial changes in the contributions of different diseases to the overall burden of disease. The authors recommended, “NIH should examine the allocation process to ensure NIH investments are responsive to changes in the health of the population” (Ballreich et al., 2021).
The authors identified three diseases with substantially lower funding (eating disorders, uterine cancer, and psoriasis) relative to burden across both 2008 and 2019, and three diseases with higher funding (HIV/AIDS, digestive diseases, and urologic diseases). Their analysis of the change in funding from 2008 to 2019 showed that funding for Alzheimer’s and dementia increased the most (> 350 percent increase) and that funding for interpersonal violence, multiple sclerosis, Hodgkin lymphoma, and otitis media had the largest decreases (≥ 40 percent decrease); these changes were not proportional to the percent change in total DALYs, though they may reflect scientific and therapeutic developments in these areas during this period (Ballreich et al., 2021).
The committee analyzed publicly available data on disease burden and NIH funding in the years 2019–2021 to further inform its assessment of mismatch (Figure 3-1). Data on disease burden as measured by DALYs were collected from the Global Burden of Disease Dataset available through the Institute of Health Metrics and Evaluation (IHME). NIH funding information was gathered from the NIH RePORTER database. A ratio between NIH funding and the DALYs rate (DALYs per 100,000 population) was calculated to determine whether disease areas had a high, low, or proportional share of funding.2
This analysis identified the following diseases and conditions that had disproportionately low NIH funding relative to disease burden (DALY rate) in 2021: ischemic heart disease, low back pain, chronic obstructive pulmonary disease (COPD), headache disorders, neck pain, gallbladder and biliary diseases, and psoriasis. Some diseases had a higher share of funding than their disease burden would indicate, including Alzheimer’s disease and other
___________________
2 DALYs rate and NIH funding information were available for 59 disease areas for 2021, the most recent year for which both burden and funding information were known.
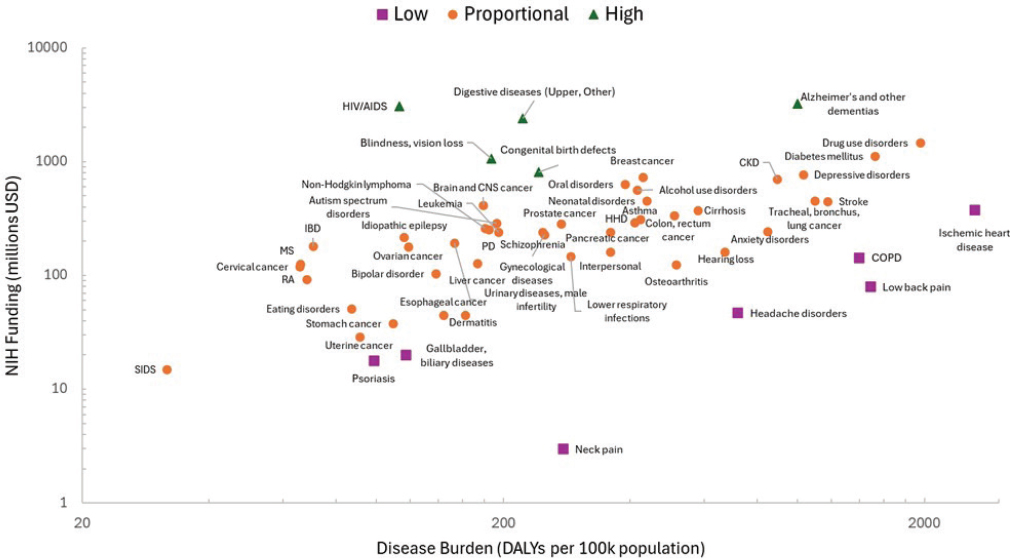
NOTES: Purple squares indicate diseases with low funding to burden ratio. Green triangles indicate diseases with a high funding to burden ratio. Orange circles indicate relatively proportional funding to disease burden. CKD = chronic kidney disease; CNS = central nervous system; COPD = chronic obstructive pulmonary disease; HHD = hypertensive heart disease; IBD = inflammatory bowel disease; MS = multiple sclerosis; PD = Parkinson’s disease; RA = rheumatoid arthritis; SIDS = sudden infant death syndrome. Not all diseases are represented in the plot.
SOURCE: Created using data from NIH and IHME data, 2021.
dementias, congenital birth defects, blindness and vision loss, digestive system diseases, and HIV/AIDS. Of note, these findings are relative to disease burden in the United States; however, funding may not be overweighted considering the global burden of HIV/AIDS, for example. Emphasizing the need for disaggregated data, the ratio of NIH funding relative to disease burden differs for different types of cancer. For example, brain and central nervous system cancers have higher investment than liver or esophageal cancers, despite comparable rates of disease burden. This may reflect differential unmet need profiles across these types of cancer, although it is difficult to say conclusively without additional data. It is also notable that neck pain, low back pain, and headache disorders appear to have lower public investment. This may be, in part, because pain is subjective and often idiopathic, making it challenging to study. Moreover, a condition like food allergies, which has been reported to affect more than 26 million people in the United States, was not included on this list of diseases (Gupta et al., 2019; Sansweet et al., 2024).
This evidence, together with prior analyses, indicates some misalignment between NIH funding and disease burden. COPD stands out as a condition that has relatively low public investment across many of these studies; whereas, HIV/AIDS and Alzheimer’s disease and other neurological diseases, while having a large disease burden, have appeared in multiple instances to have relatively high investment compared with burden. Misalignment may be a result, in part, of congressional appropriations made for certain conditions, such as Alzheimer’s disease and dementia, and advocacy for specific diseases could play a role in their relative funding level (Ballreich et al., 2021; Best, 2012). (See Chapter 5, section “NIH Funding Process” for more information about how NIH funding is allocated.)
Compounding this misalignment is the fact that funding for research on diseases of significant public interest may be neglected by private funding owing to its potential for small market share. For example, rare diseases affect a small population with potential smaller market share and thus may not be a focus of private research and development (R&D) absent market incentives, though there has been considerable progress in developing novel treatments for narrow indications in recent years with 26 of 50 novel drug approvals in 2024 being for rare diseases (FDA, 2025). Taken together, the committee found that disease burden and unmet medical need are multidimensional and challenging to measure, which suggests the need for multiple measures to effectively assess alignment or mismatch among these factors. A data repository that compiles multiple metrics of disease burden and unmet need would enable different organizations to access relevant data and create lists that reflect their priorities and values. For example, prioritizing reducing disparities across populations would require information on individual burden or data aggregated by relevant sociodemographic groups, not only population burden.
Limitations of Using NIH Funding Data to Assess Mismatch
There are several known limitations of this approach of comparing total DALYs to NIH funding to assess the mismatch between burden and investment. The data are imperfect—some disease areas may be missing or unavailable in different analyses, and it can be challenging to align disease burden measurements with NIH funding categories, which can lead to variation and uncertainty in these results. Additionally, some investments in basic science that benefit multiple disease categories are typically not captured separately for each disease, which adds the complexity to categorizing the investment allocation by disease. Moreover, this simple comparison of DALYs and NIH funding reduces complex, multidimensional concepts, such as burden (see Chapter 2), to a single dimension and metric. It captures only a snapshot of disease burden at one point in time. For some diseases like Alzheimer’s disease, the projected disease burden is higher than current burden, potentially warranting higher investments in preclinical research now to help address projected unmet need for future populations.
On the investment side, a focus on NIH, while traditionally the largest public funder of biomedical research, excludes the contributions of other public funding sources, such as the U.S. Department of Defense and the Biomedical Advanced Research and Development Authority (BARDA), to biomedical R&D. In 2021, for example, BARDA had a budget of $1.4 billion to advance medical countermeasures for responding to health threats.3 In addition, analyzing NIH funding relates to only part of the product development pipeline and omits information about private-sector investment. Analyzing DALYs versus NIH funding also does not account for unmet need and innovation, key components of this committee’s statement of task. However, there are a number of obstacles to operationalizing a more nuanced, complex framework—not least of which is availability of the data required. In addition, priority setting becomes far more challenging with more dimensions and criteria. As a next step, the committee assessed the role of private-sector funding.
PRIVATE-SECTOR FUNDING AND PRIORITIES FOR BIOPHARMACEUTICAL RESEARCH
Data indicate that private funding for biopharmaceutical development has been increasing over time. For example, the share of U.S. medical research funded by industry grew from 46 percent in 1994 to 58 percent in 2012, with industry providing the primary funding for late-phase clinical
___________________
3 https://aspr.hhs.gov/AboutASPR/BudgetandFunding/Pages/BudgetandFundingFY2021.aspx (accessed April 21, 2025).
trials (Moses et al., 2015). Another study found that from 2006 to 2014, the number of industry-funded clinical trials registered in ClinicalTrials.gov increased by 43 percent, while the number of NIH-funded trials decreased by 28 percent (Ehrhardt et al., 2015). Measuring the relative contributions of the private and public sector to drug development is challenging, but one study suggests that when accounting for basic research, NIH investment in drugs approved from 2010 to 2019 was not less than private-sector funding (Galkina Cleary et al., 2023). NIH funding is primarily used to support public goods such as understanding the biological mechanisms of disease (Galkina Cleary et al., 2018), and the NIH also funds a significant number of phase I and II clinical trials in areas such as gene therapy (Kassir et al., 2020). However, these contributions are generally unpatentable, and late-stage patentable contributions are largely privately funded. For example, of the 1,213 patented drugs that were on the market in 2023, only 45 (4 percent) had any federally funded patents, and only 16 (1 percent) had solely federally funded patents (Ouellette and Sampat, 2024).
According to a 2023 report, significant funding from the pharmaceutical sector is devoted to oncology and neurology research. These products constitute the highest share of the R&D pipeline (see Figure 3-2). Particularly, oncology remains the focus of the pipeline, accounting for 38 percent or 2,331 products and growing at 10.5 percent compound annual growth rate over the last 5 years (IQVIA, 2023).
Venture capital (VC) funding accounts for approximately 10 percent of investment in biopharmaceutical R&D globally and plays a key role in funding early-stage, innovative ventures (SiRM et al., 2022). A 2024 study by Kang et al. analyzed VC funding patterns in pharmaceutical R&D from 2014 to 2024 and similarly found that the investment was concentrated in oncology and neurology/psychiatry. Cancer alone accounted for nearly 30 percent of VC deals in 2023, and the authors suggest that “FDA [Food and Drug Administration] and payment incentives may influence VC investments” in these therapeutic areas (Kang et al., 2024). In addition, approximately 75 percent of VC investments were focused on small-molecule drugs as compared to biologics or gene therapies, with this pattern relatively stable over the period 2014–2024 (Kang et al., 2024), though trends may change depending on legislation and other policy parameters. These investments in cancer affect half of all men and one-third of all women in the United States expected to be diagnosed with cancer in their lifetimes (NCI, n.d.). Funding for cancer research also contributes to improvements in the biological understanding of malignancy achieved in the last few years (Wang et al., 2023).
Interestingly, the study found that VC investments were concentrated on early-stage, particularly phase I, clinical trials, with increasing investment in phase I trials over the period analyzed. Phase I trials accounted
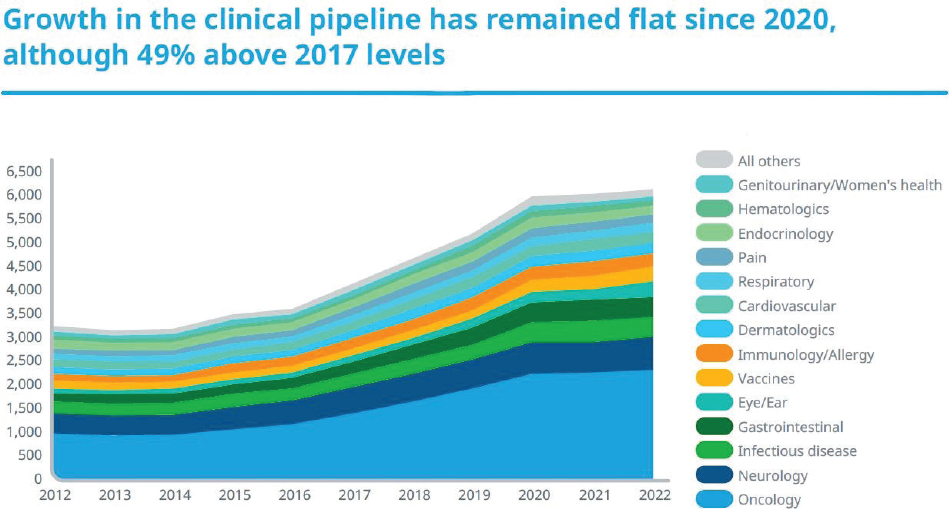
NOTES: Includes drugs with an active research program, with phase determined by the highest phase of research regardless of indication. Oncology includes supportive care. Neurology includes central nervous system disorder treatments and mental health treatments but does not include pain management or anesthesia.
SOURCE: IQVIA, 2023.
for nearly half of VC deals by 2023 and 61.2 percent of deals in the first quarter of 2024 (Kang et al., 2024). Although phase I trials are risky and known to have the highest failure rates in drug development, the authors suggest that this trend may reflect strategic positioning (Kang et al., 2024). That is, as large pharmaceutical companies acquire biopharmaceutical companies at early stages, VC firms respond by investing earlier, despite the higher risk, to position such companies for acquisition and enhanced return on investment. Earlier exits may also be more profitable given the expense of and risk associated with later-stage clinical trials (Kang et al., 2024). Conducting a trial costs $25,000 or more per patient and phase 3 trials are the primary driver of R&D costs (Gandjour, 2024; Kantarjian et al., 2013; Light and Warburton, 2011). This can make raising capital for certain conditions, such as cardiovascular disease, difficult because there are already several generics on the market so prices must be low; however, expensive, long-term, large phase 3 trials are still required (Kocher and Roberts, 2014).
Furthermore, because VC firms want to invest in drugs that are likely to be acquired after phase 2 by larger pharmaceutical companies, they are more likely to invest in therapeutic areas that are a focus area of large pharmaceutical companies. Without the sales force, manufacturing, and customer service expertise already in place, it becomes more challenging to raise the additional funds required to build these critical functions. In the context of the committee’s statement of task, these trends could exacerbate misalignment between investment in innovation and disease burden if early-stage R&D decisions are increasingly influenced by potential return on investment and market forces, rather than by public health needs.
Another recent IQVIA report provides additional insight into therapeutic innovation and new trends in pharmaceutical development since the Inflation Reduction Act (IRA) was passed in 2022, though these data and trends are still emerging. The report examined postapproval expansions, which typically extend drug indications to additional patient populations or conditions, from 2000 to 2023 and analyzed early data on the effects of the IRA’s Medicare Drug Price Negotiation Program. The study found that postapproval expansions are widespread—approximately 50 percent of drugs received at least one postinitial approval expansion, and the pattern is relatively consistent across small molecules (52 percent) and biologics (47 percent) (IQVIA, 2025). Another study found that about 55 percent of cancer drugs receive approval for at least one supplemental indication (Stoelinga et al., 2024). Importantly, the innovation life cycle for a new drug is not complete at the time of initial approval (IQVIA, 2025).
With the IRA, which could change with new legislation, small molecules are subject to Medicare price negotiation after 9 years and biologics after 13 years, compressing the timeline to develop supplemental
indications prior to possible price negotiation (see Chapter 5 for more detail).4 Although it is possible that this change could disincentivize investment in indication expansions as IRA deadlines approach, most expansions occur within the first few years following initial approval (Stoelinga et al., 2024). Considering biologics for example, 33 percent of expansions happened after year 9 postapproval (IQVIA, 2025). Approximately 15 percent of expansions were secured after the IRA’s price negotiation time frames of 9 or 13 years (IQVIA, 2025). Nonetheless, because clinical trials are lengthy and expensive, if new indications are identified closer to the negotiation deadline, sponsors may decide that investment is not worth it, especially in the context of some rare diseases, leaving potentially beneficial indications undeveloped. Given longstanding strategic considerations, the development of follow-on indications could change significantly depending on various policy parameters.
Importantly, negotiated prices consider R&D costs, as well as several other factors, and are not intended to eliminate profit; in fact, in the first round of negotiations, most of the negotiated Medicare prices remained substantially higher than prices abroad (Rome et al., 2024). Thus, developing supplemental indications should still offer strong returns for industry. However, to the extent that the IRA significantly affects decision making in the private sector about whether new indications are worth the investment in R&D, public funding may be necessary to support investigation of new off-label uses.
Distribution of Pharmaceutical Products Compared with Burden
In addition to the literature reviewed above, the committee also worked with Steve Lim, a professor of health metrics sciences and the senior director of science and engineering at IHME, who served as an unpaid consultant to the committee. The IHME research team shared in-progress data that were collected as part of its assessment of the alignment between disease burden and pharmaceutical development, using pharmaceutical products as a proxy for investment. The committee considered data from IHME comparing the distribution of pharmaceutical products in the development pipeline with the U.S. burden of disease (DALYs) projected in 2030 (Figures 3-3, 3-4). Briefly, data on drugs in the development pipeline were collected from a variety of databases (EvaluatePharma, Redbook, Micromedex, Martindale)
___________________
4 An executive order from April 15, 2025, requested that the HHS secretary work with Congress to eliminate differences between the treatment of small molecules and biologics under the Medicare Drug Price Negotiation Program. https://www.whitehouse.gov/presidential-actions/2025/04/lowering-drug-prices-by-once-again-putting-americans-first/ (accessed May 22, 2025).
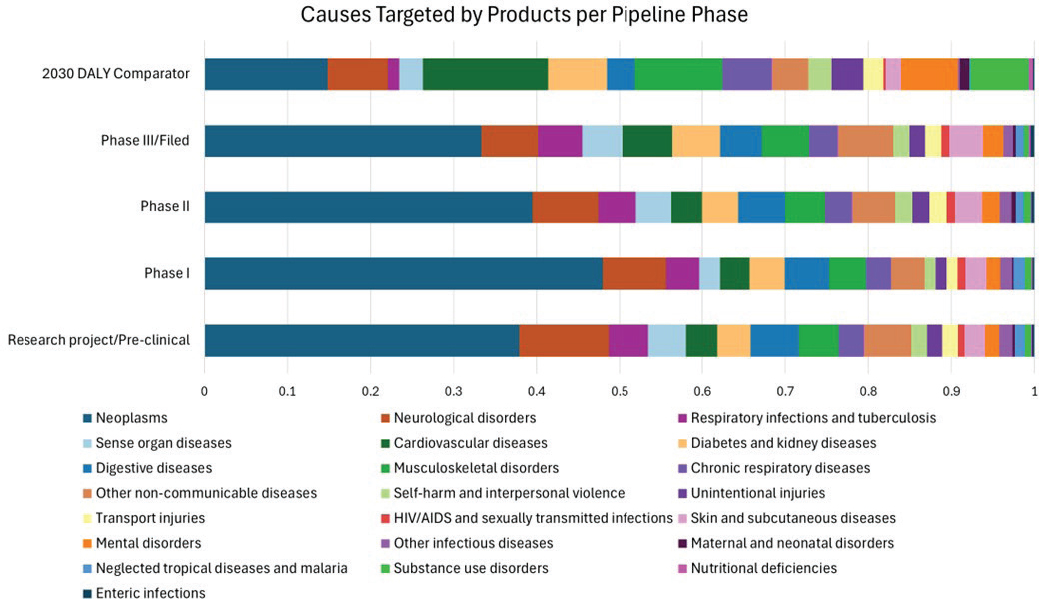
NOTES: The top bar indicates the proportion of total U.S. DALYs that each of 22 disease categories contributes. The top bar provides a comparison to each of the other bars, which show the proportion of products in the development pipeline from preclinical research through phase III across all 6,576 pharmaceutical companies analyzed.
SOURCE: Adapted from IHME data, 2025.
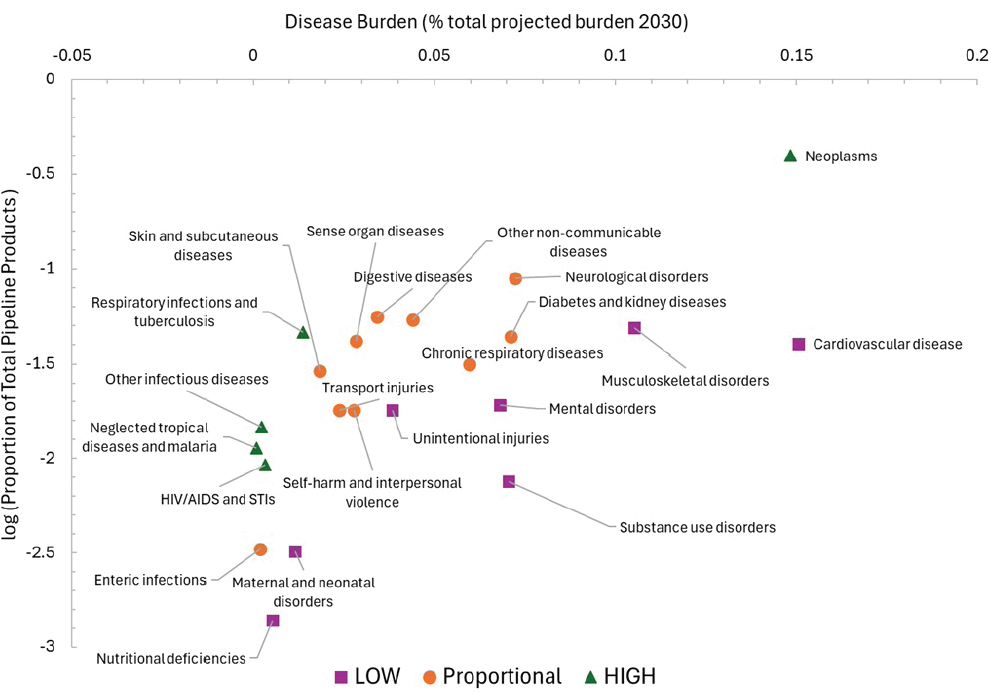
SOURCE: Adapted from IHME data, 2025.
for a total of 6,576 pharmaceutical companies.5 ChatGPT was prompted to code, or match, prescribed drug use to most likely disease cause. The distribution of these drug–use pairs was compared to the distribution of DALYs across 22 disease areas to assess mismatch. (See Appendix D for more detailed methodology.)
The results indicate substantial private-sector investment in neoplasms, or tumors. This may be attributable in part to high unmet need in cancer treatment and the low rate of success in developing new effective treatments in oncology—potentially warranting greater investment. Policies, such as Medicare Part B reimbursement, also shape the incentive and decision-making structure around the development of oncology therapies. Neurological diseases also account for a large number of the treatments in development, though the investment appears relatively proportional to burden. Other areas with high investment relative to proportion of DALYs include HIV/AIDS and sexually transmitted infections, neglected tropical diseases, respiratory infections and tuberculosis, and other infectious diseases. For some of these diseases, such as HIV/AIDS, tropical diseases, and tuberculosis, investment could be responding to high global burden of disease.
Areas with comparatively low private investment are nutritional deficiencies, maternal and neonatal disorders, mental health disorders, substance use disorders, cardiovascular diseases, and unintentional injuries. Taking cardiovascular disease as an example, a number of factors could explain the seeming underinvestment. The clinical trials required are large, lengthy, and expensive, and generic treatments already on the market reduce market incentives for developing new therapies that further address residual unmet need. Although cardiovascular disease represents a large potential market for new treatments, the market is already partially satisfied by existing, effective treatments, and low-cost generics can limit uptake of newer, more expensive options. However, good therapeutic options may not be fully used, leaving a gap in unaddressed disease burden. While innovative therapies could be helpful, innovation may not be the primary solution if access and underuse of existing therapeutics remain problems.
As noted previously with the NIH funding assessment, aggregate disease categories could obscure what is happening for specific diseases. Taking neoplasms for example, some types of cancer could be driving the large investment numbers while others are relatively neglected. A breakdown by cancer type shows significant variation (Figure 3-5). According to this analysis, cancers with underinvestment relative to projected burden include tracheal, bronchus, and lung, as well as colon, rectum, and prostate. Even this more detailed assessment is limited because it does not further
___________________
5 Lim et al., forthcoming.
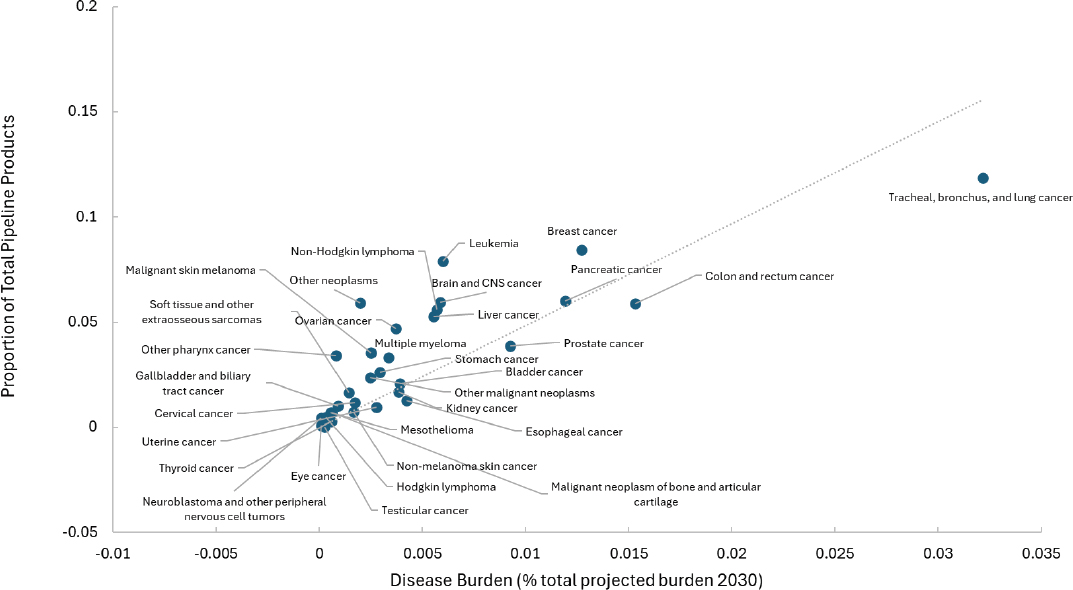
SOURCE: Adapted from IHME data.
disaggregate by cancer stage, nor does it include data that are not publicly available from small biotech companies, larger pharmaceutical corporations, or foundations. Other studies have shown underinvestment in early-stage cancer treatments and preventatives (Budish et al., 2015).
Comparing Private and Public Investment
Similar to the case with the NIH funding assessment, these data indicate substantial investment in HIV/AIDS and neurological disorders and underinvestment in cardiovascular disease relative to burden. There is more private than public investment in skin and subcutaneous diseases and greater public investment in mental health disorders. Cancers, including prostate, colon and rectum, and lung, have fewer pipeline drugs but have approximately proportional NIH funding. This could indicate that public and private investment are complementary in these disease areas, or that there is a component of degree of scientific knowledge to develop compounds for the different diseases. Of note, comparisons between private and public investments are difficult to carry out, given that the analyses of these investments use both different metrics for investment (the number of products in the development pipeline for private investment versus federal support in dollars for public investment) and different disease categories. For example, IHME private-sector assessment uses 22 categories, while the NIH funding analysis includes 59.
Limitations of Data Available on Private-Sector Investment
In general, it is challenging to assess private-sector investment because of the lack of accessible data. For-profit companies are not incentivized to be forthcoming about the underlying financial details for their investments, and it is difficult to get a sense of what developments are early in the pipeline. It is also a dynamic space that can change rapidly, as with a new discovery. Not only is it hard to predict how the landscape of therapeutic development will change by 2030, but it is also difficult to tell from these data which gaps are related to unmet need versus market forces or other drivers.
Given these challenges, assessments of private investment typically use proxies, such as the number of products, patents, or clinical trials, to assess current and projected relative investments, but these data do not give a full understanding of where companies are directing their efforts. The IHME data described above rely on the availability of information on the number of pipeline pharmaceutical products and their uses. As these say nothing about the dollar amounts invested, the data cannot be directly compared with or combined with the NIH funding assessment or other analyses. These data also do not include products already on the market, which could
provide insight into the dimension of unmet need or how past investments have contributed to the current landscape of available therapies. It is possible that some therapeutic areas with fewer products in the development pipeline have effective on-market treatments that are not accounted for in this cross-sectional analysis. Longitudinal data on investment trends would be helpful for addressing this limitation. In addition, this dataset includes information on all pharmaceutical companies at the time of analysis, including companies outside the United States, so some of these products do not reflect U.S. investment and may not be made for the U.S. market. Additional, more specific data would be useful to develop a more comprehensive picture of private-sector investment.
Finding 3-1: Characterizing past, current, and future priorities for investments in therapeutic innovation is multidimensional and complicated, especially given the longitudinal nature of research and development. Many of the data needed for this purpose are not publicly available. Some high-level data on industry investment are available, but the granularity of this information is limited.
ADDITIONAL FACTORS TO CONSIDER
Disease burden encompasses multiple dimensions, including both population-level and individual-level impact (see Chapter 2). Considering individual burden draws attention to the significant unmet medical need in rare diseases—conditions that have low prevalence but high individual burden and for which there are often no effective treatments. A rare disease, by definition, affects fewer than 200,000 people in the United States, but in the aggregate, these conditions affect more than 30 million people in the United States (FDA, 2024). Of an estimated 7,000–10,000 rare diseases, only 5 percent have FDA-approved treatments, and many of these disorders are life threatening (Fermaglich and Miller, 2023).
Several other important factors could be overlooked in the data-driven approaches to assessing mismatch and prioritizing investment that have been described thus far in this chapter. Some conditions could be underrepresented or absent in these datasets, such as disease areas where there is contested diagnosis, a lack of effective diagnostics, or limited information (Adams et al., 2024). In addition, unmet need, one of this committee’s focal points, is difficult to quantify when compared with burden or investment metrics. In some cases, therapeutic gaps persist because of the complexity of the underlying biology or gaps in scientific knowledge (Elmore et al., 2021). As discussed in more detail in Chapter 2, unmet need can exist because of a lack of effective therapeutics as well as a lack of health care access.
Health equity is another important factor to consider. Health disparities persist among racial and ethnic groups for many conditions in the United States (IOM, 2003; NASEM, 2024), as well as across other demographics, including rural/urban, age, and gender. While a condition may have existing therapeutic options, there may be unaddressed need if some groups do not have access to them. As another example, many therapies remain inaccessible to populations outside of urban medical centers, and investment in novel treatments or delivery mechanisms could address unmet need and improve health for some underserved groups and conditions. (NASEM, 2018).
Current approaches for assessing mismatch typically focus on the resulting diseases, but therapeutic targets could also include upstream risk factors such as obesity or smoking. Risk factors could be another lens through which to assess mismatch or identify areas for innovation. Lastly, a comprehensive assessment of mismatch between investment and burden should incorporate a future-oriented perspective, especially regarding up and coming technologies where innovative approaches can have significant effect.
PRIORITIZATION METHODS IN THE LITERATURE
Difficult decisions have to be made to prioritize among many competing therapeutic areas with high unmet need. There are a number of different approaches to research priority setting that vary in how they incorporate evaluation criteria, weight different normative values, and involve stakeholders. Millum (2024) provides a useful review of specific methods in the literature. Millum emphasizes that there is largely consensus on the two main objectives of research priority setting—maximizing population health benefits and improving equitable distribution of those benefits. However, there is disagreement in the literature over more detailed questions and process criteria. Importantly, how a research priority setting exercise is conducted, and who is involved, will shape outcomes, which could have important ethical implications (Millum, 2024). Those setting research priorities often account in some way for the relative level of disease burden and unmet need. In addition, some argue that projected burden for future populations should also be taken into account (Pierson, 2024).
Recognizing the complexities of assessing alignment among investment, burden, and unmet need, several groups have developed methods for prioritizing investment across various disease areas; a few examples follow. The Child Health and Nutrition Research Initiative’s method involves a survey of a large number of experts, a set of criteria to rank their research priorities, and, depending on the goal of the selection, potentially involving funders or government bodies in the process (Millum, 2024). The Essential Health National Research Strategy—designed by the Council on Health Research and Development—convenes a national workshop of stakeholders
(e.g., researchers, health service providers, private-sector professionals, potential donors). The working group then conducts a “situational analysis” to determine an initial list of research ideas that are later ranked based on a set of criteria and a scoring method agreed upon by the group (Millum, 2024).
The Milken Institute’s FasterCures worked with representatives from the Centers for Disease Control and Prevention, NIH, FDA, the Office of the Assistant Secretary for Health, and others to develop a quantitative framework to identify and prioritize opportunities in biomedical product innovation. Gressler and colleagues (2023) selected a pilot list of 13 disease conditions based on the highest mortality, prevalence, and years lived with disability metrics. For each disease, the authors calculated the overall gap of innovation by using a public health burden score, health care cost score, and biomedical product innovation score—each score comprising multiple metrics (Gressler et al., 2023). This process identified diabetes, osteoarthritis, and drug use disorders as having the highest overall gap score. In addition, conditions with the lowest innovation despite significant burden included such chronic conditions as chronic kidney disease, chronic obstructive pulmonary disease, and cirrhosis and other liver diseases. The analysis sought to bring together multiple metrics to assess not only burden but also health care cost, public investment, and private investment (Gressler et al., 2023). This committee’s statement of task does not include an assessment of health care cost and access, but the multifaceted approach could prove a useful example for future analysis as well.
The World Health Organization’s (WHO’s) foundational 1996 Ad Hoc Committee on Health Research Relating to Future Intervention Options developed a research prioritization method by convening technical experts to consider five questions regarding a health problem and assess its research gaps (WHO, 1996). The committee adapted this model to create a list of questions relevant to the statement of task’s focus on U.S. disease burden and unmet need (Table 3-1). These questions may be helpful for assessing mismatch and priority setting, although data may not be readily available for all of these considerations.
CHAPTER CONCLUSION
This chapter reviewed evidence on how well public and private investment in therapeutic development align with disease burden and unmet need. The committee found:
Finding 3-2: There are some existing data on disease burden, unmet need, and investment; however, these data are not regularly compiled and synthesized for assessing mismatch across factors. In addition, existing data are sometimes insufficient and have significant gaps. As a
TABLE 3-1 Questions to Inform Research Priority Setting
| WHO, 1996. 5-Step Process to Inform R&D Resource Allocation | Key Questions Adapted for This Report |
|---|---|
|
Step 1: How big is the health problem? Calculate the burden attributable to the disease, condition, or risk factor.
Step 2: Why does the disease burden persist? Identify reasons for the persistence of the burden of the disease or condition in a population. Step 3: Is enough known about the problem now to consider possible interventions? Judge the adequacy of the current knowledge base. Step 4: How cost-effective will these interventions be?a Assess the promise of the R&D effort. Step 5: How much is already being done about the problem? Assess the current level of effort. |
What is the burden of disease based on occurrence (incidence, prevalence, severity, duration) and impact (on quality of life, economically on an individual, on caregivers, society, etc.)? How is it measured (e.g., DALYs)? Consider how population burden and impact may vary (e.g., high prevalence/moderate impact; low prevalence/high impact).
What is the level and type of unmet need?
What is the current level of investment, and does it address the level of burden and unmet need? What are the barriers or challenges to innovation in therapeutic development for this therapeutic area (e.g., scientific challenges, market forces)?b What are potential strategies to spur innovation?c |
a This committee’s statement of task did not include assessment of cost-effectiveness.
b See the committee’s discussion of barriers driving mismatch in Chapter 4.
c See Chapter 5 for a discussion of strategies and Chapter 6 for this committee’s recommendations.
SOURCE: Parts of this table are adapted from Box S-2 in WHO, 1996. © Copyright World Health Organization (WHO), 2021. All Rights Reserved.
result, this committee lacked the data needed to produce a report that evaluates all aspects of disease burden, unmet need, and investment to fully assess the mismatch.
Taken together, the evidence suggests underinvestment relative to burden in some chronic conditions such as cardiovascular disease and
COPD. The committee’s analysis of NIH funding versus disease burden (DALYs rate) also highlighted lower public investment in such conditions as headaches, neck and back pain, psoriasis, and gallbladder diseases. The sources on private-sector investment, though limited, indicate substantial investment in oncology and neurological disease and suggest underinvestment in cardiovascular disease and maternal and neonatal conditions. The following chapter will take a closer look at specific drivers that contribute to mismatches among investment, burden, and unmet need.
The analysis in this chapter reinforces the claim that the metrics and methodology used make a difference in which conditions appear most underinvested, emphasizing the need for a systematic, multifaceted assessment. As discussed, there are a number of limitations to the data available for this purpose. These limitations make it challenging to draw firm conclusions about mismatch and investment and underscore the need for better data and tracking. Moreover, no systematic, comprehensive reporting regularly occurs on the alignment between burden and investment. A commitment to regular collation and synthesis of data and to regular updating and reporting would help create a public good that is foundational to the goal of improving alignment between investments in innovation and unmet need. Furthermore, if public resources are used to collect this data, it is important that these data be made public, to the extent possible, to inform public health research. The use of public resources obligates the government to provide these data in a timely manner and reduce barriers to data access. A robust, timely, publicly accessible data system is key to implementing recommended changes in policies and practice that can deliver better health outcomes from the resources invested in innovation. Accordingly, the committee concludes:
Conclusion 3-1: More comprehensive, specific, timely, and accurate data on disease burden, unmet need, and innovation, as well as improved data aggregation, are essential for private and public funders to systematically use measures of disease burden and unmet need when making decisions about funding priorities.
Conclusion 3-2: Collecting and aggregating these data requires ongoing stewardship to most effectively address unmet clinical need and reduce health disparities.
Conclusion 3-3: The U.S. government has a responsibility to ensure that timely data on public investment and population health data be made publicly available to support research and strategic investment in areas of unmet need.
REFERENCES
Adams, D. R., C. D. M. van Karnebeek, S. B. Agulló, V. Faùndes, S. S. Jamuar, S. A. Lynch, G. Pintos-Morell, R. D. Puri, R. Shai, C. A. Steward, B. Tumiene, and A. Verloes. 2024. Addressing diagnostic gaps and priorities of the global rare diseases community: Recommendations from the IRDiRC Diagnostics Scientific Committee. European Journal of Medical Genetics 70:104951.
Ballreich, J. M., C. P. Gross, N. R. Powe, and G. F. Anderson. 2021. Allocation of National Institutes of Health funding by disease category in 2008 and 2019. JAMA Network Open 4(1):e2034890.
Best, R. K. 2012. Disease politics and medical research funding. American Sociological Review 77(5):780–803.
Budish, E., B. N. Roin, and H. Williams. 2015. Do firms underinvest in long-term research? Evidence from cancer clinical trials. American Economic Review 105(7):2044–2085.
Congressional Research Service. 2023. National Institutes of Health (NIH) funding: FY1996-FY2023, updated March 8, 2023. https://crsreports.congress.gov/product/pdf/R/R43341/45 (accessed April 13, 2025).
Congressional Research Service. 2024. National Institutes of Health (NIH) Funding: FY1996-FY2025. https://www.congress.gov/crs-product/R43341 (accessed May 21, 2025).
Ehrhardt, S., L. J. Appel, and C. L. Meinert. 2015. Trends in National Institutes of Health funding for clinical trials registered in ClinicalTrials.Gov. JAMA 314(23):2566.
Elmore, L. W., S. F. Greer, E. C. Daniels, C. C. Saxe, M. H. Melner, G. M. Krawiec, W. G. Cance, and W. C. Phelps. 2021. Blueprint for cancer research: Critical gaps and opportunities. CA: A Cancer Journal for Clinicians 71(2):107–139.
Fermaglich, L. J., and K. L. Miller. 2023. A comprehensive study of the rare diseases and conditions targeted by orphan drug designations and approvals over the forty years of the Orphan Drug Act. Orphanet Journal of Rare Diseases 18(1):163.
FDA (Food and Drug Administration). 2024. Rare diseases at the FDA. https://www.fda.gov/patients/rare-diseases-fda (accessed March 20, 2025).
FDA. 2025. Advancing health through innovation: New drug therapy approvals 2024. https://www.fda.gov/drugs/novel-drug-approvals-fda/novel-drug-approvals-2024 (accessed May 15, 2025).
Galkina Cleary, E., J. M. Beierlein, N. S. Khanuja, L. M. McNamee, and F. D. Ledley. 2018. Contribution of NIH funding to new drug approvals 2010-2016. Proceedings of the National Academy of Sciences 115(10):2329–2334.
Galkina Cleary, E., M. J. Jackson, E. W. Zhou, and F. D. Ledley. 2023. Comparison of research spending on new drug approvals by the National Institutes of Health vs. the pharmaceutical industry, 2010–2019. JAMA Health Forum 4(4):e230511.
Gandjour, A. 2024. Inclusion of phase III clinical trial costs in health economic evaluations. BMC Health Services Research 24(1):1158.
Gillum, L. A., C. Gouveia, E. R. Dorsey, M. Pletcher, C. D. Mathers, C. E. McCulloch, and S. C. Johnston. 2011. NIH disease funding levels and burden of disease. PLoS ONE 6(2):e16837.
Gressler, L. E., K. Crowley, E. Berliner, H. Leroy, E. Krofah, B. Eloff, D. Marinac-Dabic, and M. Vythilingam. 2023. A quantitative framework to identify and prioritize opportunities in biomedical product innovation: A proof-of-concept study. JAMA Health Forum 4(5):e230894.
Gupta, R. S., C. M. Warren, B. M. Smith, J. Jiang, J. A. Blumenstock, M. M. Davis, R. P. Schleimer, and K. C. Nadeau. 2019. Prevalence and severity of food allergies among US adults. JAMA Network Open 2(1):e185630.
IOM (Institute of Medicine). 2003. Unequal treatment: Confronting racial and ethnic disparities in health care. Washington, DC: The National Academies Press.
IQVIA. 2023. Global trends in R&D 2023: Activity, productivity, and enablers. IQVIA Institute for Human Data Science. https://www.iqvia.com/insights/the-iqvia-institute/reports-and-publications/reports/global-trends-in-r-and-d-2023 (accessed April 13, 2025).
IQVIA. 2025. Proliferation of innovation over time. IQVIA Institute for Human Data Science. https://www.iqvia.com/insights/the-iqvia-institute/reports-and-publications/reports/proliferation-of-innovation-over-time (accessed April 13, 2025).
Kang, S.-Y., M. Liu, J. Ballreich, R. Gupta, and G. Anderson. 2024. Biopharmaceutical pipeline funded by venture capital firms, 2014 to 2024. Health Affairs Scholar 2(10):qxae124.
Kassir, Z., A. Sarpatwari, B. Kocak, C. C. Kuza, and W. F. Gellad. 2020. Sponsorship and funding for gene therapy trials in the United States. JAMA 323(9):890.
Kantarjian, H. M., T. Fojo, M. Mathisen, and L. A. Zwelling. 2013. Cancer drugs in the United States: Justum pretium—the just price. Journal of Clinical Oncology 31(28):3600–3604.
Kocher, R., and B. Roberts. 2014. The calculus of cures. New England Journal of Medicine 370(16):1473–1475.
Light, D. W., and R. Warburton. 2011. Demythologizing the high costs of pharmaceutical research. BioSocieties 6(1):34–50.
Millum, J. 2024. Ethics and health research priority setting: A narrative review [version 1; peer review: 2 approved]. Wellcome Open Research 9:203.
Moses, H., III, D. H. M. Matheson, S. Cairns-Smith, B. P. George, C. Palisch, and E. R. Dorsey. 2015. The anatomy of medical research: US and international comparisons. JAMA 313(2):174–189.
NASEM (National Academies of Sciences, Engineering, and Medicine). 2018. 2. Factors That Affect Health-Care Utilization. In Health-care utilization as a proxy in disability determination. Washington, DC: The National Academies Press. Pp. 21-38
NASEM. 2024. Unequal treatment revisited: The current state of racial and ethnic disparities in health care: Proceedings of a workshop. Washington, DC: The National Academies Press.
NCI (National Cancer Institute). n.d. Cancer facts & the war on cancer. https://training.seer.cancer.gov/disease/war/ (accessed March 18, 2025).
NIH (National Institutes of Health). 2023. Background—NIH peer review process. https://grants.nih.gov/policy/peer/simplifying-review/background.htm (accessed April 13, 2025).
NIH. 2024. Mission and goals. https://www.nih.gov/about-nih/what-we-do/mission-goals (accessed May 21, 2025).
NIH RePORT (Research Portfolio and Online Reporting Tools). n.d. RCDC: Categorization process. https://report.nih.gov/funding/categorical-spending/rcdc-process (accessed May 21, 2025).
Ouellette, L. L., and B. N. Sampat. 2024. Using Bayh-Dole Act march-in rights to lower US drug prices. JAMA Health Forum 5(11):e243775.
OMB (Office of Management and Budget). 2025. Letter to Susan Collins, chair of the Committee on Appropriations. https://www.whitehouse.gov/wp-content/uploads/2025/05/Fiscal-Year-2026-Discretionary-Budget-Request.pdf (accessed May 30, 2025).
Pierson, L. 2024. Accounting for future populations in health research. Bioethics 38(5):401–409.
Rees, C. A., M. C. Monuteaux, V. Herdell, E. W. Fleegler, and F. T. Bourgeois. 2021. Correlation between National Institutes of Health funding for pediatric research and pediatric disease burden in the US. JAMA Pediatrics 175(12):1236.
Rome, B. N., A. S. Kesselheim, and W. B. Feldman. 2024. Medicare’s first round of drug-price negotiation—Measuring success. New England Journal of Medicine 391(20):1865–1868.
Sansweet, S., C. Rolling, M. Ebisawa, J. Wang, R. Gupta, and C. M. Davis. 2024. Reaching communities through food allergy advocacy, research, and education: A comprehensive analysis. Journal of Allergy and Clinical Immunology: In Practice 12(2):310–315.
SiRM (Strategies in Regulated Markets), L.E.K. Consulting, and RAND Europe. 2022. The financial ecosystem of pharmaceutical R&D: An evidence base to inform further dialogue. https://www.rand.org/content/dam/rand/pubs/external_publications/EP60000/EP68954/RAND_EP68954.pdf (accessed May 30, 2025).
Stoelinga, J., L. T. Bloem, M. Russo, A. S. Kesselheim, and W. B. Feldman. 2024. Comparing supplemental indications for cancer drugs approved in the U.S. and EU. European Journal of Cancer 212:114330.
Wang, D., B. Liu, and Z. Zhang. 2023. Accelerating the understanding of cancer biology through the lens of genomics. Cell 186(8):1755–1771.
WHO (World Health Organization). 1996. Investing in health research and development: Report of the Ad Hoc Committee on Health Research Relating to Future Intervention Options. Geneva, Switzerland: World Health Organization. https://iris.who.int/handle/10665/63024 (accessed April 13, 2025).
This page intentionally left blank.


