Suggested Citation:
"Appendix C: Nationwide Survey Results." National Academies of Sciences, Engineering, and Medicine. 2025. Investigation of Tools and Technology for Roadside Vegetation Asset Management. Washington, DC: The National Academies Press.
doi: 10.17226/29248.
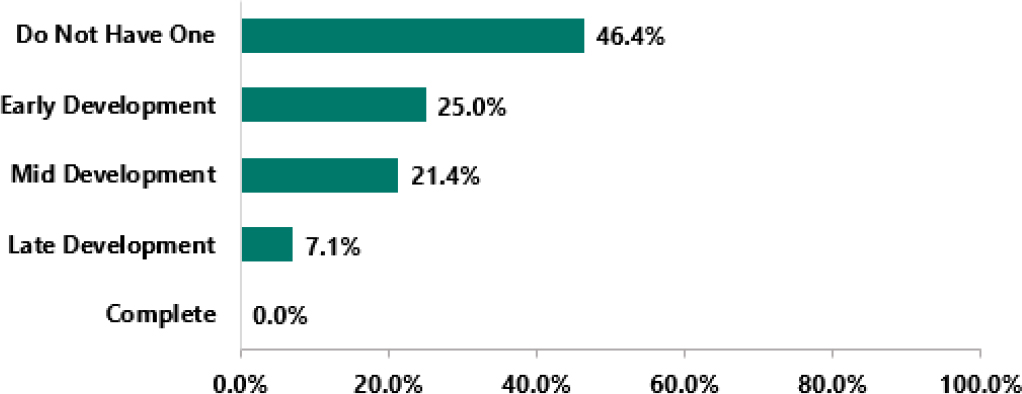
Figure C-1: Respondents were asked what the status of roadside vegetative asset management plans were within their DOT. There were twenty-eight respondents.Figure C-2: The percentage of twenty-six respondents who utilize tools and technology for determining vegetation management.
Suggested Citation:
"Appendix C: Nationwide Survey Results." National Academies of Sciences, Engineering, and Medicine. 2025. Investigation of Tools and Technology for Roadside Vegetation Asset Management. Washington, DC: The National Academies Press.
doi: 10.17226/29248.
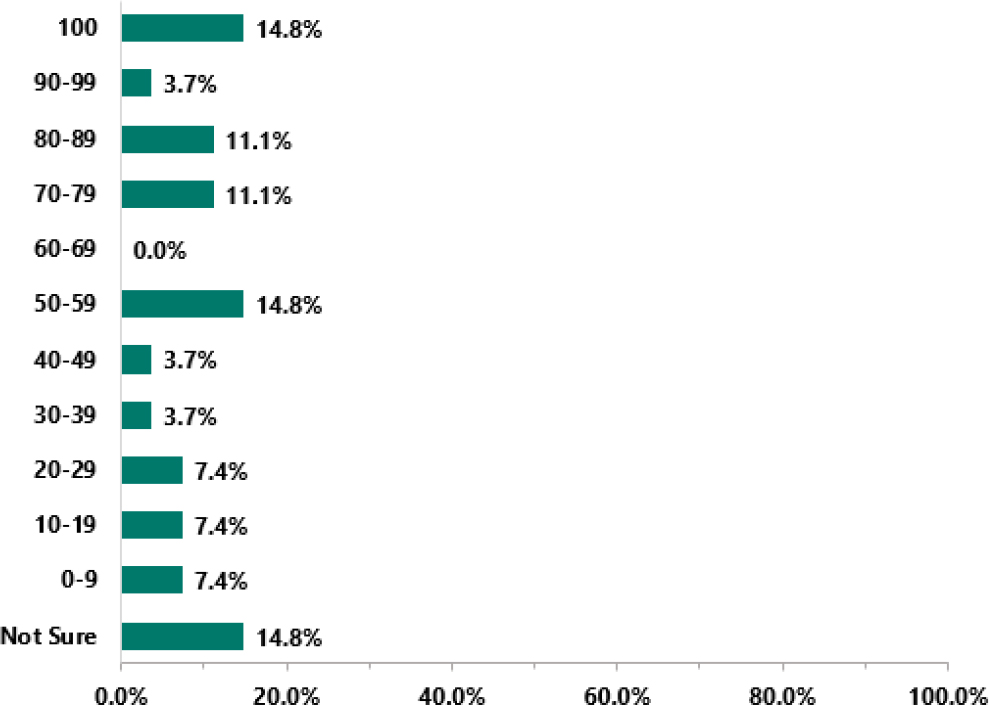
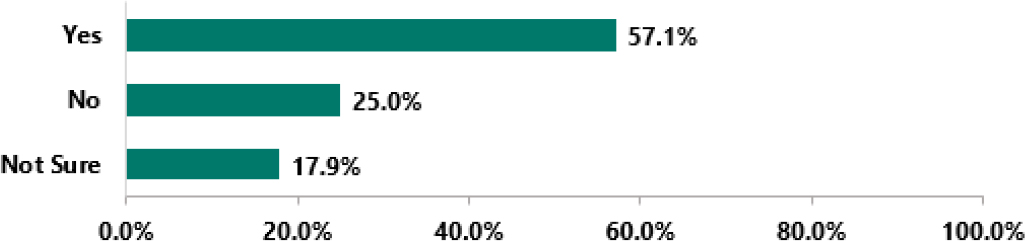
Figure C-3: The amount of Roadside Vegetation Asset Management work that is completed by in-house staff. Twenty-seven organizations responded to this question.Figure C-4: The percentage of twenty-eight respondents who have implemented new software or hardware within the past ten years.
Suggested Citation:
"Appendix C: Nationwide Survey Results." National Academies of Sciences, Engineering, and Medicine. 2025. Investigation of Tools and Technology for Roadside Vegetation Asset Management. Washington, DC: The National Academies Press.
doi: 10.17226/29248.
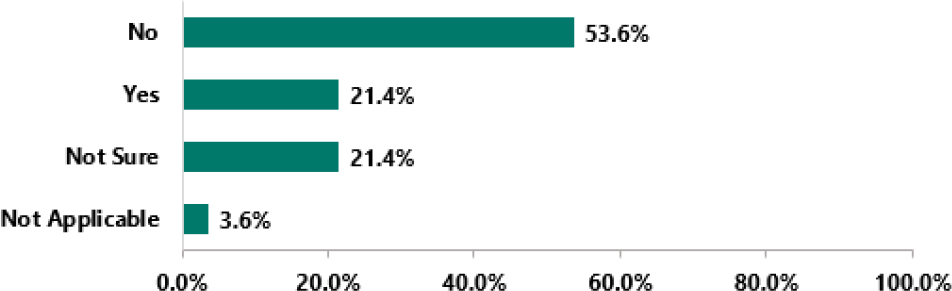
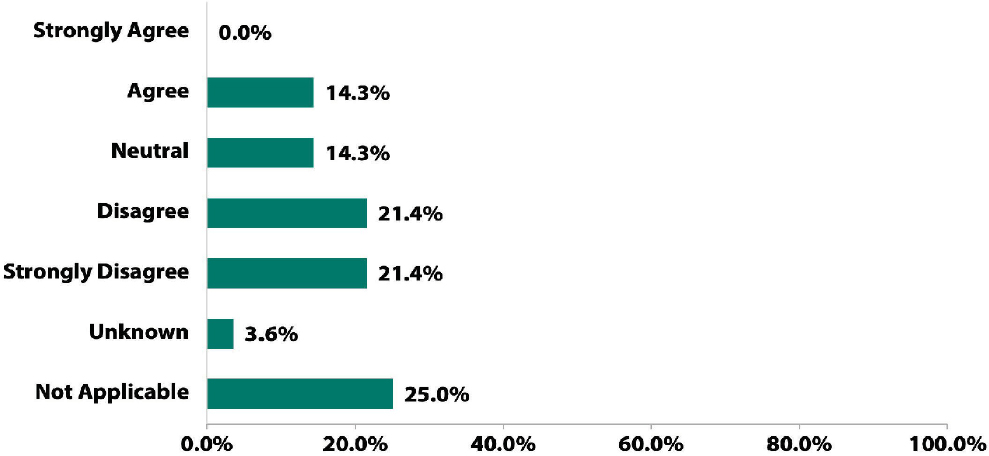
Figure C-5: The percentage of twenty-eight respondents who are currently piloting new vegetation asset management equipment.Figure C-6: The percentage of twenty-eight respondents who agreed or disagreed that they are currently measuring what they need to with current mapping procedures. Only 14% of respondents stated that their organization was measuring what it needed to with the current mapping system.
Suggested Citation:
"Appendix C: Nationwide Survey Results." National Academies of Sciences, Engineering, and Medicine. 2025. Investigation of Tools and Technology for Roadside Vegetation Asset Management. Washington, DC: The National Academies Press.
doi: 10.17226/29248.
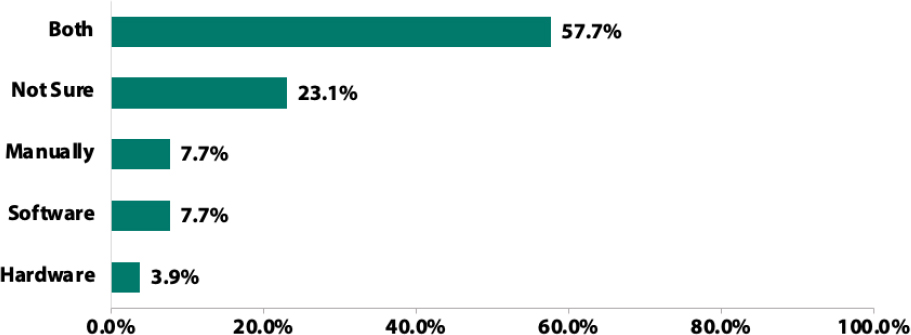
Figure C-7: Twenty-six respondents identified if the mapping of vegetation assets is completed manually or through software or hardware. Most respondents stated that their organization completes mapping through both manual and software/hardware.
Suggested Citation:
"Appendix C: Nationwide Survey Results." National Academies of Sciences, Engineering, and Medicine. 2025. Investigation of Tools and Technology for Roadside Vegetation Asset Management. Washington, DC: The National Academies Press.
doi: 10.17226/29248.
Figure C-8: Type of software or hardware currently being utilized by DOTs nationwide for RVAM. There were twenty-four respondents.
Suggested Citation:
"Appendix C: Nationwide Survey Results." National Academies of Sciences, Engineering, and Medicine. 2025. Investigation of Tools and Technology for Roadside Vegetation Asset Management. Washington, DC: The National Academies Press.
doi: 10.17226/29248.
Figure C-9: Vegetative assets tracked regularly by state DOTs. There were twenty-eight respondents.
Suggested Citation:
"Appendix C: Nationwide Survey Results." National Academies of Sciences, Engineering, and Medicine. 2025. Investigation of Tools and Technology for Roadside Vegetation Asset Management. Washington, DC: The National Academies Press.
doi: 10.17226/29248.
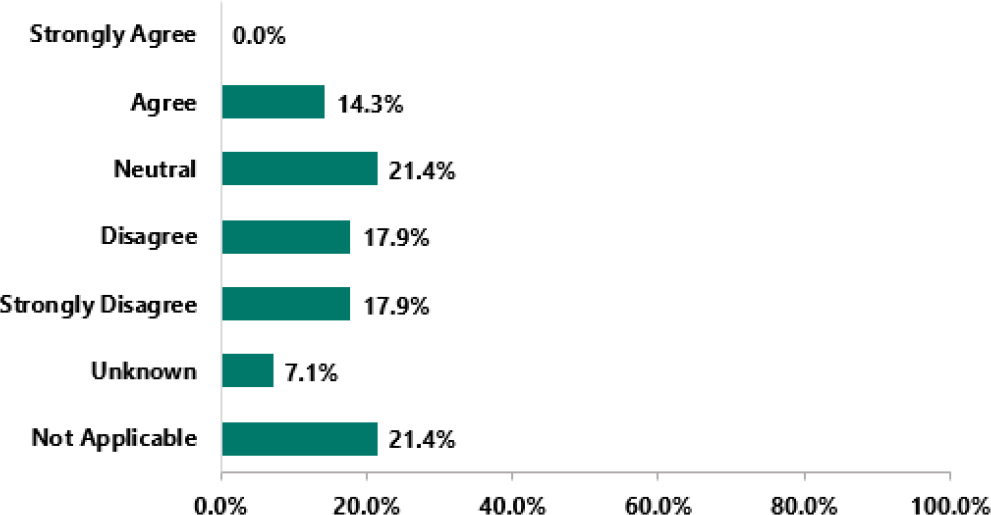
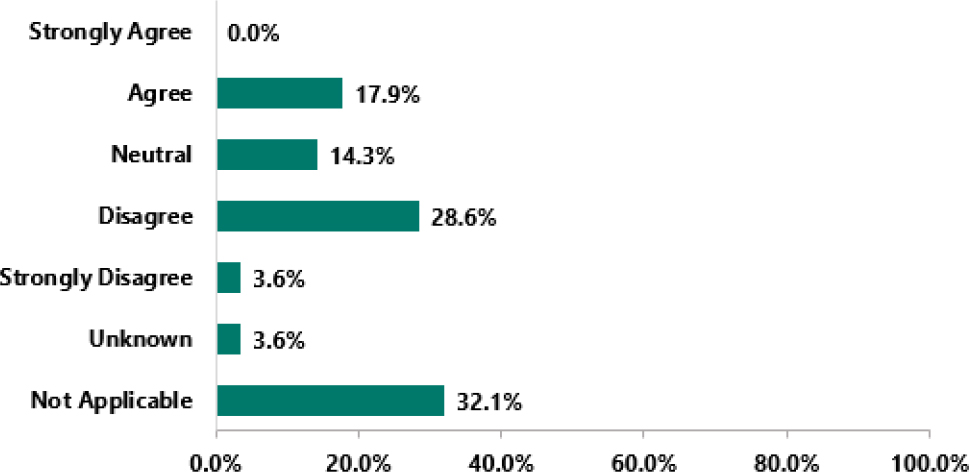
Figure C-10: The percentage of twenty-eight respondents who agreed or disagreed that their organization supplements land management records with maps.Figure C-11: The percentage of twenty-eight respondents who agreed or disagreed that vegetative asset information is updated with each maintenance visit.
Suggested Citation:
"Appendix C: Nationwide Survey Results." National Academies of Sciences, Engineering, and Medicine. 2025. Investigation of Tools and Technology for Roadside Vegetation Asset Management. Washington, DC: The National Academies Press.
doi: 10.17226/29248.
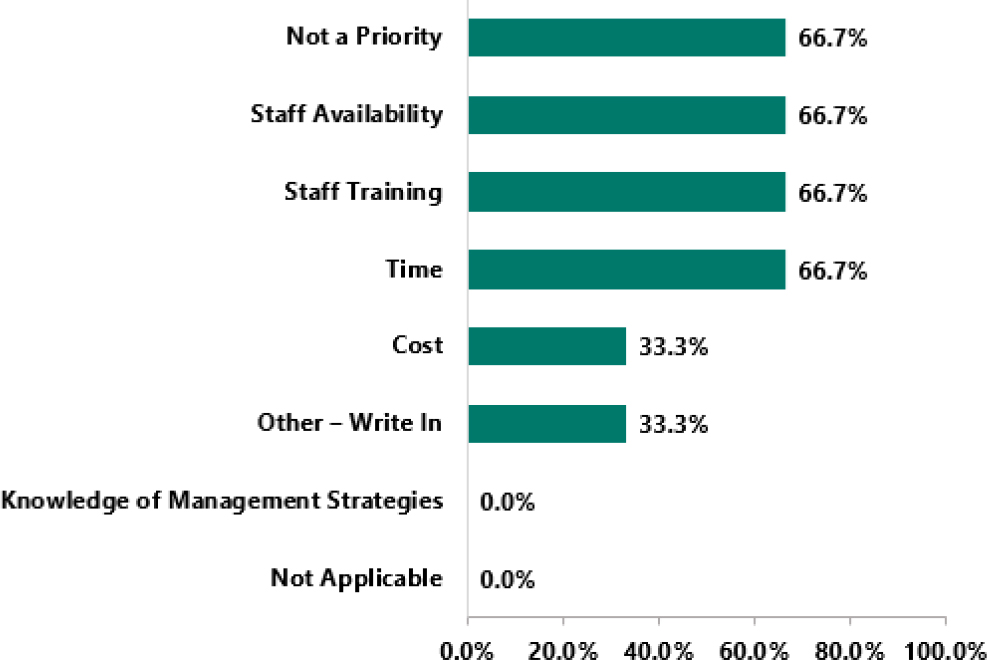
Figure C-12: Respondents identified what has prevented the development of an RVAM plan or progression in vegetation asset management. Three respondents answered the survey question that asked what prevented the development of the RVAM plan or prevented the progression of the RVAM plan.
Targeted Survey
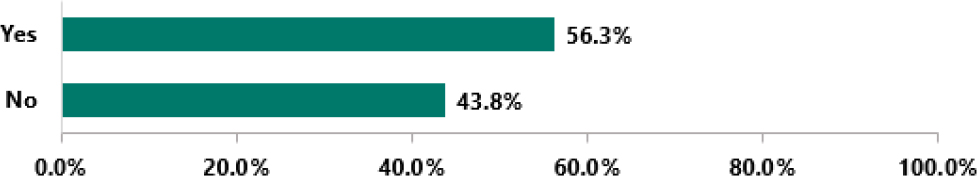
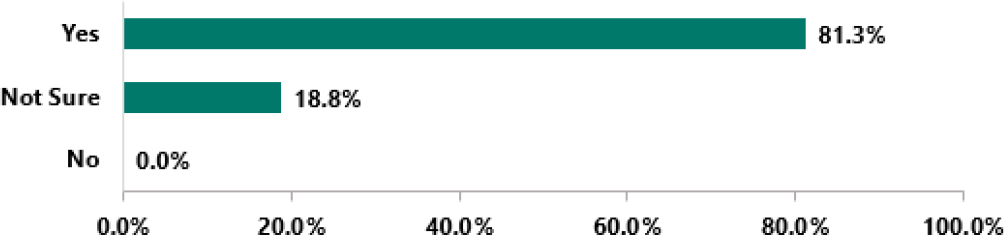
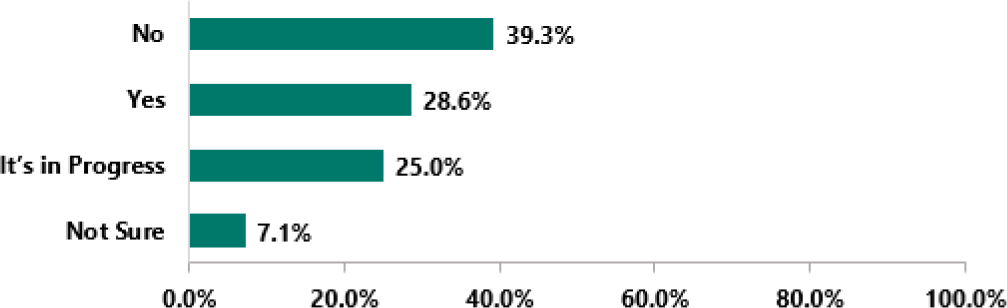
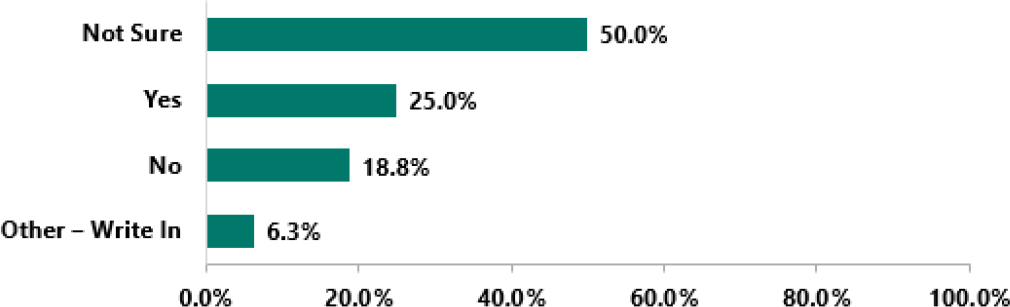
Figure C-13: Respondents were asked if their state DOT had purchased tools and technology to complete RVAM. There were sixteen respondents.
Suggested Citation:
"Appendix C: Nationwide Survey Results." National Academies of Sciences, Engineering, and Medicine. 2025. Investigation of Tools and Technology for Roadside Vegetation Asset Management. Washington, DC: The National Academies Press.
doi: 10.17226/29248.
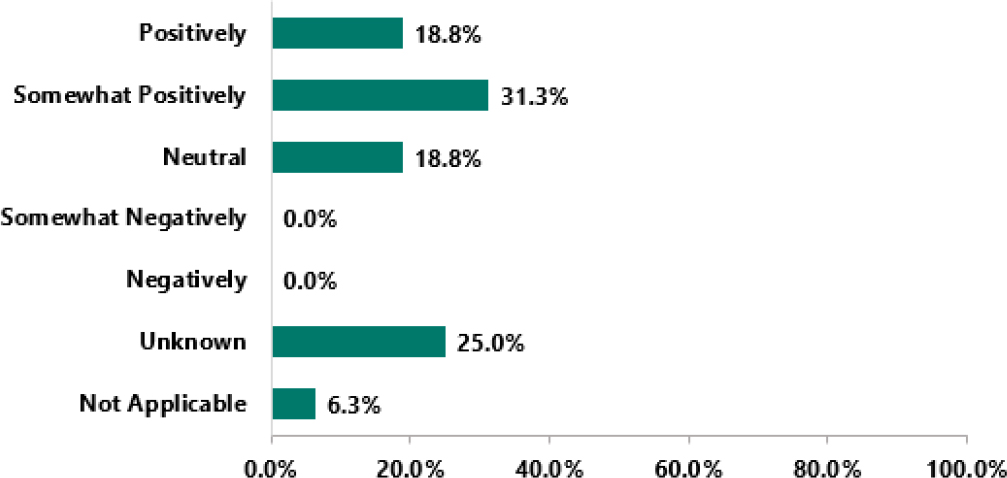
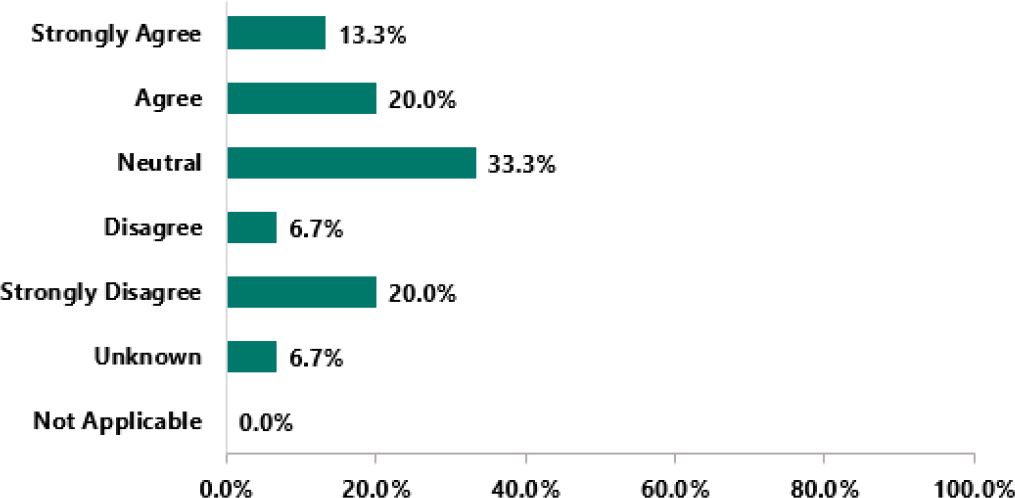
Figure C-14: Respondents were given a variation of a Likert response where answers ranged from positively to negatively for what type of impact the implementation of new tools and technology has had on the financial return on investments (ROI). There were sixteen respondents.
Suggested Citation:
"Appendix C: Nationwide Survey Results." National Academies of Sciences, Engineering, and Medicine. 2025. Investigation of Tools and Technology for Roadside Vegetation Asset Management. Washington, DC: The National Academies Press.
doi: 10.17226/29248.
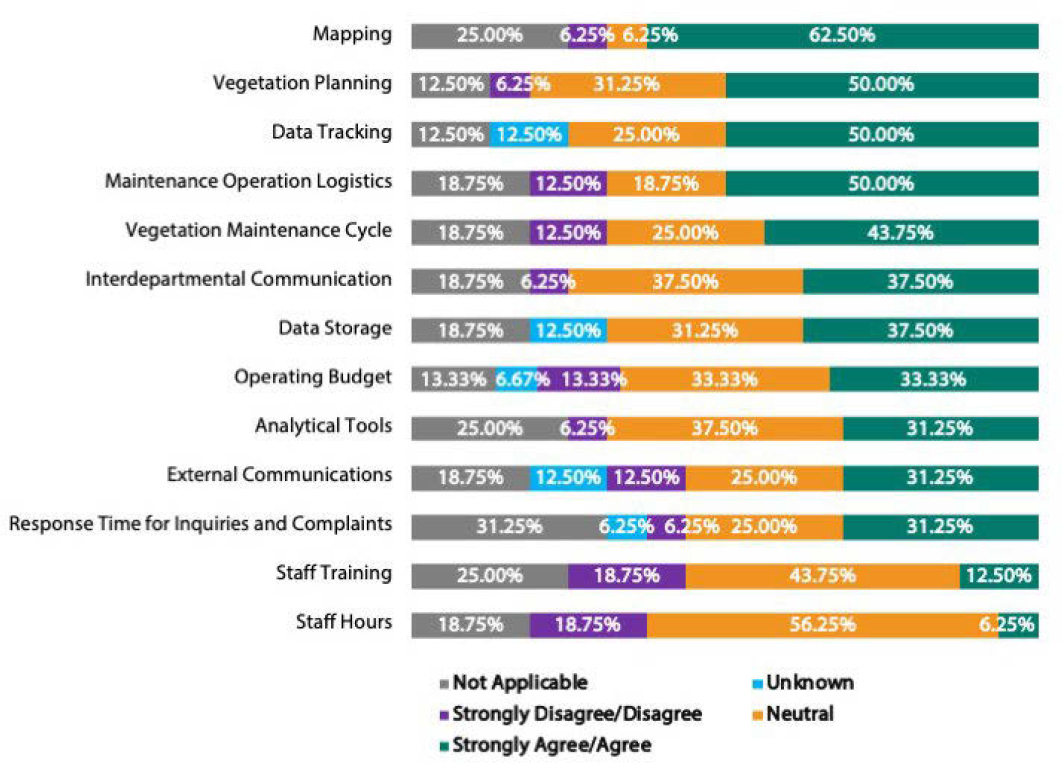
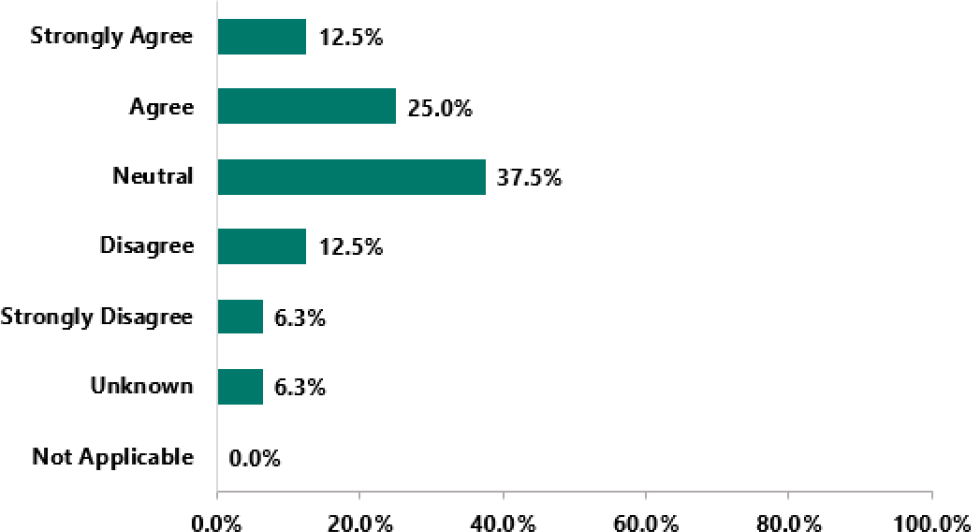
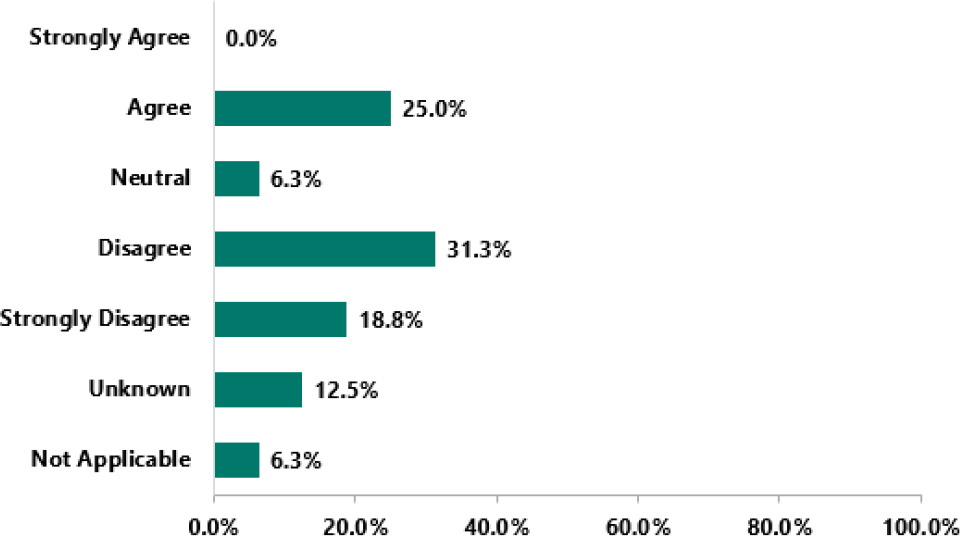
Figure C-15: Likert Scale responses to various items that are impacted by tools and technologies. There were sixteen respondents to each part of this question with the exception of operating budget which only had fifteen respondents.
Suggested Citation:
"Appendix C: Nationwide Survey Results." National Academies of Sciences, Engineering, and Medicine. 2025. Investigation of Tools and Technology for Roadside Vegetation Asset Management. Washington, DC: The National Academies Press.
doi: 10.17226/29248.
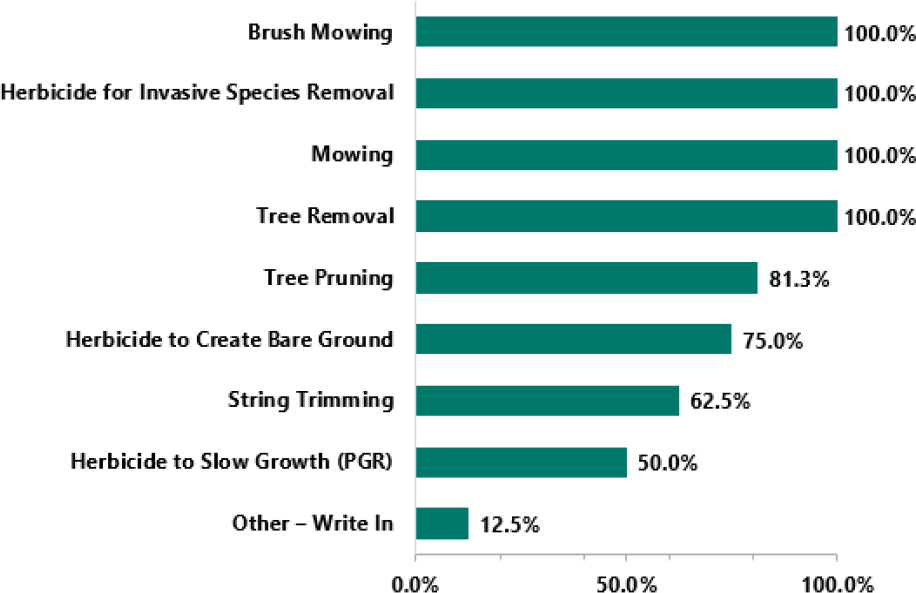
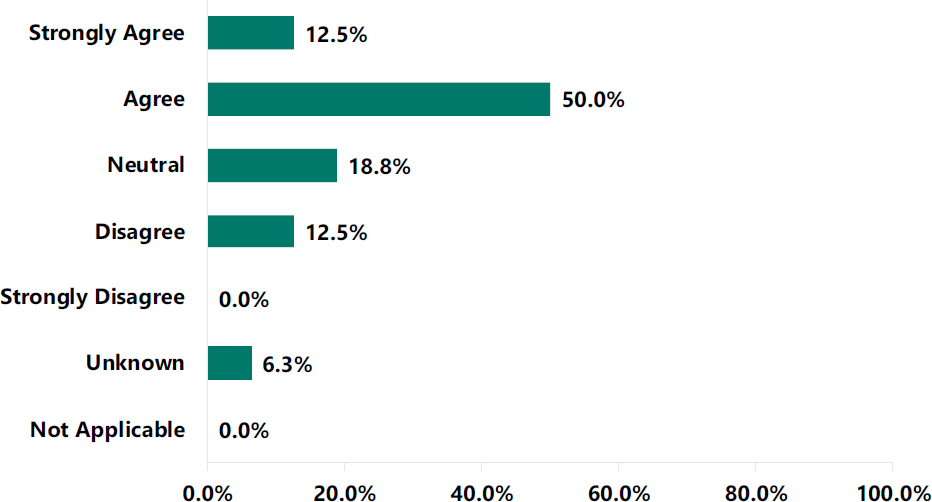
Figure C-16: Respondents were asked to select commonly used vegetation management practices within their state DOTs from a list. There were sixteen respondents.Figure C-17: Using a Likert Scale respondents were asked to determine their opinion on whether native plant management is important to their state DOT. There were sixteen respondents.
Suggested Citation:
"Appendix C: Nationwide Survey Results." National Academies of Sciences, Engineering, and Medicine. 2025. Investigation of Tools and Technology for Roadside Vegetation Asset Management. Washington, DC: The National Academies Press.
doi: 10.17226/29248.
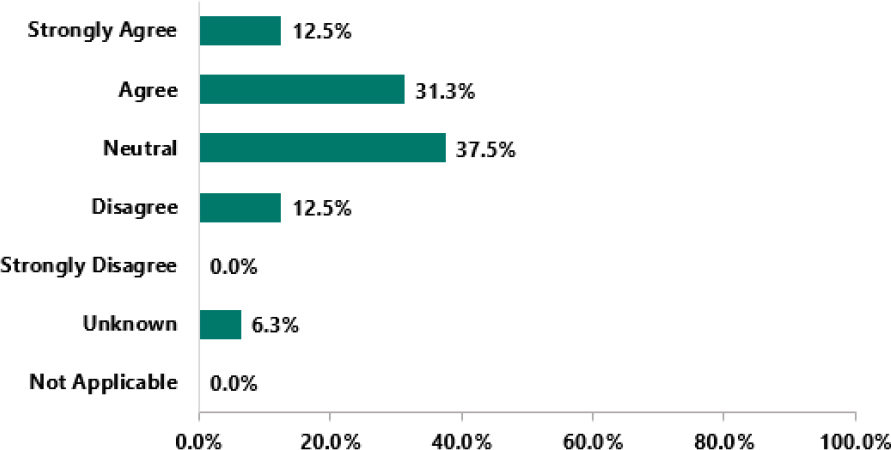
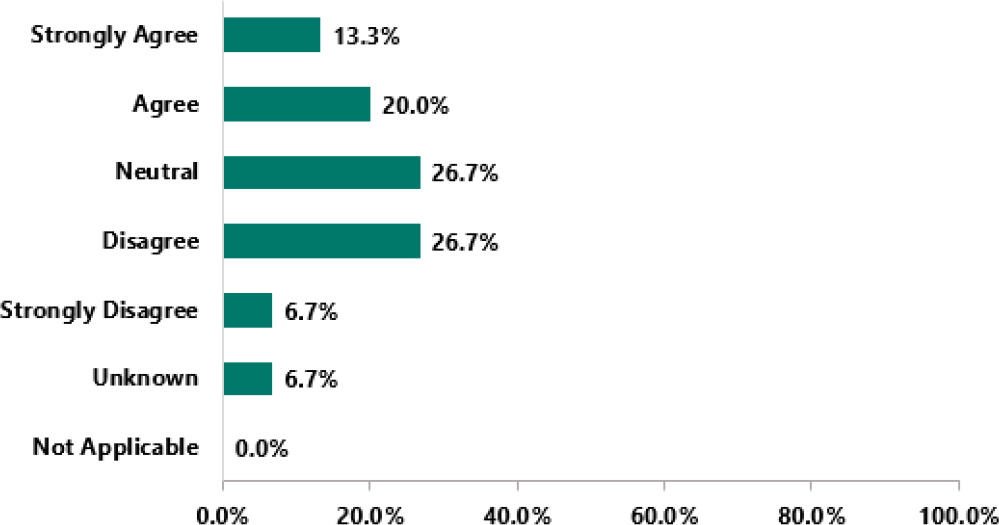
Figure C-18: Respondents were asked to rank whether they agreed that RVAM was a primary goal for their state DOT’s maintenance plan. There were sixteen respondents.Figure C-19: Respondents were asked whether maintaining vegetation management records is a key component for their state DOT. There were fifteen respondents.
Suggested Citation:
"Appendix C: Nationwide Survey Results." National Academies of Sciences, Engineering, and Medicine. 2025. Investigation of Tools and Technology for Roadside Vegetation Asset Management. Washington, DC: The National Academies Press.
doi: 10.17226/29248.
Figure C-20: State DOTs were asked if their state has an invasive species law. There were sixteen respondents.Figure C-21: Whether invasive plant species management is a top priority of their state DOT. There were fifteen respondents.
Suggested Citation:
"Appendix C: Nationwide Survey Results." National Academies of Sciences, Engineering, and Medicine. 2025. Investigation of Tools and Technology for Roadside Vegetation Asset Management. Washington, DC: The National Academies Press.
doi: 10.17226/29248.
Figure C-22: Limiting the spread of invasive pests and diseases is a key aspect to their state DOT. There were sixteen respondents.Figure C-23: State DOT staff are trained in invasive vegetation species identification. There were sixteen respondents.
Suggested Citation:
"Appendix C: Nationwide Survey Results." National Academies of Sciences, Engineering, and Medicine. 2025. Investigation of Tools and Technology for Roadside Vegetation Asset Management. Washington, DC: The National Academies Press.
doi: 10.17226/29248.
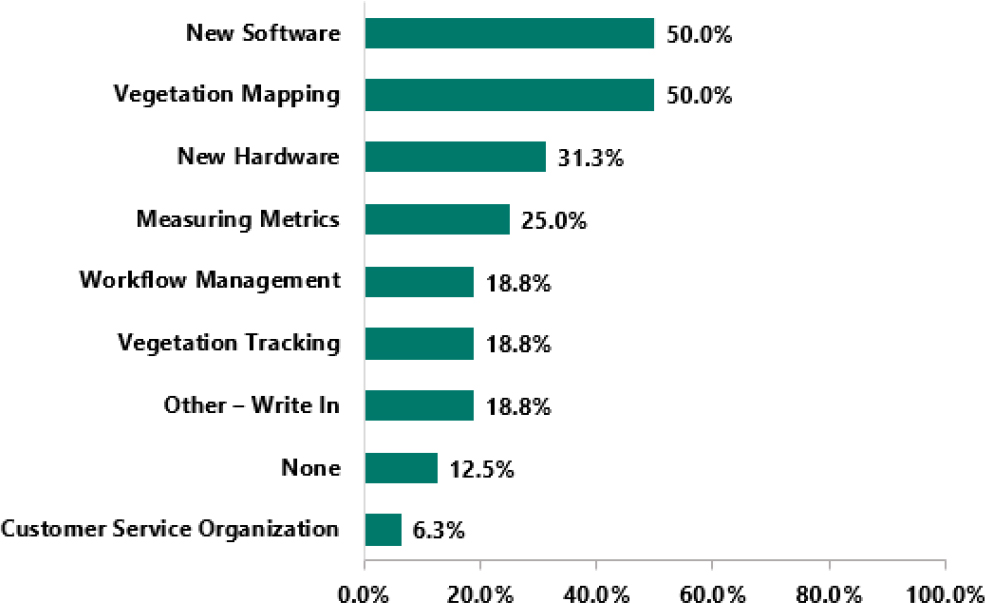
Figure C-24: State DOT staff are trained in tree disease and pest identification. There were sixteen respondents.Figure C-25: The types of tools and technology that have been implemented over the last ten years. There were sixteen respondents.
Suggested Citation:
"Appendix C: Nationwide Survey Results." National Academies of Sciences, Engineering, and Medicine. 2025. Investigation of Tools and Technology for Roadside Vegetation Asset Management. Washington, DC: The National Academies Press.
doi: 10.17226/29248.
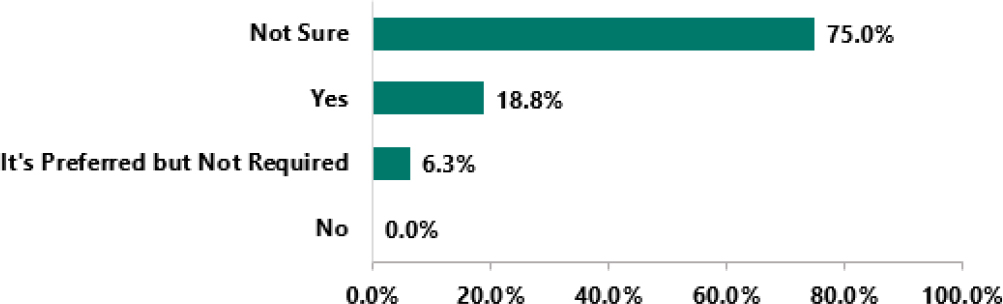
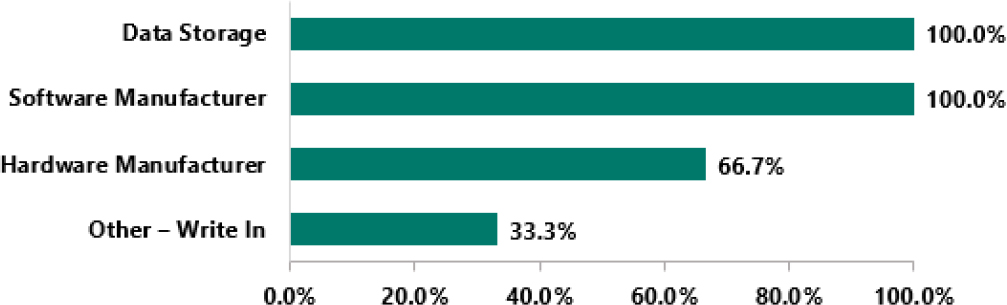
Figure C-26: Does the state DOT require a part of the software or hardware systems to be domestically based? There were sixteen respondents.Figure C-27: The part of the system required to be domestically based. There were three respondents.
Suggested Citation:
"Appendix C: Nationwide Survey Results." National Academies of Sciences, Engineering, and Medicine. 2025. Investigation of Tools and Technology for Roadside Vegetation Asset Management. Washington, DC: The National Academies Press.
doi: 10.17226/29248.
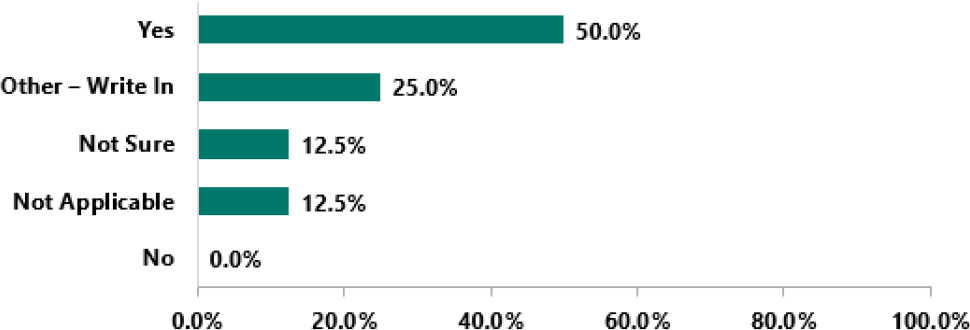
Figure C-28: Environmentally sensitive areas are recorded. There were sixteen respondents.Figure C-29: The state DOTs that indicated that environmentally sensitive areas are tracked were asked how the areas are tracked in the field. There were eight respondents.
Suggested Citation:
"Appendix C: Nationwide Survey Results." National Academies of Sciences, Engineering, and Medicine. 2025. Investigation of Tools and Technology for Roadside Vegetation Asset Management. Washington, DC: The National Academies Press.
doi: 10.17226/29248.
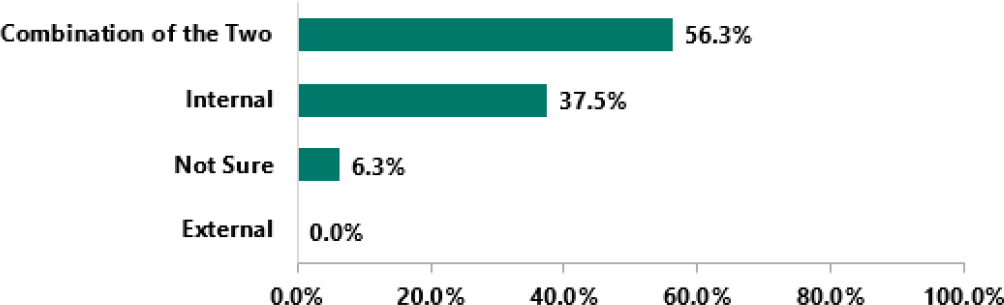
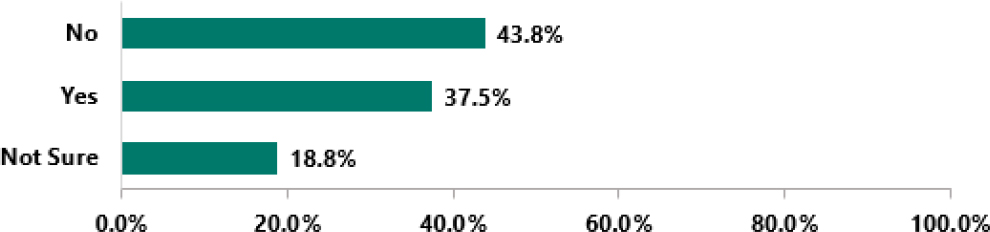
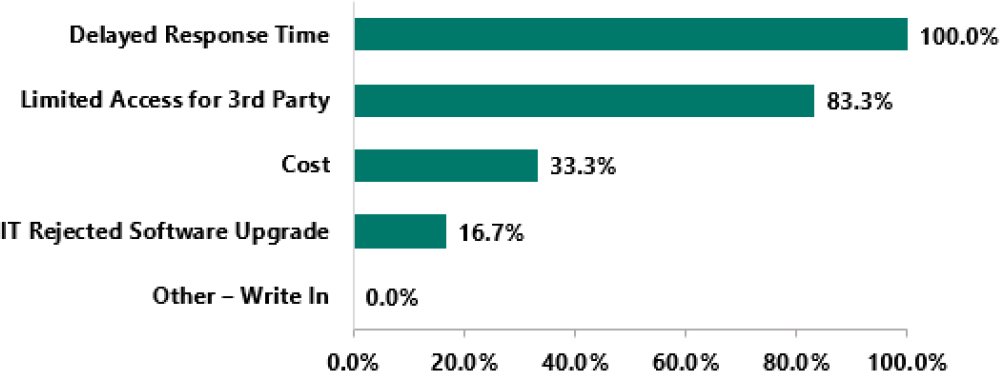
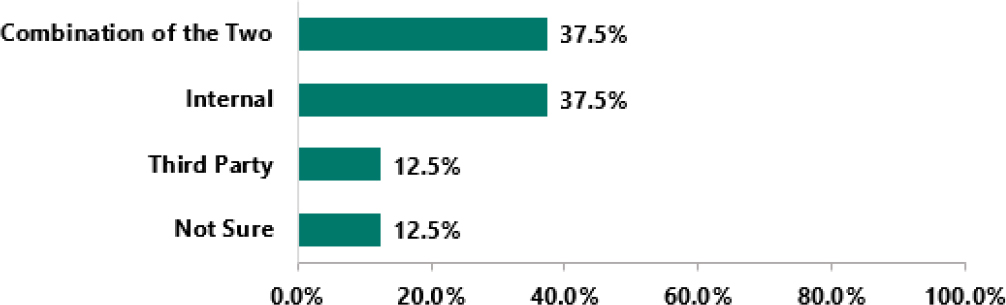
Figure C-30: State DOTs use an internal IT department, an external IT department, or a combination of both. There were sixteen respondents.Figure C-31: Issues encountered obtaining IT assistance with software or hardware issues. There were sixteen respondents.Figure C-32: The type of issues encountered when obtaining IT assistance. The six respondents who respondents that their organization had encountered issues when obtaining IT assistance answered.
Suggested Citation:
"Appendix C: Nationwide Survey Results." National Academies of Sciences, Engineering, and Medicine. 2025. Investigation of Tools and Technology for Roadside Vegetation Asset Management. Washington, DC: The National Academies Press.
doi: 10.17226/29248.
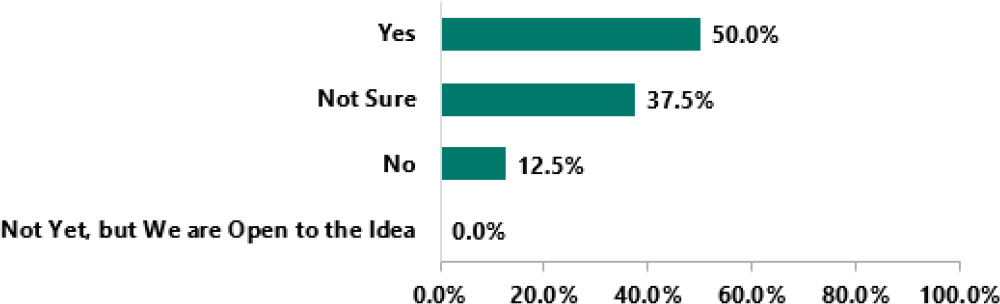
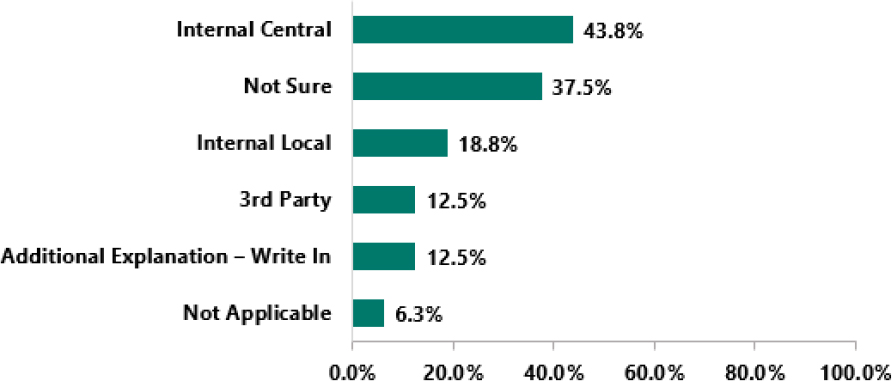
Figure C-33: Use a cloud-based data storage system. There were sixteen respondents.Figure C-34: The eight state DOTs who use a cloud-based data storage system responded to what type of IT department is used when support is needed from an IT department.Figure C-35: The type of server utilized within the state DOT. There were sixteen respondents.
Suggested Citation:
"Appendix C: Nationwide Survey Results." National Academies of Sciences, Engineering, and Medicine. 2025. Investigation of Tools and Technology for Roadside Vegetation Asset Management. Washington, DC: The National Academies Press.
doi: 10.17226/29248.
Additional Survey Results
Initial Survey
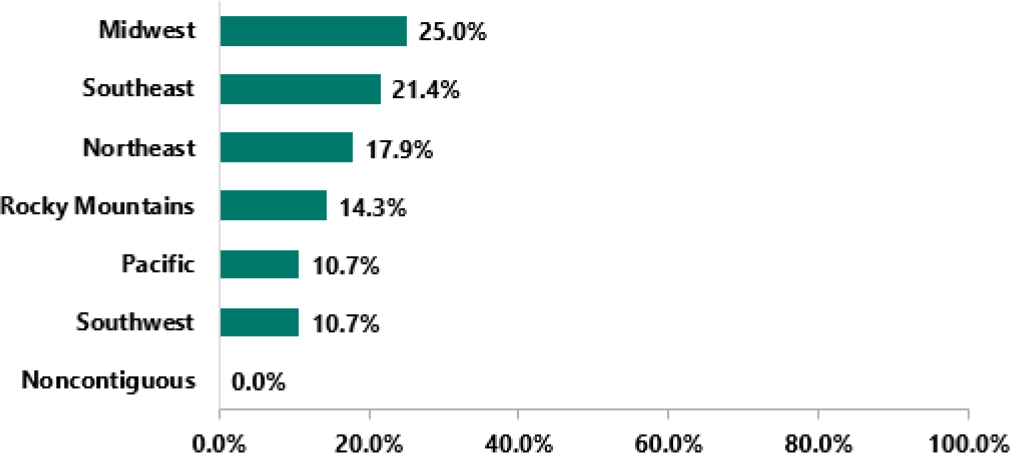
Figure C-36: US region survey respondent is from. There were twenty respondents.
Suggested Citation:
"Appendix C: Nationwide Survey Results." National Academies of Sciences, Engineering, and Medicine. 2025. Investigation of Tools and Technology for Roadside Vegetation Asset Management. Washington, DC: The National Academies Press.
doi: 10.17226/29248.
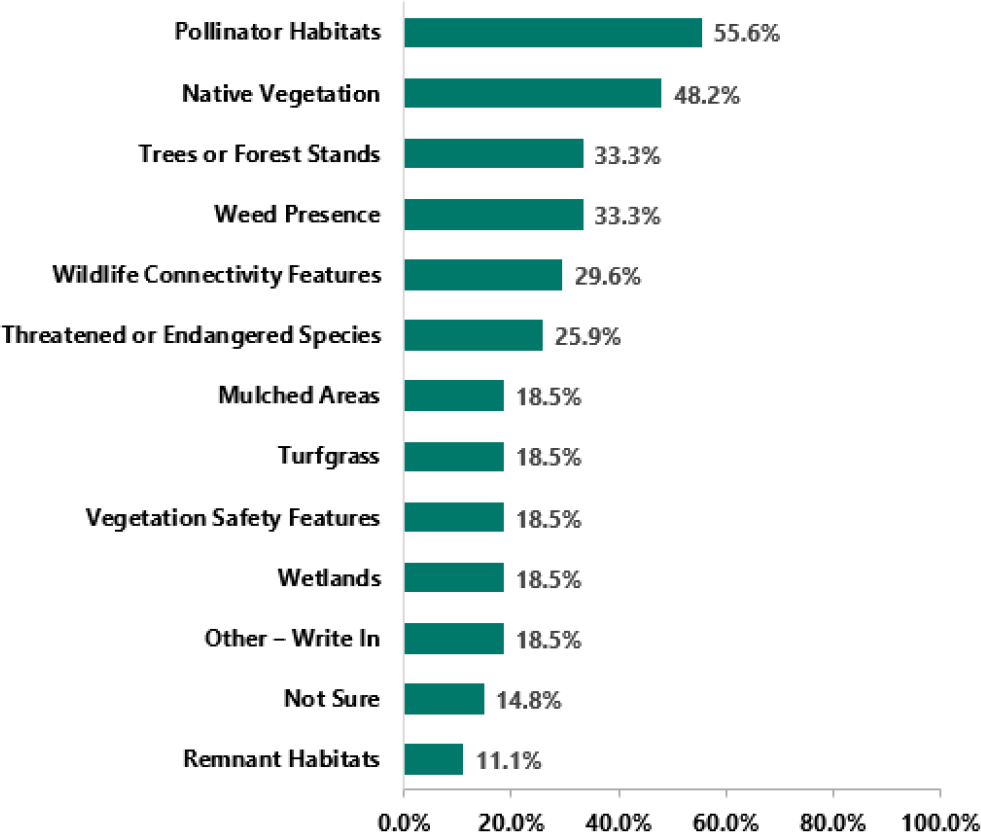
Figure C-37: Vegetation assets respondents desire to be tracked. There were twenty-seven respondents.Figure C-38: Recording and analysis of geographic data for roadside vegetation assets. There were twenty-eight respondents.
Suggested Citation:
"Appendix C: Nationwide Survey Results." National Academies of Sciences, Engineering, and Medicine. 2025. Investigation of Tools and Technology for Roadside Vegetation Asset Management. Washington, DC: The National Academies Press.
doi: 10.17226/29248.
Targeted Survey
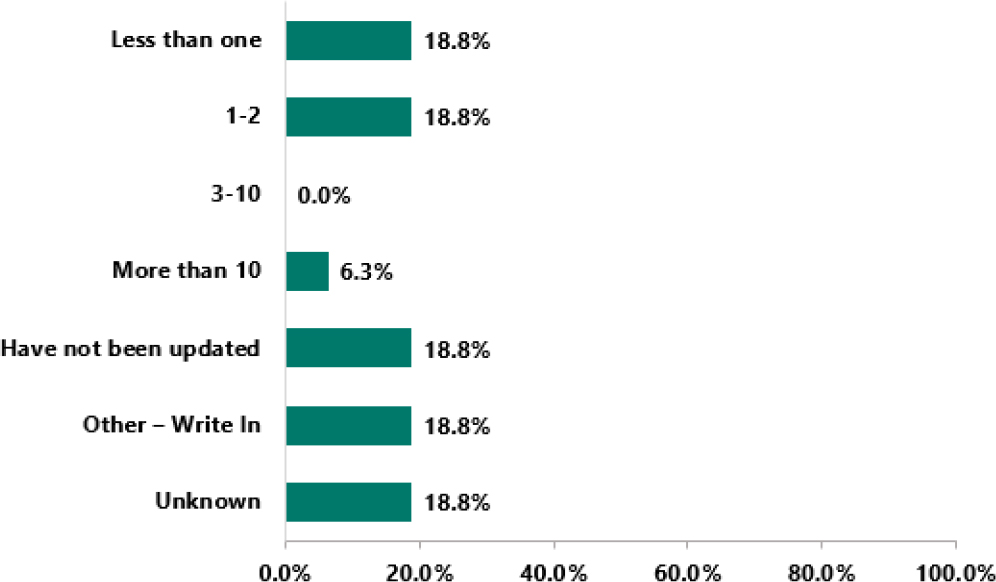
Figure C-39: The last time Roadside Vegetation Asset Management tools and technology were updated. There were sixteen respondents.
Suggested Citation:
"Appendix C: Nationwide Survey Results." National Academies of Sciences, Engineering, and Medicine. 2025. Investigation of Tools and Technology for Roadside Vegetation Asset Management. Washington, DC: The National Academies Press.
doi: 10.17226/29248.
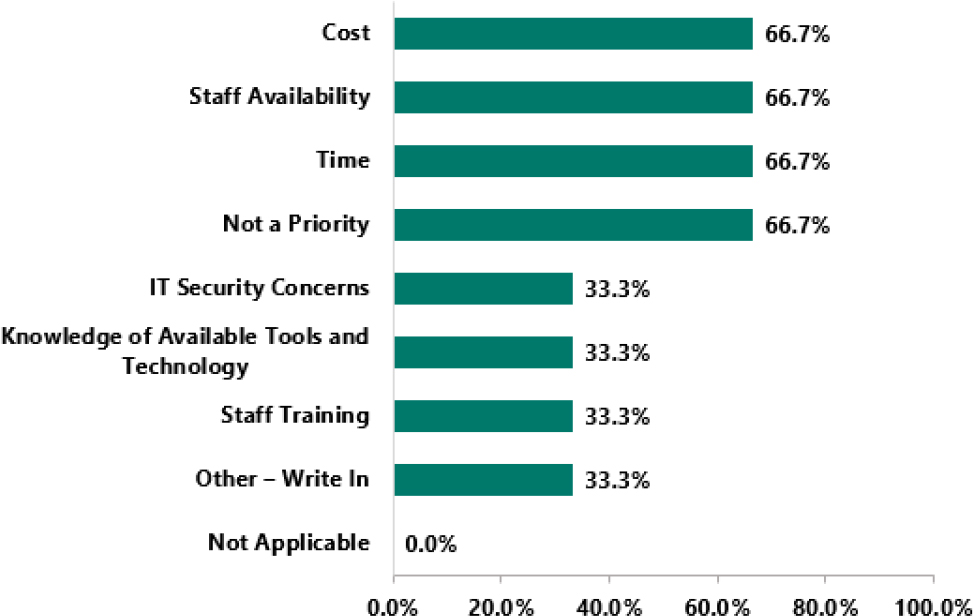
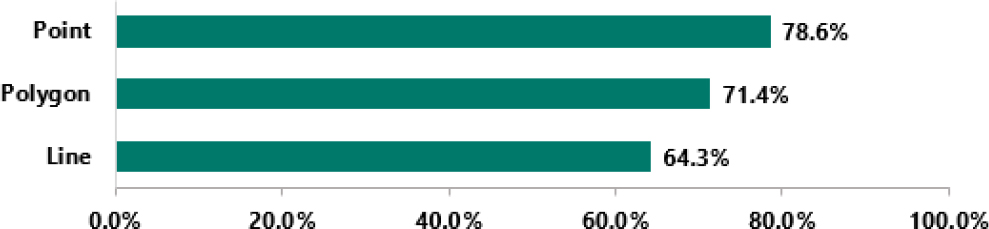
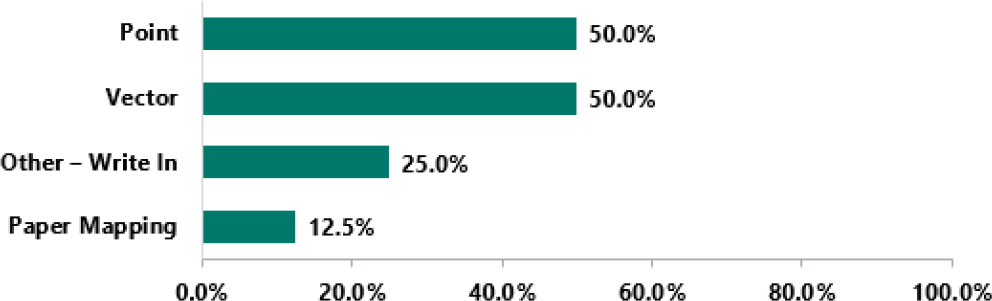
Figure C-40: The three respondents who stated that their state DOTs tools and tech have not been updated in the past ten years identified the factors that prevented the purchase of tools and technology for use in vegetation asset management.Figure C-41: The mapping vectors used most frequently among the fourteen respondents.
Suggested Citation:
"Appendix C: Nationwide Survey Results." National Academies of Sciences, Engineering, and Medicine. 2025. Investigation of Tools and Technology for Roadside Vegetation Asset Management. Washington, DC: The National Academies Press.
doi: 10.17226/29248.
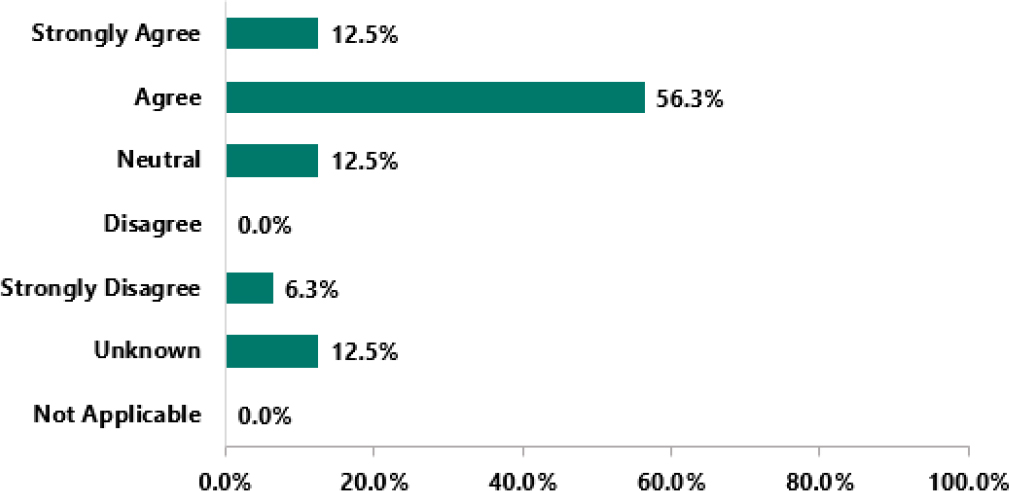
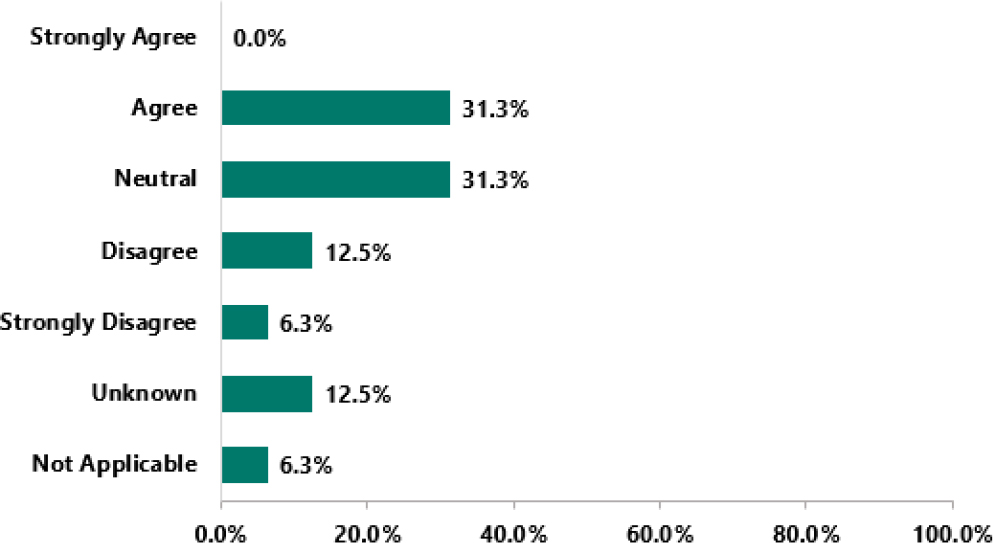
Figure C-42: The eight state DOTs that indicated that environmentally sensitive areas are tracked in Figure C-28 were then asked how the areas are tracked in a database.Figure C-43: The importance of native species management to RVAM. There were sixteen respondents.
Suggested Citation:
"Appendix C: Nationwide Survey Results." National Academies of Sciences, Engineering, and Medicine. 2025. Investigation of Tools and Technology for Roadside Vegetation Asset Management. Washington, DC: The National Academies Press.
doi: 10.17226/29248.
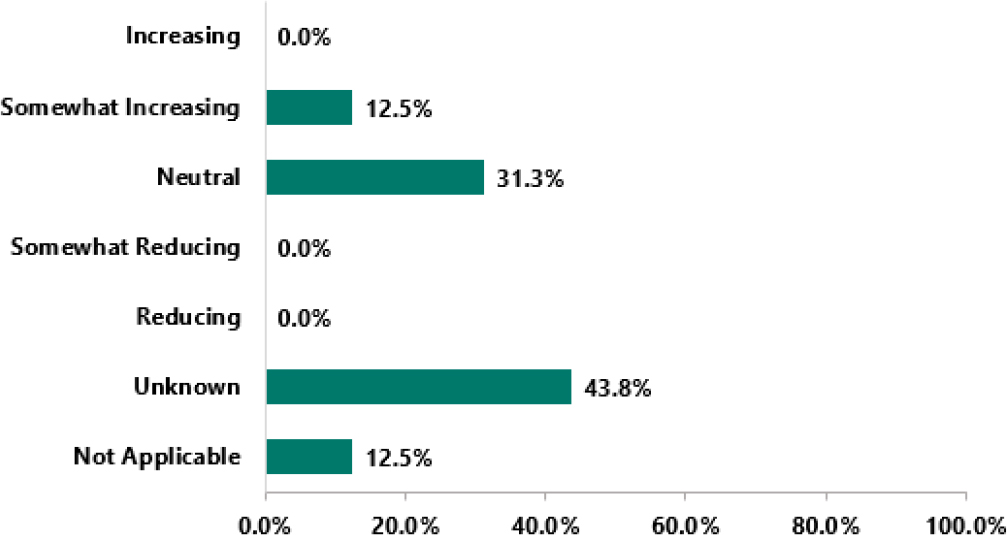
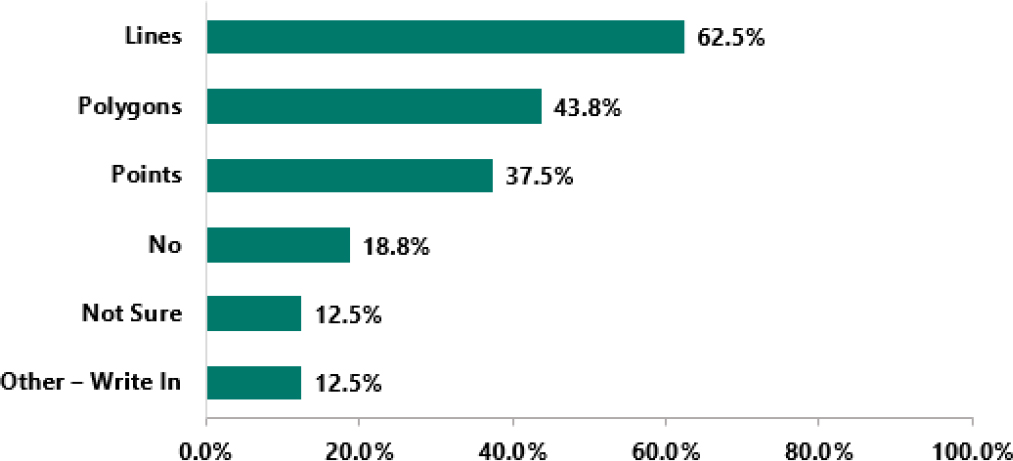
Figure C-44: Impact new tools and technology have had on staff hours. There were sixteen respondents.Figure C-45: Identification of the ways that ROWs are digitally mapped. There were sixteen respondents.
Suggested Citation:
"Appendix C: Nationwide Survey Results." National Academies of Sciences, Engineering, and Medicine. 2025. Investigation of Tools and Technology for Roadside Vegetation Asset Management. Washington, DC: The National Academies Press.
doi: 10.17226/29248.
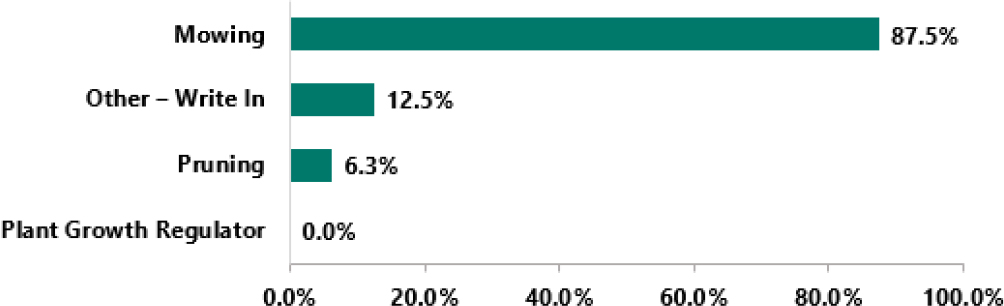
Figure C-46: Ways vegetation growth is limited along the ROW. There were sixteen respondents.Figure C-47: State DOT staff are trained to identify tree risk hazards. There were sixteen respondents.
Suggested Citation:
"Appendix C: Nationwide Survey Results." National Academies of Sciences, Engineering, and Medicine. 2025. Investigation of Tools and Technology for Roadside Vegetation Asset Management. Washington, DC: The National Academies Press.
doi: 10.17226/29248.
Figure C-48: RVAM equipment is dual-purpose. There were sixteen respondents.
Suggested Citation:
"Appendix C: Nationwide Survey Results." National Academies of Sciences, Engineering, and Medicine. 2025. Investigation of Tools and Technology for Roadside Vegetation Asset Management. Washington, DC: The National Academies Press.
doi: 10.17226/29248.
Suggested Citation:
"Appendix C: Nationwide Survey Results." National Academies of Sciences, Engineering, and Medicine. 2025. Investigation of Tools and Technology for Roadside Vegetation Asset Management. Washington, DC: The National Academies Press.
doi: 10.17226/29248.
Suggested Citation:
"Appendix C: Nationwide Survey Results." National Academies of Sciences, Engineering, and Medicine. 2025. Investigation of Tools and Technology for Roadside Vegetation Asset Management. Washington, DC: The National Academies Press.
doi: 10.17226/29248.
Suggested Citation:
"Appendix C: Nationwide Survey Results." National Academies of Sciences, Engineering, and Medicine. 2025. Investigation of Tools and Technology for Roadside Vegetation Asset Management. Washington, DC: The National Academies Press.
doi: 10.17226/29248.
Suggested Citation:
"Appendix C: Nationwide Survey Results." National Academies of Sciences, Engineering, and Medicine. 2025. Investigation of Tools and Technology for Roadside Vegetation Asset Management. Washington, DC: The National Academies Press.
doi: 10.17226/29248.
Suggested Citation:
"Appendix C: Nationwide Survey Results." National Academies of Sciences, Engineering, and Medicine. 2025. Investigation of Tools and Technology for Roadside Vegetation Asset Management. Washington, DC: The National Academies Press.
doi: 10.17226/29248.
Suggested Citation:
"Appendix C: Nationwide Survey Results." National Academies of Sciences, Engineering, and Medicine. 2025. Investigation of Tools and Technology for Roadside Vegetation Asset Management. Washington, DC: The National Academies Press.
doi: 10.17226/29248.
Suggested Citation:
"Appendix C: Nationwide Survey Results." National Academies of Sciences, Engineering, and Medicine. 2025. Investigation of Tools and Technology for Roadside Vegetation Asset Management. Washington, DC: The National Academies Press.
doi: 10.17226/29248.
Suggested Citation:
"Appendix C: Nationwide Survey Results." National Academies of Sciences, Engineering, and Medicine. 2025. Investigation of Tools and Technology for Roadside Vegetation Asset Management. Washington, DC: The National Academies Press.
doi: 10.17226/29248.
Suggested Citation:
"Appendix C: Nationwide Survey Results." National Academies of Sciences, Engineering, and Medicine. 2025. Investigation of Tools and Technology for Roadside Vegetation Asset Management. Washington, DC: The National Academies Press.
doi: 10.17226/29248.
Suggested Citation:
"Appendix C: Nationwide Survey Results." National Academies of Sciences, Engineering, and Medicine. 2025. Investigation of Tools and Technology for Roadside Vegetation Asset Management. Washington, DC: The National Academies Press.
doi: 10.17226/29248.
Suggested Citation:
"Appendix C: Nationwide Survey Results." National Academies of Sciences, Engineering, and Medicine. 2025. Investigation of Tools and Technology for Roadside Vegetation Asset Management. Washington, DC: The National Academies Press.
doi: 10.17226/29248.
Suggested Citation:
"Appendix C: Nationwide Survey Results." National Academies of Sciences, Engineering, and Medicine. 2025. Investigation of Tools and Technology for Roadside Vegetation Asset Management. Washington, DC: The National Academies Press.
doi: 10.17226/29248.
Suggested Citation:
"Appendix C: Nationwide Survey Results." National Academies of Sciences, Engineering, and Medicine. 2025. Investigation of Tools and Technology for Roadside Vegetation Asset Management. Washington, DC: The National Academies Press.
doi: 10.17226/29248.
Suggested Citation:
"Appendix C: Nationwide Survey Results." National Academies of Sciences, Engineering, and Medicine. 2025. Investigation of Tools and Technology for Roadside Vegetation Asset Management. Washington, DC: The National Academies Press.
doi: 10.17226/29248.
Suggested Citation:
"Appendix C: Nationwide Survey Results." National Academies of Sciences, Engineering, and Medicine. 2025. Investigation of Tools and Technology for Roadside Vegetation Asset Management. Washington, DC: The National Academies Press.
doi: 10.17226/29248.
Suggested Citation:
"Appendix C: Nationwide Survey Results." National Academies of Sciences, Engineering, and Medicine. 2025. Investigation of Tools and Technology for Roadside Vegetation Asset Management. Washington, DC: The National Academies Press.
doi: 10.17226/29248.
Suggested Citation:
"Appendix C: Nationwide Survey Results." National Academies of Sciences, Engineering, and Medicine. 2025. Investigation of Tools and Technology for Roadside Vegetation Asset Management. Washington, DC: The National Academies Press.
doi: 10.17226/29248.
Suggested Citation:
"Appendix C: Nationwide Survey Results." National Academies of Sciences, Engineering, and Medicine. 2025. Investigation of Tools and Technology for Roadside Vegetation Asset Management. Washington, DC: The National Academies Press.
doi: 10.17226/29248.
Suggested Citation:
"Appendix C: Nationwide Survey Results." National Academies of Sciences, Engineering, and Medicine. 2025. Investigation of Tools and Technology for Roadside Vegetation Asset Management. Washington, DC: The National Academies Press.
doi: 10.17226/29248.
Suggested Citation:
"Appendix C: Nationwide Survey Results." National Academies of Sciences, Engineering, and Medicine. 2025. Investigation of Tools and Technology for Roadside Vegetation Asset Management. Washington, DC: The National Academies Press.
doi: 10.17226/29248.
Suggested Citation:
"Appendix C: Nationwide Survey Results." National Academies of Sciences, Engineering, and Medicine. 2025. Investigation of Tools and Technology for Roadside Vegetation Asset Management. Washington, DC: The National Academies Press.
doi: 10.17226/29248.
Suggested Citation:
"Appendix C: Nationwide Survey Results." National Academies of Sciences, Engineering, and Medicine. 2025. Investigation of Tools and Technology for Roadside Vegetation Asset Management. Washington, DC: The National Academies Press.
doi: 10.17226/29248.
Suggested Citation:
"Appendix C: Nationwide Survey Results." National Academies of Sciences, Engineering, and Medicine. 2025. Investigation of Tools and Technology for Roadside Vegetation Asset Management. Washington, DC: The National Academies Press.
doi: 10.17226/29248.
Suggested Citation:
"Appendix C: Nationwide Survey Results." National Academies of Sciences, Engineering, and Medicine. 2025. Investigation of Tools and Technology for Roadside Vegetation Asset Management. Washington, DC: The National Academies Press.
doi: 10.17226/29248.
Suggested Citation:
"Appendix C: Nationwide Survey Results." National Academies of Sciences, Engineering, and Medicine. 2025. Investigation of Tools and Technology for Roadside Vegetation Asset Management. Washington, DC: The National Academies Press.
doi: 10.17226/29248.
Suggested Citation:
"Appendix C: Nationwide Survey Results." National Academies of Sciences, Engineering, and Medicine. 2025. Investigation of Tools and Technology for Roadside Vegetation Asset Management. Washington, DC: The National Academies Press.
doi: 10.17226/29248.
Sign in to access your saved publications, downloads, and email
preferences.
Former MyNAP users: You'll need to reset your password on your first
login to MyAcademies. Click "Forgot password" below to receive a reset
link via email. Having trouble?
Visit our FAQ page
to contact support.
Members of the National Academy of Sciences, National Academy of
Engineering, or National Academy of Medicine should log in through their
respective Academy portals.
Register
Register
Download as a Guest
Download as a Guest
While logged on as a guest, you can download any of our free PDFs on
nationalacademies.org
. You will remain logged in until you close your browser.
Thank You
Thank You
Thank you for creating a MyAcademies account!
Enjoy free access to thousands of National Academies' publications, a
10% discount off every purchase, and build your personal library.
Forgot Password
Forgot Password
Enter the email address for your MyAcademies (formerly MyNAP) account to
receive password reset instructions.
Reset Requested
Reset Requested
We sent password reset instructions to
your email
. Follow the link in that email to create a new password. Didn't receive
it? Check your spam folder or
contact us
for assistance.
We sent a verification link to your email. Please check your inbox (and
spam folder) and follow the link to verify your email address. If you
did not receive the email, you can request a new verification link below