Investigation of Tools and Technology for Roadside Vegetation Asset Management (2025)
Chapter: 3 Findings and Applications
CHAPTER 3 Findings and Applications
3.1 Literature Review
The research team conducted a comprehensive literature review to identify tools and technology that can assist state DOTs in tracking RVAM activities. DOT, utility, and industry reports were researched and analyzed for the review.
Retrofitting Tools and Technology for RVAM
One item identified across multiple state DOTs is the prevalence of COTS equipment and technology initially developed for a different sector and retrofitted for DOT use. This approach has allowed state DOTs to use newer technologies developed for related types of work (i.e., DOTs utilizing farming technology such as application and boom control technology from Trimble, Inc. or Raven Industries that includes a Global Positioning System (GPS) system and allows for herbicide application and tracking). In these cases, altering a few small components within an extensive system can make the tools and technology applicable for use along the DOT ROW.
Sometimes state DOT staff learn to use two different terms for the same action or asset as they incorporate new tools and technology. This was seen within ODOT where county staff used the terms “route” and “field” interchangeably due to the naming conventions within the herbicide application technology being used; the technology was originally developed for agriculture and was adapted for use along the ROW (Daniels et al. 2023). Technology is typically adapted for roadside vegetation management due to commonalities with other professional sectors and the lack of technology developed and marketed specifically for vegetation management use by state DOTs. State agricultural boards oversee state noxious weed laws, if present, and can be the regulating entities within each state for pesticide and herbicide use (Johnson 2008). As precision agriculture becomes more common and the technology required for mapping and tracking applications and the equipment to detect vegetation improves, it may become easier to retrofit this technology from farming fields for use within the DOT ROW (Özlüoymak et al. 2017; Candiago et al. 2015).
Commonly Available Technology
Tools and technologies such as geospatial technology, remote sensing and monitoring technologies, mobile devices, software applications, and other evaluation methods are currently used to inspect highway infrastructure and manage structural assets during and after construction. Many of these technologies can be used for multiple purposes, yet state DOTs use them nearly exclusively for structural assets. Some state DOTs are beginning to use these technologies to manage vegetative assets as well (Olsen et al. 2013; Tran et al. 2022). Due to variances in growth patterns and the coloration of vegetation throughout the year, the ability of this technology to accurately manage, monitor, and document all types and species of vegetation is currently limited. Throughout the project, the research team contacted various vendors who work with state DOTs to determine whether their systems were compatible with DOT ROW vegetation evaluations. Many stated that their systems were only compatible with structural assets such as bridges due to the difficulties with identifying various plant species because of vegetation diversity and coloration.
New and Evolving Technology
In the past few years, machine learning has begun being used to aid vegetation inventories by locating and mapping areas that may need RVAM work. There are a few companies that capture 360-degree panoramic images and Light Detection and Ranging (LiDAR) data and use analytics powered by artificial intelligence (AI) to inventory vegetation. This technology can mainly be used to identify the location of trees, shrubs, grasses, and forbs, but identifying the located plants to the species level is currently limited to trees and shrubs during the growing season. For some types of RVAM, such as ensuring sound walls and guardrails are cleared of vegetation, this technology can be effective, as any vegetation blocking the asset may need to be trimmed or removed for safety, depending on the goals of the state DOT. However, when managing herbaceous invasive species, the use of machine learning and AI is currently more limited; AI technology is not yet able to identify all vegetative species.
Recently, there have been improvements in machine learning and AI’s ability to identify species. Costello et al. (2022) used gradient boosting software to classify pixels from hyperspectral data, achieving a 99% classification accuracy in identifying a singular invasive plant species. This study supplements a growing body of literature detailing the use of machine learning for classifying, mapping, and monitoring invasive plant species. Systems such as this one can be trained through machine learning to classify individual species and identify the plant species as invasive or noninvasive. This technology largely depends on deep convolutional neural network (CNN) training. Systems with machine learning capabilities are currently being developed to enhance CNN to automatically update or learn as they are used to successfully identify an array of invasive species expected to be found in an area (Dyrmann et al. 2021).
Imagery
The use of dashboard cameras to identify plant species is also increasing, and multiple organizations are looking into this option (Joshi and Witharana 2022; Li et al. 2019; Verbree et al. 2004; Creusen and Hazelhoff 2011). Dashboard imagery, which can be combined with aerial remote imagery, can provide ground-level vertical profiles of trees and other vegetation to further characterize roadside conditions (Wedegedara et al. 2022). In these systems, cameras mounted on vehicles are being used to develop 3-D point clouds to identify traffic signs and other structural elements and the corresponding condition of these assets for companies such as Cyclomedia Technology (Verbree et al. 2004). Historically, state DOTs have used dashboard and aerial remote imagery exclusively for structural assets, but they are beginning to use this technology to identify tree locations for hazard tree assessments along DOT ROWs and are testing whether these systems can identify turfgrass areas. To gather ground-level imagery, a device consisting of a machine-vision camera, GPS, a remote control, and a processing platform is mounted on top of a vehicle. This device collects high-resolution images of invasive plant species at highway speeds. The files can then be downloaded as a shapefile to be incorporated into mapping software as desired by the state DOT. Additionally, companies are beginning to use digital tree inventories to assess tree health (Pusztai 2021). The companies that are testing digital tree surveys work solely with trees and shrubs and cannot currently identify features or species of herbaceous species such as grasses or forbs (Pusztai 2021). This work is being done in the European Union and is being piloted in the US.
Using machine learning alongside LiDAR technology can assist state DOTs in identifying areas to focus their efforts based on agency goals. Tools and technology can also reduce the amount of time staff spend on the ROW, which can increase the safety of both state DOT staff and the public. Examples of this include mapping within an office setting rather than in the field, using equipment that can reach difficult areas to enable field staff remaining within vehicles rather than managing vegetation on foot in the ROW, or staff being able to prioritize areas that have been known to cause issues in the past as they are identified within a mapping system. These types of technology can reduce costs for state DOTs over time while keeping employees safer by reducing staff exposure on the ROW and by identifying potential areas where DOT staff or contractors can focus their efforts during maintenance activities.
Funding
Throughout the literature review, the research team had difficulty finding documented information on available funding for RVAM. The primary source of funding for RVAM activities is state funding for most DOTs. This funding can come from the state legislature from sources such as gas taxes, various vehicle taxes (dependent on the state), and other taxes as applicable (Dumortier et al. 2017). In order for the legislature to approve such funding, the state DOT may need to demonstrate RVAM benefits through possible cost savings and increased effectiveness of DOT RVAM activities to the taxpayers and the state itself. Increased tracking of RVAM activities will assist managers in generating records of the volume of work needed and completed by operations staff as well as associated costs to support budgetary requests. While MAP-21 no longer provides funding opportunities, a couple of DOTs are following procedures established within MAP-21 to request federal funds for construction to be made available for RVAM work. State DOTs need to develop a performance-based asset management system to include additional assets within the state TAMP, following MAP-21 guidelines. To request federal funding, inclusion in the state TAMP is highly recommended. Once these items are completed, the state DOT can request funding for RVAM activities through the additional sources of funding.
Current and Past Funding Opportunities
The research team located current and previous federal grant funding at grants.gov. Most recently, funding was available through the IIJA (2024) and the FHWA via grants for the control of noxious and invasive weeds and managing pollinator habitat (FHWA 2006; FHWA 2024). The funding for pollinator habitat has $3,000,000 available at the time of this report (grants.gov 2024). These federal sources of funding can change as certain grants expire and new ones become available under new bills. Without experience navigating this process, it can seem as though the funding for these grants is not available to state DOTs. However, as state DOT land is public land, DOTs can be eligible for some grants, even funds not directly tied to the roadside.
Federal sources of funding can change as certain grants expire and new ones become available under new bills.
Also, at the time of this report, there is $70,000,000 in grant funding for fish passage programs, which is relevant to state DOTs for maintaining culverts and bridges (grants.gov 2024). Culverts are considered roadside safety features that need to be kept clear and visible by removing trees, shrubs, and excess invasive herbaceous vegetation such as phragmites and cattails. This excess vegetation can block the water flow, negatively impacting fish passage. Healthy fish populations depend on a complete ecosystem, including food sources such as native vegetation within ditches, streams, and rivers. A case for grant funding can be made that maintaining culverts and bridges in the state DOT ROW can promote healthy fish populations.
Whether a state DOT receives funding through FHWA or another federal source, or if funding is received from their state legislature exclusively, it is recommended that grant funding not be overlooked. State DOTs need personnel who can continually seek funding opportunities by locating and applying for grants. In addition to the specific grant funding sources provided above, it is recommended that state DOTs look for funding that promotes biodiverse habitats for bird, insect, and wildlife species, especially threatened and endangered species. Also, funding for climate resilience can be explored such as grants for drainage, and flooding. RVAM can be an integral part in the success of such grants.
Incorporating Vegetation Establishment into Funding
It is recommended that state DOTs make sure that construction projects incorporate adequate funding for vegetation establishment and management into their plans. Without appropriate funding earmarked for vegetation, some state DOTs find that the vegetation within construction project areas is more likely to be planted in a poor growing medium and have a high failure rate. As a result of construction design, vegetation can be inaccessible to maintenance staff. DOTs that use construction funds to make sure the vegetation in the project areas has the best start by using quality soil, proper plant selection and placement, and accessibility for maintenance staff are setting up their vegetation and their operations departments for continued success.
Roadside Vegetation Asset Management Investment
Selected literature examining a variety of transportation industries in the United States and internationally found that well-documented investment decisions for RVAM are rare due to the low return on investment (ROI). However, this low ROI can reflect a lack of information on the part of the state DOT. There is often a low ROI recorded for equipment used for RVAM because some equipment may only be used for part of the year and can sit idle for the rest of the year. Additionally, equipment used for RVAM is often purchased to complete other tasks that the ROI is attributed to, and then the value of the equipment for RVAM is not fully evaluated. These factors cause the ROI of RVAM equipment to be undervalued and appear to be low. The nationwide surveys asked respondents to determine the benefits of RVAM tools and technology on budgets and staff hours to help fill this gap that was identified in the research.
3.2 Nationwide Surveys
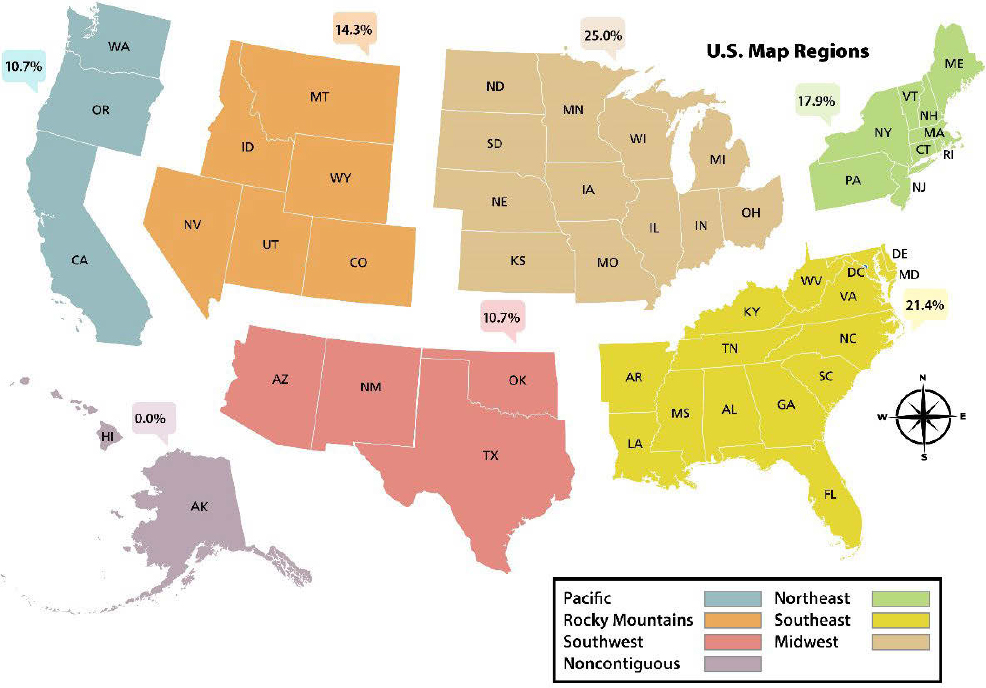
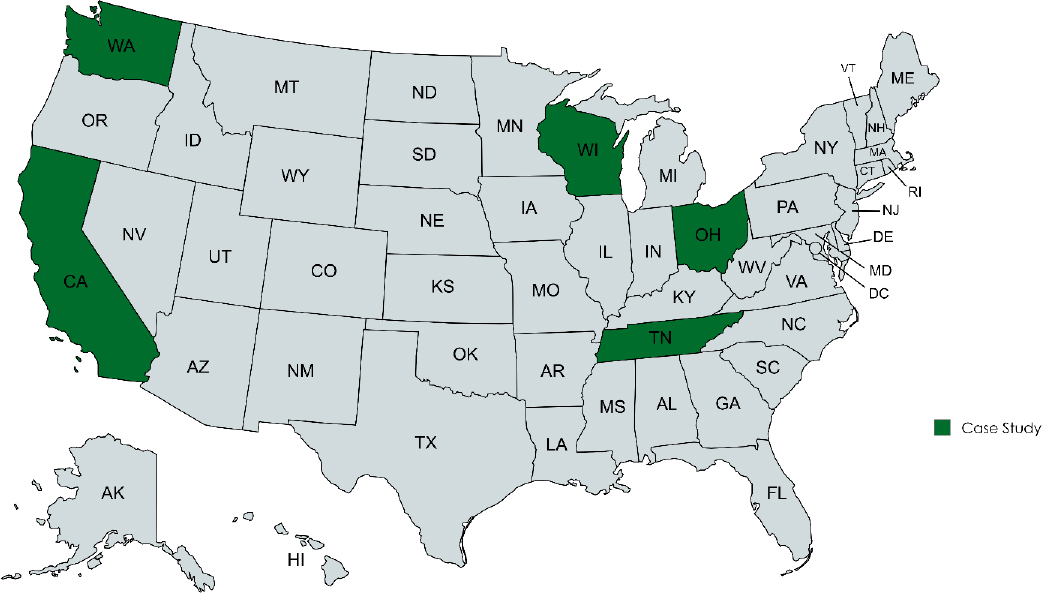
The information collected through the literature review was corroborated through the two surveys sent during this project. The questions included in the surveys can be found in Appendix B and the full results of the surveys can be found in Appendix C. Charts and graphics within the appendix include the use of “RLAM” rather than “RVAM” within the questions as that was the verbiage used at that time. The conversion of the term RLAM to RVAM occurred later in the project in response to state DOT staff members’ confusion regarding the term “RLAM” during the surveys. Much of the information identified in the literature review was upheld in the nationwide surveys. Responses were received from each region of the US with the exception of the noncontiguous states of Alaska and Hawaii (Figure 1) for the initial survey. The large number of states located within the Midwest and Southeast led to these values being higher than the other regions.
Initial Survey
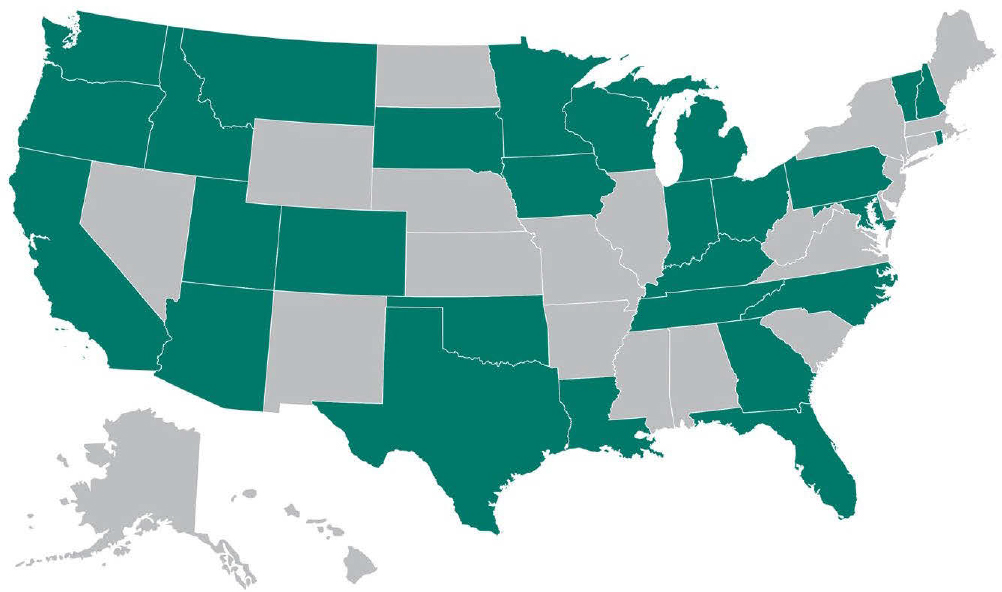
The initial survey was developed with the intent to ascertain basic information and determine which respondents would receive the more in-depth second survey. This survey was distributed to operations management representatives from the forty-nine state DOTs, seventeen utility companies, and two maintenance contractors for which the research team was able to locate an email address. The research team received a total of twenty-eight responses from across the contiguous US, a 41.2% response rate to the survey, with the majority of responses—twenty-seven (96.4%)from state DOTs (Figure 2).
RVAM Plan Development
Two (7.1%) survey respondents stated their organization’s RVAM plan and data collection system was in a late stage of development, six (21.4%) stated their organization’s RVAM plan and data collection system was in a middle stage of development, seven (25.0%)stated their organization’s RVAM plan and data collection system was in an early stage of development, and the remaining thirteen (46.4%) respondents stated they did not have an RVAM plan (Figure C-1). No organization stated that they had completed their RVAM plan and data collection system at the time of the survey. The percentage of respondents who are developing RVAM plans shows the importance of these plans and the dedication state DOT staff have toward purposefully completing RVAM activities. This also demonstrates that despite the amount of effort and thought put into these plans, no state DOT considers their RVAM plan complete as of the writing of this report. Despite the majority of state DOTs currently developing RVAM plans, only eight (30.8%) respondents stated their organization uses tools and technology to inform operations staff on how to manage vegetation and roadside safety features along the ROW (Figure C-2). This indicates a disconnect between the priorities of the central office to complete the work and the implementation of the tools needed for the local field staff to execute the work efficiently.
In-House vs. Contracted Work
The percentage of RVAM work that is completed by in-house crews versus completed by a contractor varies between state DOTs. However, most respondents (fifteen; 55.5%) stated that over 50% of RVAM work was completed in-house; four (14.8%) respondents stated 100% is completed in-house (Figure C-3). The amount of work completed in-house affects all aspects of RVAM within an organization. A state DOT that completes most of its work in-house will devote more time and budget to these tasks. A state DOT that contracts 90–100% of RVAM work will focus equipment, funds, and staff time on other areas that need attention by the state DOT, such as construction. This means that equipment for completing vegetation maintenance tasks may not be available for state DOT staff, staff may not be adequately trained when the need arises for reactive RVAM work, or contracts may need to be flexible to add additional tasks to contracts. The median amount of work completed in-house by state DOT maintenance crews for RVAM is 50–59% among survey respondents.
Tools and Technology Implementation
A majority of respondents—sixteen (57.1%), stated that their organization has implemented new software or hardware within the past ten years (Figure C-4), and only six (21.4%) were testing or piloting new RVAM equipment (Figure C-5). Of the software that has been implemented within the past ten years, the most frequently mentioned was mapping software systems, such as ESRI™, Inc. (ESRI™), AgileAssets™, and Delasoft™, that are capable of performing on tablets, cell phones, and GPS units, and that have in-office capabilities. State DOTs are developing proprietary software applications or using specialized COTS software systems, such as Survey 123, to ensure the software meets the specific requirements of their teams.
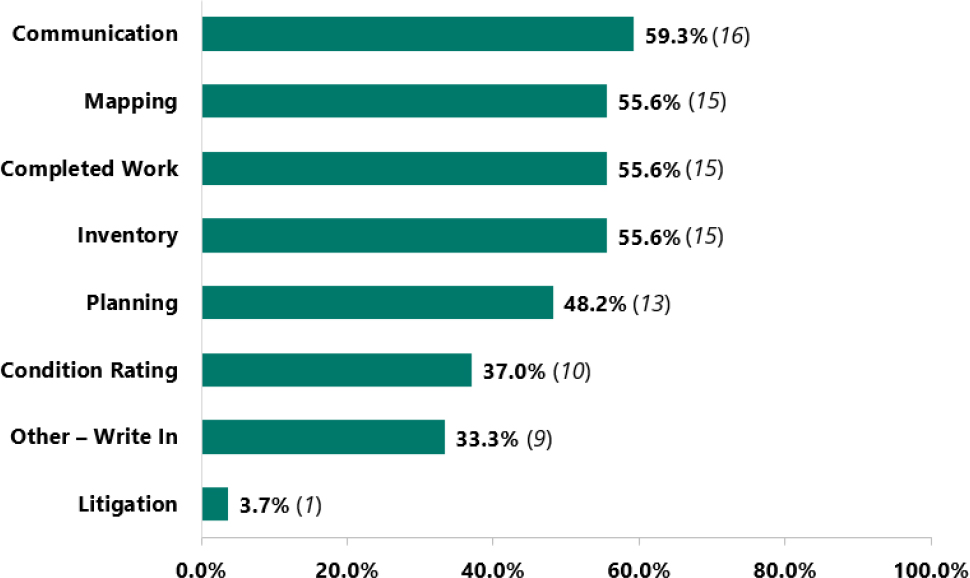
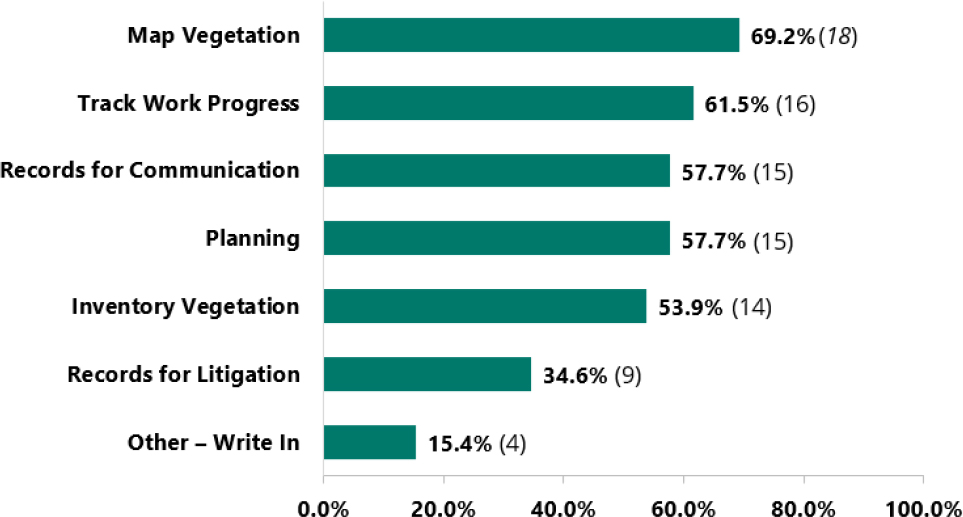
Sixteen (59.3%) state DOTs are using tools and technology to facilitate better communication, and fifteen (55.6%) respondents stated they are currently using tools and technology to map assets, complete inventories, and track completed work (Figure 3). However, the majority of mapping and tracking work progress is specifically for safety-related and federally mandated assets. Eighteen (69.2%) respondents stated they desired tools and technology to help with vegetation mapping and sixteen (61.5%) stated they would like tools and technology to track work progress (Figure 4). Only four (14.3%) respondents stated they are measuring what they need to with current mapping procedures (Figure C-6). This shows a disparity between state DOT goals and the tools and technology that are actually used by DOTs across the various assets.
Mapping and Tracking of Assets
Fifteen (57.7%) respondents stated they are mapping assets both manually and through software or hardware (Figure C-7). After speaking with several state DOTs, the research team found that multiple state DOTs’ field staff were mapping vegetation assets by placing points on a paper map or manually listing GPS points within either software or a paper tracking system and later transferring this information over to an online geospatial database. Many state DOTs have staff record mile marker information as part of their time-keeping processes, either manually recording the data or inputting it into a computer. But often, a different state DOT staff member transfers the information from the paper record to a computer as the field staff does not have access to the geospatial database. This practice is apparent in that eighteen (75.0%) respondents stated their organization is using mapping software but only ten (41.7%) are using GPS units (Figure C-8). Underutilizing GPS units and the practice of different staff completing data collection and data transfer can cause issues for the mapping and tracking process that are only realized in the future if GPS points or mile marker information are input incorrectly.
Many respondents stated they track roadside safety features (sixteen; 57.0%), threatened and endangered species (thirteen; 46.4%), and weed presence (thirteen; 46.4%) in their organization (Figure C-9), but only four (14.3%) agree that RVAM records are always supplemented with maps (Figure C-10), and only five (17.9%) agreed that information about vegetative assets is updated with each site visit (Figure C-11). This indicates that certain vegetation and roadside safety features are tracked irregularly and that the records are not updated after the initial mapping, if they are mapped at all.
Litigation
Only one (3.7%) respondent stated that they currently use tools and technology to track information to assist with litigation claims despite nine (34.6%) respondents stating they want records created by tools and technology to assist with litigation claims (Figure 3). Multiple state DOTs stated they have been sued for trees being removed or for herbicide applications killing crops or other vegetation on private land adjacent to the ROW. The use of mapping for RVAM can reduce these claims as state DOTs will be able to more accurately track the date, time, and location where staff applied herbicide or removed trees along the ROW as well as determine property boundaries during RVAM activities. Many of the state DOTs that contract out herbicide applications receive electronic maps and other tracking information from their contractors. However, some have been unable to create similar electronic maps using state DOT software.
Targeted Survey
The research team determined the recipients of the second (targeted) survey based on the twenty-eight responses to the initial survey. Twenty-three state DOTs were requested to complete the targeted survey. The research team only contacted state DOTs for this targeted survey, as no contractor or utility service provided the desired information on RVAM activities within their organizations. Sixteen state DOT responses, a 69.5% response rate, were received for the targeted survey (Figure 5).

Tools and Technology Updates and Benefits
Although the targeted survey was only sent to state DOTs with an RVAM plan, just six (37.5%) respondents stated they had updated their tools and technology for managing RVAM within the past ten years. The state DOTs that indicated they had updated their tools and technology within the past ten years stated that they had acquired access to commercially available mapping systems—such as ESRI™, Google™ Earth, or AgileAssets™—or proprietary software. With the advancements in technology in the past ten years, particularly for tracking assets and species identification, this might indicate a lack of funding or knowledge regarding the available technology and its associated benefits. Of the three respondents who stated that, to their knowledge, their organizations’ tools and technology had not been updated, two stated this was because RVAM was not a priority within their department, and they had insufficient time, staff availability, and training to update the state DOT’s RVAM plan. One state DOT cited prohibitive costs to updating their tools and technology, and another stated that insufficient access to Geographic Information Systems (GIS) resources prevented them from updating the RVAM plan and tools and technology (Figure C-12). Nine (56.3%) respondents stated that their organization has purchased tools and technology to help with RVAM activities, and four (25.0%) respondents stated that these tools are used for additional maintenance and management activities (Figure C-13).
When state DOTs were asked what the effects were after implementing new tools and technology for RVAM, eight (50.0%) respondents stated there was a positive impact on the ROI and four (25.0%) stated they did not know the impact on the ROI (Figure C-14). State DOTs wish to use ROI as a deciding factor for what tools and technology to purchase for RVAM; however, the lack of information on the ROI and cost overall may prevent DOTs from updating tools and technology. Of the respondents, ten (62.5%) stated the use of tools and technology improved mapping, and eight (50.0%) reported an improvement in vegetation planning, data tracking, and maintenance operations logistics. Staff training and staff hours were the only items where less than five (31.3%) respondents stated that there was a positive impact from the use of tools and technology, and the largest number of respondents stated a neutral overall impact on the organization (Figure C-15). This shows that while hours and funding for staff training and staff hours do not improve (go down overall), this impact is not necessarily negative. When speaking to state DOTs, staff mentioned that this change in hours is because staff must participate in extensive training when DOTs incorporate tools and technology into RVAM, and staff hours are not reduced but transferred from hours spent in the field to the office. This means that while the overall hours may not decrease, they are transferred over to office work where staff are not exposed to traffic, improving staff members’ and the public’s safety. Additionally, some state DOTs expressed the belief that hours were not reduced because there was always additional work to do or the hours were transferred over to another department, such as a GIS department.
All respondents stated their state DOT uses brush mowing, herbicide for invasive plant species removal, mowing, and tree removal for vegetation management. In addition, thirteen (81.3%) state DOTs stated they prune trees, twelve (75.0%) stated they use herbicide to create bare ground, ten (62.5%) stated they use string trimming, eight (50.0%) stated they use plant growth regulator (PGR), and fourteen (87.5%) stated mowing is their state DOT’s primary way to limit vegetation growth (Figure C-46).
State DOT RVAM Priorities
Ten (62.5%) respondents stated that native species planting efforts were imperative to their organization, however, only seven (43.8%) stated RVAM overall was imperative to their maintenance plan (Figures C-17, C-18). Additionally, only five (33.3%) stated that maintaining RVAM records is a core component of their organization (Figure C-19). Of the state DOTs that responded, thirteen (81.3%) have a noxious weed law (Figure C-20). When asked if invasive plant species management is a top priority, five (33.3%) state DOTs responded positively, and six (37.5%) stated limiting the spread of invasive pest species was a key aspect of their organization (Figures C-21, C-22). When state DOTs were asked if the surveyors were trained in invasive species identification, five (31.3%) stated that they were, and four (25.0%) stated they were trained in tree disease and pest identification (Figures C-23, C-24). This shows that although native plant species are imperative to the RVAM plan, many state DOTs do not train staff to identify invasive species, invasive pests, and tree diseases, all of which are helpful in establishing and promoting the growth of desirable species along the ROW.
Software/Hardware Implementation
Of the state DOTs that have updated their tools and technology over the last ten years, eight (50.0%) stated that their organization began using new software and vegetation mapping (Figure C-25). Extended survey responses and conversations with the state DOTs indicate mapping software comprises a large majority of the new software being used. Management staff are the primary users of the new software as indicated by the eight (50.0%) respondents who stated their state DOT has implemented new software, and the five (31.3%) respondents who stated their DOT has implemented new hardware. Hardware includes devices that can be brought out into the field for data collection, while software systems can be used either in the field or in the office for data management.
With the increased development of tools and technology over the past ten years, some state DOTs require specific parts of software and hardware systems to be domestically based (Figure C-26). Of the respondents, twelve (75.0%) were unsure if any part of a system needs to be domestically based; however, the other respondents stated either that the system must be or that it is preferred for the system to be based in the US. All of the state DOTs that responded that part of the system needed to be domestically based stated that the data storage and the software manufacturer were required to be domestically based (Figure C-27) and two (66.7%) stated that the hardware needed to be manufactured in the US, as well. This can cause issues with ensuring the most up-to-date tools and technology are available to state DOTs, as the most modern versions of these systems may not be developed within the US. This requirement also reduces the number of companies that can provide these services to state DOTs.
Mapping of Environmentally Sensitive Areas
Twelve (75.0%) respondents stated their state records environmentally sensitive areas (eight (50.0%) responded affirmatively while four (25.0%) stated the state environmental division completes mapping) (Figure C-28). Some state DOTs expressed that the information can be difficult to access when the state environmental division is responsible for data collection. This means that, for several state DOTs, although a state department has obtained information, local state DOT staff have no method to access and use the information during the course of their maintenance activities. To work around this issue, several state DOTs physically mark the areas in the field (Figure C-29). Of the DOTs who physically mark the areas in the field, four (50.0%)respondents stated that their organization places signage to indicate environmentally sensitive areas. Other ways of marking these areas include fencing the area or flagging the area so maintenance staff can see where the sensitive areas are located. One state DOT responded that the information is placed in a database for field staff to access, but during follow-up conversations, it was mentioned that some field staff are unaware that this information is placed within their maintenance management system. Two (25.0%) respondents stated they do not mark these environmentally sensitive areas in the field. The research team is unaware of how field staff would be aware of the environmentally sensitive areas that their departments track without specific markings that are visible during maintenance.
IT Department Support
As state DOTs depend more on tools and technology, IT departments generally become more important. Nine (56.3%) respondents stated that their organization uses a combination of an internal and external IT department (Figure C-30); however, no state DOTs indicated that they are exclusively using an external IT department. When assistance is needed, six (37.5%) respondents stated there have been issues obtaining help (Figure C-31). Survey respondents reported issues including a delayed response time, limited access for the third-party IT department, issues with the cost of assistance, or that the internal IT department rejected software upgrades (Figure C-32). It is worth noting that all respondents, including those solely using internal IT departments, responded to the question of whether there were issues in obtaining assistance and what the issues were. State DOTs that either exclusively use internal IT departments or those that use a combination of internal and external IT departments have reported issues with delayed response time and limited access for either third-party IT departments or vendors, as applicable to the DOT.
One of the more pervasive technology improvements is the inclusion of cloud-based storage. Of the sixteen respondents, eight (50.0%) are currently using cloud-based storage (Figure C-33). Of those eight, three (37.5%) use a combination of external and internal IT departments for assistance with cloud-based solutions, three (37.5%) use the department’s internal IT department, and one (12.5%) solely use an external IT department for cloud-based storage solutions (Figure C-34). It is worth noting that exclusively using an internal IT department for cloud-based storage may require the state DOT to invest in servers and additional IT staff. Some technology vendors can circumvent location-based issues by installing servers within the country or state, or even in the office of the DOT. It is recommended that state DOT staff communicate with possible vendors regarding the feasibility of additional server accessibility. Maps and maintenance records are some of the main items that state DOTs store within cloud-based storage systems. Maps are generally large files, and state DOTs often retain copious maintenance records. Respondents stated they use internal central servers (seven; 43.8%), internal local servers (three; 18.8%), and third-party servers (two; 12.5%) for cloud-based storage (Figure C-35). These servers can either be cloud-based or on state DOT premises.
3.3 Case Studies Overview
The research team completed five case studies for the project. The case studies were completed with Caltrans, ODOT, TDOT, WSDOT, and WisDOT (Figure 6). The questions included in the case studies can be found in Appendix D. Each of the five state DOTs, with the exception of WisDOT, performs various amounts of RVAM work in-house.
WisDOT is an exception among state DOTs interviewed in that WisDOT has one state DOT staff member in each county and contracts all asset management and RVAM field work to county staff. As the Wisconsin state DOT does not directly complete asset management, WisDOT staff members use multiple types of GIS and mapping software to enhance communication and increase accountability. WisDOT provides funding to the counties to purchase necessary equipment and requires each county to provide information on the completion of each maintenance activity. Most state DOTs have staff across their state and will have management units or county garages with staff directly supervised by the central office.
RVAM plans are developed via various methods depending on the state DOT structure. The state DOTs interviewed had either a centralized structure where the central office writes all RVAM plans with input from local crews or a hybrid structure where the central office provides goals and guidelines/requirements and supports local staff when needed. This support can come in the form of additional funding, equipment purchases, additional staff, or resources to train staff at the local level. Each state DOT differs in how this is done. For example, TDOT provides the same technology for items such as GPS units and tree mapping services to all districts through statewide contracts, and local staff can select other tools and technology, such as trucks, from a prequalified list. Other state DOTs such as ODOT have local staff choose from a prequalified list for all equipment, with the exception of tablets and cell phones which the central office provides.
The state DOTs interviewed were evenly divided on the use of COTS software, PCCA software, or solely proprietary software.
- COTS: State DOTs that utilize COTS either allow automatic updates or purchase enterprise license agreements to allow IT staff time to review updates before releasing them to the entire department. This can help ensure there are no issues such as updated codes causing temporary system outages. It is recommended that state DOTs check with vendors they wish to work with to see if they can choose this option for IT security reasons.
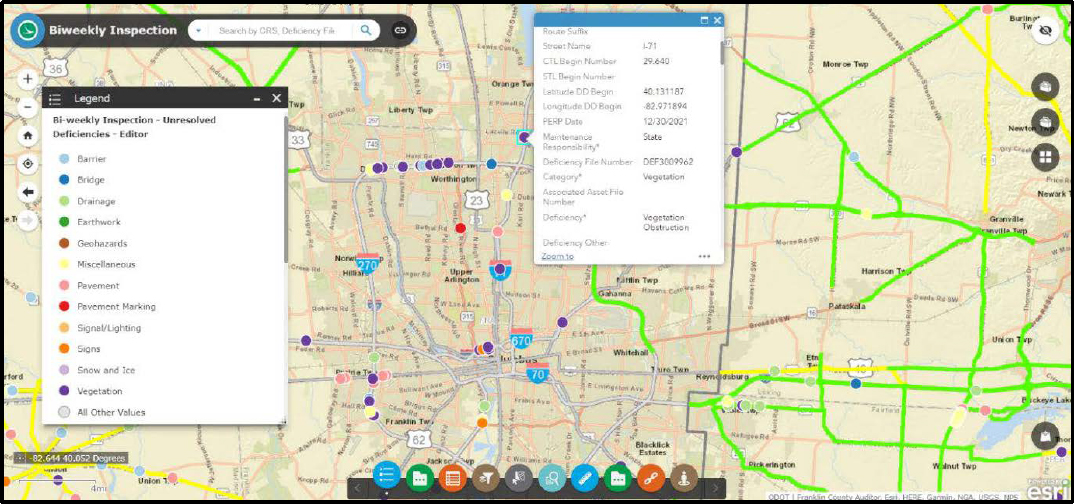
- PCCA software: State DOTs with PCCA software, such as ODOT’s Bi-Weekly Collector App and WSDOT’s Highway Activity Tracking System (HATS), can create proprietary systems within a COTS program, allowing for system updates without compromising the DOT’s needs. Both of these systems use mapping software, such as ESRI™, as the basis for the application development. This type of program requires IT staff buy-in to allow for software development. Software company developers can also assist with creating these PCCA systems. The department can purchase an enterprise license that allows the state DOT access to manipulate and create additional programs within the existing system. This allows the developed programs to have an operating system that will be up to date while still allowing state DOTs to create dedicated systems specific to their needs.
- Proprietary software: The use of proprietary software requires IT staff support and possibly the support of the GIS department, depending on the software being developed. Some state DOTs using proprietary software have identified a lack of proper software support, stating that they receive an inadequate number of software updates resulting in usability issues. One state DOT indicated that the IT department stopped providing updates to one of its proprietary systems due to the age of the system overall. In this case, the manufacturer no longer supported the operating system, and the state DOT understood that the system would need to be replaced soon. However, funding had been difficult to locate, and the system had been operating for nearly five years without updates. Other state DOTs with dedicated IT staff for the maintenance division have been able to update the proprietary systems as needed. It is recommended that state DOTs have dedicated IT and GIS staff, as needed, to update proprietary systems if this is the type of software desired.
State DOTs that have successfully integrated vegetation management within the daily activities of the local crews have found ways to use similar language and systems for RVAM and structural assets.
State DOTs often operate multiple software systems to meet all state requirements. As these software systems are typically developed independently, many of the state DOTs interviewed stated that the various software systems cannot integrate or communicate with each other. This can mean staff are unable to access information that has been collected, that staff need to convert files to the appropriate file types to use in a different system, or that work is duplicated into various formats to ensure all appropriate staff can access information. These duplications are apparent in states where staff are required to fill out a day card or physical timesheet that is passed along to office staff for input into the management system or when inspection data cannot be uploaded to the mapping system. This means staff have to review two sources to determine maintenance needs, as the proprietary system does not allow information from field staff timesheets to be automatically added into the mapping software to detail where maintenance occurred within the GIS system. Instead, multiple types of mapping software must be combined into a singular dataset. The inability of management software to communicate with reporting software can lead to duplications in work when state DOTs determine the true costs of maintenance. Multiple state DOTs interviewed indicated this is a pain point; state DOTs that are planning to replace or develop new software systems for asset management have mentioned communication between systems as one of the goals of the new systems. Incorporating software that communicates with relevant systems within the state DOT saves staff time, reducing overall costs.
State DOTs that have successfully integrated vegetation management within the daily activities of the local crews have found ways to use similar language and systems for RVAM and structural assets. Caltrans is currently working to integrate vegetation management by using systems developed for culvert inspections and maintenance. Caltrans staff chose this course of action since California added culverts into the state TAMP, which enabled them to develop the systems for culvert inspections and maintenance to meet their TAMP requirements. WSDOT has incorporated both vegetation and structural assets into HATS for inspections and tracking work, as has ODOT with the Bi-Weekly Collector App (Figure 7). All three of these state DOTs use similar language in developing RVAM activities and tracking as they do for structural assets or roadside safety features and have added additional assets into the state TAMP.
Each state DOT has different forms of access to the tools and technology for RVAM activities. With the exception of WisDOT, each state DOT interviewed uses tablets, such as iPads, with access to online services through cell phone providers and GPS capabilities to manage assets, either structural, vegetative, or both. Among the state DOTs using tablets, WSDOT assigns a tablet to each local staff member, ODOT has three to four tablets in each county for local staff use, Caltrans has tablets for select local staff such as water managers and some field staff supervisors, and TDOT field staff supervisors have access to tablets. While WSDOT, Caltrans, and TDOT tablets have assigned users, ODOT’s local managers determine who ultimately has access to the tablets. This means staff members do not have an assigned tablet; rather, staff who require a tablet for the day choose which one they want to use with their supervisor’s permission. The local manager the research team spoke with stated that within his county, the team leads have access to the tablets, but all staff have log-in credentials in case they need access to the information within the tablet.
A consistent item across each state DOT interviewed was the need for the IT department’s buy-in to update and maintain tools and technology. The state DOTs interviewed that do not have IT buy-in reported that they have historically struggled to update software and hardware systems, receive approval for new systems to be purchased or designed, and facilitate staff access to the systems. Some of the state DOTs interviewed stated IT would not allow staff to have log-in credentials because understaffing within the IT department meant IT could not ensure all passwords and usernames are kept up to date within the system.
Many of the state DOTs interviewed stated that they needed a GIS specialist to ensure that mapping is completed. ODOT and WSDOT have dedicated GIS staff for RVAM mapping. WisDOT, Caltrans, and TDOT assign mapping responsibilities to central office personnel including a landscape architect, Division of Design staff members, and a transportation project specialist, respectively. Those state DOTs that have a staff member who is not a GIS specialist completing RVAM mapping do have GIS departments. However, at this time, these state DOTs have insufficient GIS department staffing to complete RVAM mapping.
Many of the state DOTs interviewed stated that they needed a GIS specialist to ensure that mapping is completed.
All of the state DOTs interviewed provide annual funding to each district, and local staff are responsible for distributing the funds as needed and ensuring that all RVAM goals are met. Some state DOTs provide roughly the same funding to each region or district within the state, depending on the DOT’s organizational structure, while others distribute the funding based on predetermined goals for each region or district. Varying funding distribution is partially due to the amount of in-house work completed by each state DOT and whether the central office provides input in developing the RVAM plan for each district/region.
Many of the state DOTs interviewed mentioned they currently have, or have had, issues locating funding sources for RVAM. Federal funding is not widely available for RVAM maintenance activities; however, there have been some recent opportunities, such as the IIJA including grant opportunities for pollinator habitat support and invasive weed control, which could potentially provide federal funds for select maintenance activities. Funding opportunities vary based on federal and state leadership and priorities. Available grants are visible on the federal government’s grants website (grants.gov). In addition, in 2024, the FHWA provided guidance regarding federal funding for vegetation management under IIJA funding for pollinator habitat creation and management.
Some of the state DOTs interviewed received federal funding for wildfire rehabilitation. Additionally, some state DOTs built vegetation maintenance into federally funded construction projects for up to ten years. Other state DOTs are looking into including vegetative assets within the state TAMP to showcase the benefits of federal funding for functional plantings, and projects that include both structural assets and vegetative assets. These state DOTs use MAP-21 as the basis for their claims when applying for grants. Utilizing state funds is more common; for example, TDOT is completely funded by the state and does not utilize federal funding for RVAM maintenance activities. State DOT staff interviewed expressed the need for experienced grant writers who are dedicated to locating and applying for grants to ensure state DOTs can acquire all available funding for various projects. However, staff noted that state DOT budget constraints would make it difficult to justify a grant-writing position.
Funding, staffing, training, and access to the proper tools and technology seem to be common challenges with each of the state DOTs interviewed throughout the project. There are certain software systems that DOTs appear to use more than others; some state DOTs interviewed tend to prefer PCCA software over in-house designed software systems. State DOTs are actively working to incorporate communication between various systems to reduce time and energy spent maintaining records.


