Evaluating the Performance of Longitudinal Barriers on Curved, Superelevated Off-Ramps (2025)
Chapter: 2 Background Studies
CHAPTER 2
Background Studies
NCHRP Project 22-29A led to the publication of NCHRP Research Report 894: Performance of Longitudinal Barriers on Curved, Superelevated Roadway Sections (3). In this project, efforts were undertaken to expand the review of the literature to curved, superelevated ramp sections, which generally involve the design of tighter curves to accommodate high-speed movement to, from, and between major highways. As with the previous efforts, the need existed to focus on the design features for CSORs as well as the current practices for deploying barriers on them. Insights were obtained from a literature review as well as contacts with agencies. National sources of data were used to see locations identified by some of the states. These served as real examples of situations for which updated guidelines could be applied. Efforts for NCHRP Project 22-29A provided a background of specific conditions in which agencies sought enhanced guidelines. The findings of both the literature review and the agency contacts are provided in the next sections.
2.1 Literature Review
Earlier efforts (such as NCHRP Project 22-29A) provided the basis for a more detailed literature review, which identified documents related to the analyses of longitudinal barrier crashworthiness. These efforts date back to the previous crashworthiness standards based on NCHRP Report 230: Recommended Procedures for the Safety Performance Evaluation of Highway Appurtenances (4) and extend to evaluations under the Manual for Assessing Safety Hardware (MASH) (5). It was noted that:
- The bulk of the literature on longitudinal barrier crashworthiness is focused on analyses and testing for straight sections on level terrain. This results from the formulation of crashworthiness criteria based on reproducible “practical, worst-case” scenarios. These documents (not specifically summarized in this report) provide an understanding of the impact performance of these types of barriers.
- Some testing in the early 1990s under the NCHRP Report 230 criteria showed that various Thrie beam designs would function better than W-beam guardrails on curved sections (4). More recent analyses, using simulations, evaluated the performance of concrete barriers behind sloped surfaces (6, 7). These were noted to function adequately. A recent comprehensive evaluation of crashworthiness for barriers on CSORs has not been conducted.
- The Green Book (1) and Roadside Design Guide (2) do not provide special guidelines for longitudinal barriers on CSORs or curved ramps.
- The literature includes numerous examples of the use of simulation tools to analyze barrier performance for various types of impacts, with some recent efforts investigating the effects of sloped conditions.
- Review of the Roadside Design Guide (2) revealed no specific recommendations for longitudinal barrier installations on curved or superelevated road sections (i.e., barrier installations
-
on curves follow the same guidelines as for straight roads). These recommendations suggested that:
- Barriers should not be installed on slopes steeper than 6:1 unless the barrier has been tested and found to meet the NCHRP Report 350: Recommended Procedures for the Safety Performance Evaluation of Highway Features (8) or MASH (5) evaluation criteria.
- Only flexible and semi-rigid barriers should be installed on slopes steeper than 10:1.
- Barriers should be placed as far as possible from the traveled way as is practical without hindering its proper operation and performance. Barrier offset distances (i.e., the shy line) range from 4 ft for a 30-mph design speed to 12 ft for an 80-mph design speed.
These findings were not considered significant enough to alter the identified focus on barriers on CSORs.
The key findings of the literature review undertaken for NCHRP Project 22-29 included the following:
- The AASHTO Green Book (1) and Roadside Design Guide (2) provide the fundamentals for barrier design and deployment on U.S. highways. These documents provide the prevailing rationale, conditions, and parameters for barrier needs; the recommended types; and deployment (placement) details for longitudinal barriers on high-speed, curved, superelevated road sections (CSRSs).
- The AASHTO Green Book (1) provides guidelines for curve design that address design speed, maximum superelevation rate, side-friction factor, superelevation distribution methods, selection of curvatures and superelevation, and shoulders. The guidelines establish a safe and comfortable driving environment on curved road sections. These guidelines are used by most states for curve and superelevation design and include the following recommendations:
- Vehicles traveling on curved roads are subjected to centrifugal force that pushes the vehicle outward from the center as a function of increasing vehicle speed or decreasing radius of curvature. Superelevation is the sloping (banking) of the road to oppose centrifugal force. For high-speed roadways, the Green Book–recommended range for maximum superelevation rate is 6% to 12%. This range is reduced to 6% to 8% in regions where snow or ice is of concern, considering that vehicles traveling at low speeds in snowy or icy conditions tend to slide on roads with high superelevation.
- The Green Book cites the need for side friction to resist the lateral centrifugal force for a vehicle traveling on a curved road through a combination of superelevation and the friction between tires and the road surface. For a given vehicle speed and curvature radius, an increase in superelevation leads to a lower lateral-friction force (i.e., a larger portion of the centrifugal force is resisted by the superelevation). The side-friction factor is the ratio between this lateral-friction force and the weight of the vehicle (with a small conservative simplification).
- The Green Book defines design speed as “a selected speed used to determine the various geometric features of the roadway” based on the topography, anticipated operating speed, adjacent land use, and functional classification of the highway. The design speed affects superelevation and curvatures as well as several other design parameters. The Green Book recommendation for minimum design speed on high-speed roadways (highways) is 80 km/h (50 mph). The use of design speeds of 100 km/h (60 mph) or higher is encouraged for urban highways, as the speed can be achieved with minimal additional costs. A 110 km/h (70 mph) design speed is recommended for rural highways and interchange locations consistent with higher design speeds. For mountainous terrain, a design speed of 80 to 100 km/h (50 to 60 mph) is recommended.
- The Green Book gives an approximation of running speed as a function of design speed. The Green Book recommends that shoulders in heavily traveled high-speed highways be at
- The minimum curvature radius defines the sharpest curvature for a given design speed, maximum superelevation, and maximum side-friction factor.
- For a given design speed and road curvature, several combinations of superelevation and side friction can be used to resist the lateral centrifugal force. The Green Book lists five methods for the distribution of the superelevation and lateral-friction forces. For high-speed roadways, the Green Book recommends the last method (Method 5). In this method, the superelevation and side friction have a curvilinear relationship with respect to the inverse of the curvature radius.
- Few state-specific road design guidelines were obtained from a state agency survey (see Section 2.2), and a review showed that these guidelines are similar to the Green Book. No specific information was found related to longitudinal barrier installations. A few differences were noted between state DOT and Green Book guidelines, such as maximum superelevation rates, side-friction factors, and superelevation design tables.
least 3 m (10 ft), with a width of 3.66 m (12 ft) preferable. On 4-lane highways, the recommended shoulder width on the left side of the road is 1.22 to 2.44 m (4 to 8 ft) and on the right side is at least 3 m (10 ft). Asphalt and concrete shoulders should be sloped from 2% to 6%. Gravel or crushed rock shoulder slopes should be from 4% to 6% and turf shoulders, 6% to 8% percent.
The Roadside Design Guide revealed no specific recommendations for longitudinal barrier installations on curved and superelevated road sections (2). Barrier installations on curves follow the same guidelines as on straight roads. A few recommendations related to the research topic are as follows:
- A barrier should not be installed on a slope steeper than 6H:1V unless it has been tested and found to meet NCHRP Report 350 (8) or MASH (5) evaluation criteria.
- Only flexible and semi-rigid barriers should be installed on slopes steeper than 10H:1V.
- A barrier should be placed as far from the traveled way as possible without hindering its proper operation and performance. Barrier offset distances (i.e., the shy line) range from 1.22 m (4 ft) for a 50 km/h (30 mph) design speed to 3.66 m (12 ft) for a 130 km/h (80 mph) design speed.
Previous efforts focused on “roadway sections” and aimed to develop a better understanding of the safety performance (i.e., crashworthiness) of barriers used on CSRSs. The findings led to recommendations for improving barrier selection, design, and deployment in pursuit of enhanced highway safety for CSRSs.
2.1.1 Expanded Literature Review
Highway or highway ramps are typically curved, superelevated roadway sections as well. Chapter 10 of the Green Book addresses grade separation and interchanges. It defines ramps as “all types, arrangements, and sizes of turning roadways that connect two or more legs at an interchange. The components of a ramp are a terminal at each leg and a connecting road” (1). It notes that the geometry of the connecting road usually involves some curvature and a grade. Generally, the horizontal and vertical alignment of ramps is based on lower design speeds than the intersecting highways, but in some cases the alignment may be equal.
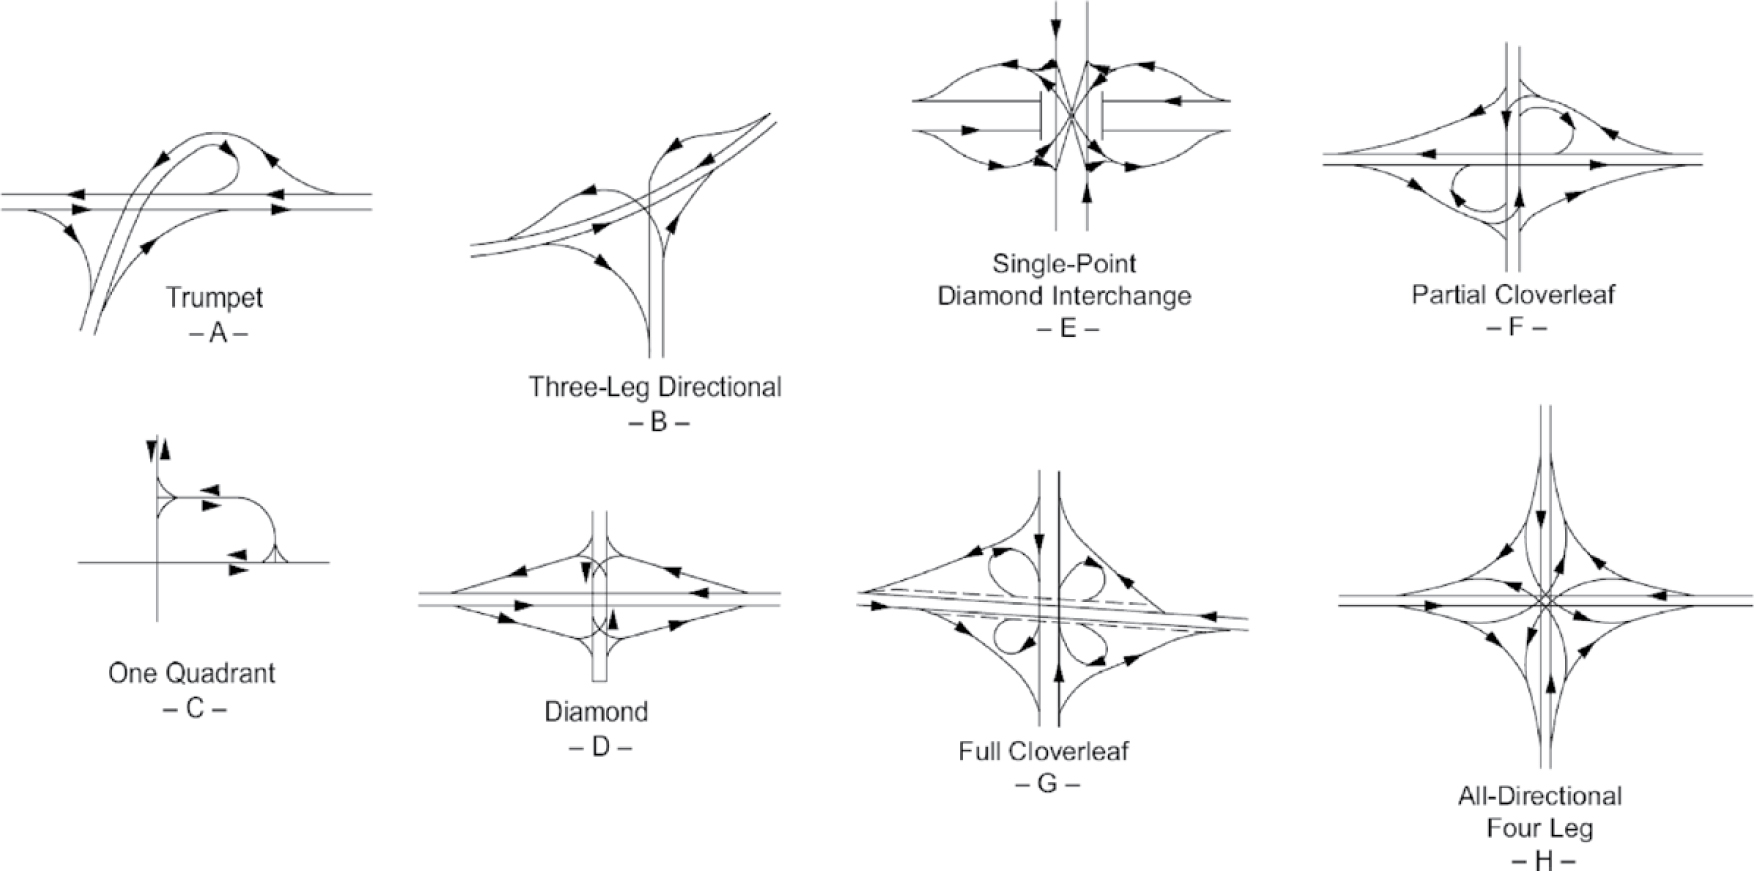
The Green Book notes that such ramp designs are needed to accommodate high volumes of traffic safely and efficiently through interchanges or special features that include varying degrees of grade separation with varying layouts of ramps to offer effective connections between the intersecting roadways (1). These are shown in Figure 2 and Figure 3. Although the literature review findings previously described remain the same and continue to be applicable for the “ramps” associated with interchanges, one thing is readily obvious in the Green Book—these “ramp” roadways take many configurations. These figures include both “off” and “on” ramps (or “exit” and “entrance” ramps) that in some cases reflect similar geometrics.
The literature search was expanded to studies about the relative effectiveness of ramps. This was undertaken with the knowledge that past efforts to analyze ramp crashes were limited by multiple issues that prevented effective analysis. Typically, such analyses were limited by issues in getting the pertinent data, such as getting design features for ramps, accurately locating crashes to specific ramps and along them, isolating details about barriers, and finding information on driver behavior, the vehicle, the nature of the impact, and crash outcome. In the previous research, no extensive studies were isolated for crashes on curves, nor were any cited by respondents to the survey undertaken for this project. It was also noted that the Green Book does not cite anything about the relative performance of various types of ramps; however, it does seem to provide general guidelines about the qualitative factors to consider in designing a ramp and its features to address varying aspects of traffic, speeds, and control (1).
A Transportation Research International Documentation (TRID) search was undertaken for the key words “ramp safety,” and several relevant studies from the last 10–15 years were revealed. These efforts indicated a variety of characteristics that differentiate ramps.
The initial research focused on the viability of curved, superelevated roadway sections of various designs over a range of curvature. Curves with radii of 600–700 ft are typical of many highway ramps, but no specific distinction was made in the safety analyses relative to ramp sections. Previous analyses of curve safety conducted using typical aggregated data found that curvature,
barrier types, and barrier safety influence safety individually. Only limited insights were found relative to crash causation and severity or to related factors for ramp sections.
Safety insights for highway ramps have long been limited. Traditionally, crash data analyses provided important insights on street and highway design. Analyses of the frequency and severity of crashes provided a useful metric based on the ability to locate the crash and isolate the factors at the site and the behavior of traffic and drivers. The viability of such analyses has been limited by the accessibility of crash data, its geometric curvature detail, and, critically, the specific crash location. It was also common that the locations of highway features were not properly recorded (i.e., positions of barriers relative to the traveled way). Initial designs failed to provide the needed dimensions after maintenance or modifications led to changes in positions.
The basic data may exist in some agencies, but the details of locating crashes on specific ramps and points on the curve often make such efforts difficult. In this effort, DOTs were specially asked if they had undertaken safety analyses for ramps, but none were cited. It would be useful to undertake a comparative analysis of crash data for ramps to understand the critical elements and the relative performance of barriers deployed on ramps, but this was not considered readily possible nor within the scope of the project.
As an alternative, the survey asked that agencies provide the names of specific ramps in their states that experience more crashes than the norm. Only a few sites were cited, and the pertinent crash data was not provided. These sites were reviewed through digital aerial imagery and are reported under Section 2.3, the review of typical sites.
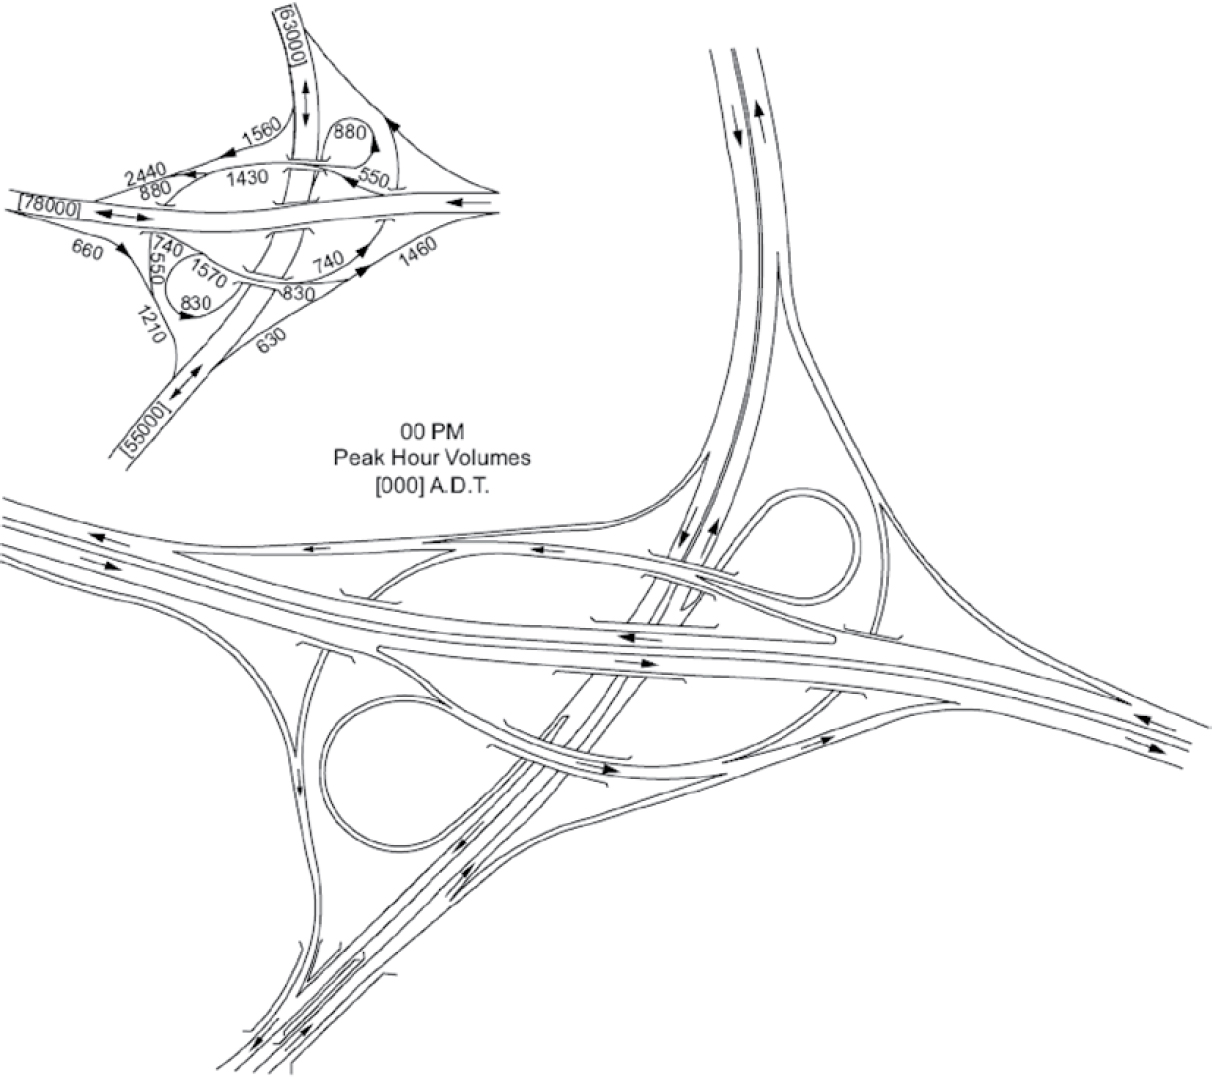
Efforts to address the general need for a more analytical approach to understanding highway safety, and more importantly, continually maximizing it, helped promote the concept of safety performance functions (SPFs) and crash modification factors (CMFs) (9). These evolved from the long-standing interest in having a basis for quantitatively selecting between alternatives. Efforts to create functions and factors to provide an analytic metric started slowly by trying to determine the likely benefit for improvement. Efforts to develop the Highway Safety Manual (HSM) (10) to share the knowledge gained and enhance the overall safety improvement process led to more efforts in this area. The efforts also tried various methods to account for the contributions of multiple safety improvements. These factors would, in the simplest sense, indicate the degree of safety improvement that might be possible for a given type of change. These efforts also expanded into a broader array of safety improvement needs, including some related to highway ramps. Torbic et al. published NCHRP Web Document 227: Design of Interchange Loop Ramps and Pavement/Shoulder Cross-Slope Breaks in 2016 (11). They noted that the limited research on the design, safety, and operational characteristics of loop ramps was a major impetus for the effort. The authors differentiated between exit and entrance ramps.
In the efforts to develop improved guidelines for the design of interchange loop ramps and pavement shoulder cross slopes, Torbic et al. examined both entrance and exit ramps because of their differences in vehicle speed and positioning (11). These efforts were based on data from 28 ramps that were about equally split between entrance and exit ramps. Vehicle speed data was gathered from driver observations for various points on the ramps and analyzed. Data revealed that speed varied along the lengths of the ramps and was higher in some cases for entrance ramps. Torbic et al. noted differences in the performance between loop and diamond ramps and analyzed multiple lanes and other factors. The document recommended guidelines for ramps with curvatures from 100–300 ft with design speeds from 20–35 mph. These are lower than the design speeds used in the analyses for CSRSs. The Torbic et al. efforts led to guidelines for curvatures and cross slopes, but they did not reflect the needs for barriers and where they should be placed. These efforts developed SPFs intended to support the HSM (10), and hence focused
more on ramps as an interchange element that can be given an SPF metric. The document noted that these metrics had limits that required further efforts to improve.
Torbic later teamed up with Harwood and Bauer to take a similar approach, examining the differences between loop and diamond ramps (12). This effort involved data from 235 loops and 243 diamond ramps in California and Washington, with 5 years of crash data. Torbic, Harwood and Bauer presented data from the study, noting that free-flow loop, partial loop, and diamond ramps, with minimum radii of 78, 137, and 193 ft, respectively, did not show a consistent pattern for whether the entrance or exit ramps had the minimum radii. These efforts led to improved SPFs to support the HSM (10). The comparison of the actual data with the predicted numbers found that more specific calibrations were needed.
Torbic and Brewer (13) later looked deeper into loop ramps and recommended that they be designed to (1) have radii, design speeds, and lane and shoulder widths that induce speeds lower than the design speeds and (2) have added lane width for outer lanes on multi-lane ramps to better accommodate the speed differences between cars and trucks. These recommendations also included updates to the SPFs developed.
Others have focused more on other speed distribution aspects of ramps, namely, understanding speed profiles of vehicles on ramps and how a vehicle’s relationship to the adjacent deceleration lanes influences the driver’s propensity to exceed the critical speed when negotiating a ramp. Choi et al. (9) developed SPFs for direct, semi-direct, and loop interchanges. These SPFs were based on the radius of curvature, grade, and lengths of acceleration and deceleration lanes for 201 ramps in Korea in 2007. These analyses of 3 years of data for six interchanges provided the basis for a binomial-based predictive function used to predict the expected number of crashes that would occur for each type of ramp. The initial error rates were high in some cases, but theoretically, as more data is acquired, the reliability of the function will improve. This study is believed to suggest that intrinsic differences exist between ramps. It is unclear from the results whether other factors would be useful for understanding the relative safety of the ramps. These efforts did not consider the width of the road, the shoulders, or the nature of barriers on the ramps. It is possible to isolate other factors, but such efforts were not included in this study.
Van Beinum (14) studied turbulence at motorway ramps in the Netherlands. His thesis was that a raised level of turbulence exists around interchanges from the vehicles entering and exiting the highway, and from the behavior of drivers as they anticipate and adjust speeds and position for these maneuvers. Van Beinum’s efforts noted that there are two major problems with current roadway design guidelines with respect to turbulence: limited understanding of the effects of turbulence and the lack of quantitative metrics about the relative implications for varying turbulence from design guides. He used the Vissim simulation tool to analyze turbulence effects and found correlations between the intensity and the location of lane changes. The analyses were conducted for on- and off-ramps, and it was noted that on-ramps had lower turbulence. The efforts did not isolate the effects of other aspects of ramp design. The guidelines were examined to determine whether a distinction exists or can be made that might be applied to the designs for ramps, but little empirical data was reported.
Abatan and Savolainen (15) used 2010–14 data for more than 400 interchanges in Iowa. This study examined six types of interchanges and noted variations in their safety. SPFs were developed for the various types of interchanges, considering volumes, speed, length, and on- or off-ramp signalization. The SPF models were used to analyze the mainline effects on ramp safety. The models were compared with those developed for Florida interchanges and results from SafetyAnalyst software. This effort indicated that there are differences in interchange safety that can be predicted.
Naturalistic driving studies (NDSs) were initiated some 15 years ago in an attempt to capture more detailed data that would permit deeper analyses into the influences of highway design,
traffic conditions, and area features on driver behavior and performance. The efforts began using driver- and road-directed cameras to record actions related to traffic situations. Various technologies were integrated to expand data gathering to include more than 100 variables related to location, vehicle control inputs, road conditions, and driver actions and attention.
Under the Strategic Highway Research Program (SHRP), the owners of several thousand vehicles in 10 states reflecting the various U.S. regions agreed to have their vehicles instrumented for the NDS effort. Each vehicle served as a probe, gathering detailed information on highway travel and the prevailing traffic conditions for wide parts of the national network. The driver’s control actions, behavior, and attention for the traffic condition were continually monitored. Traffic conditions were captured from views of the road. Therefore, it was possible to create an extremely detailed driving record for each trip, which could be used to analyze behaviors in varying situations, such as on highway ramps. The massive database that has been created has only been partially tapped by researchers to address specific questions, although several efforts have been made to address questions related to ramp performance.
The SHRP 2 Naturalistic Driving Study (SHRP2 NDS) database provides thousands of observations over a large sample of drivers (albeit those who knew that they were being monitored during the study). Repeated observations for the same driver were included to offer a means to track their consistency. Many of the initial efforts to exploit this database have been undertaken by the human factors experts who originally developed the NDS concept. As a result, most of the studies have tended to focus on driver performance aspects and not highway design or safety issues. Those aspects are, however, possible, as the data set does include actual crash events.
Other efforts have been made to understand and control ramp speeds, an important factor in run-off-road crashes. Dadashova, Dixon, and Avelar (16) explored the effect of important predictors of ramp speed choice. Their analyses were based on SHRP NDS data on 32 participants for more than 850 trips that provided a rich source of information about driver inputs and reactions when negotiating ramps. The effort examined four interchanges that included diamond, trumpet, and partial cloverleaf designs. The analysis focused on driver characteristics, including age, gender, depth perception, sleeping habits, and Barkley’s ADHD screening metrics. Using various statistical techniques, Dadashova, Dixon, and Avelar examined behaviors related to street-to-highway merging and highway-to-street diverging for the various interchanges. It was clear that different speed profile patterns were present at different points along the ramp. These patterns reflected vehicle speeds from about 20 to 70 mph. This data suggests that speed and speed profile clusters from particular ramps could be analyzed to provide insights into speed behavior.
Xu, Zhou, and Xue (17) used data from the SHRP2 NDS to analyze the effects of deceleration lane design on deceleration patterns for 10 off-ramp interchanges in Florida. Eight of the sites selected were diamond-style interchanges, and the other two were partial cloverleafs. The locations studied had relatively long single and tandem deceleration lanes before the off-ramps. This research aimed to determine the effectiveness of deceleration lane length, which was considered to provide an opportunity to slow traffic before it reaches the curved ramp. The paper shows data for each location that reflects actual driver behavior related to a specific design feature. The authors note that the speed profiles created for each site show that drivers are not using the deceleration lanes to slow down, but they are driving faster than intended on the ramp curves. Deceleration was taking place 75% to 90% of the time on the ramp sections. This suggests that unfamiliar drivers might encounter hard-braking situations on the ramps and related safety issues. In the case studies, the ramps did not have sharp curvature that might have led to crashes. This study does give credence to the general thinking that speeds are likely to be higher on off-ramps than on-ramps. The authors did develop SPF models that could be used in the design process for determining appropriate deceleration lane lengths.
Similar smaller-scale efforts have been made by others, and projects underway are aimed at establishing a better understanding of the factors that influence ramp safety and performance (18–20). These may reinforce the previously described findings.
2.1.2 Conclusions from Literature Review
Based on the literature reviewed, the following conclusions may be appropriate:
- Efforts have been made to determine the relative safety of highway ramps through the development of SPFs or CMFs and NDSs. SPFs are based on establishing a quantitative relationship between design and usage features and the expected number of crashes that will occur.
- Choi et al. (9) developed SPFs for direct, semi-direct, and loop interchanges based on curvature radius, grade, and lengths of acceleration and deceleration lanes. However, these efforts did not consider other factors such as the width of the road, shoulders, and the nature of barriers on the ramps.
- NDS data has the potential to provide deeper insights into the relationships between factors that influence ramp performance, but it offers only a snapshot, and its data collection phase has ended. It is unclear whether it will provide sound metrics to differentiate ramps by type.
- It appears that sufficient information to establish the relative safety of all types of highway ramps has yet to be provided. Research is continuing in this area.
- There is no clear evidence that on- versus off-ramps have a specific speed differential that would be a differentiating factor. Studies of deceleration lanes for off-ramps have indicated considerable variation in the speeds selected by drivers. Drivers tend to decelerate harder as they reach the curved section of the ramp, suggesting that impact speed may be higher when, for whatever reason, a vehicle leaves the traveled way on a ramp. This has implications for barrier performance.
References were made to other efforts underway to understand ramp behavior and establish better design and control strategies (19–22). It is likely that these efforts will provide additional insights and support for the concepts and metrics measuring variations in ramp performance, but the current status of the literature does not provide a well-established basis for differentiating ramp types.
Based on the literature reviewed, the following conclusions may be appropriate:
- Ramps can be differentiated. Some efforts show that multiple factors do not follow “design” thinking, such as differences in speed for on- and off-ramps.
- Much information reflects the relative safety and performance of highway ramps based on curvature, cross section, traffic, speeds, and shoulder conditions. There are various designs but no “safety” metric that would influence the selection of specific design features.
- Given the focus of this effort on barrier deployment, it is probably prudent to focus on loop ramps in general without providing an operational label (e.g., on- or off-ramps).
Further insights on CSOR issues were of continued importance and sought by agency contacts.
2.2 Agency Survey
State DOTs were contacted at the outset of the project to solicit current information on agency practices and policies relative to the deployment of barriers on highway ramps, as well as the associated design requirements and features of these ramps that may affect the effectiveness of the barriers. To achieve these objectives a survey was initially designed to:
- Assess the latitude agencies have used to establish more specific requirements or define exceptions to the recommendations.
- Solicit suggestions for improved deployment and design practices to identify options to revise the current practices.
- Limit the time state agency personnel are expected to provide identifying and critiquing current practices, considering they have a full set of active responsibilities.
- Request information that taps the unique experience or expertise of DOT staff to ultimately aid in improving practices.
- Request optional data that could be useful in enhancing the credibility of the research effort (e.g., provide crash data for a small subset of ramp locations). The analysis of the aggregate would enhance the depth of understanding derived.
- Focus on short-radius, superelevated curves and their configurations, which are typical of ramps, and the typical practices for selecting and installing barriers.
- Provide an increased direct focus on the grade factors of the curved ramps, as grade factor is a larger consideration for ramps onto grade-separated roadway interchanges.
The initial survey form was designed to capture the following data as effectively as possible:
- Staff perspectives on ramp crash safety issues.
- Information on agency guidelines or practices for the design of ramps, including radius, superelevation, and grade. The nature of the shoulders, including the width, slope relative to the roadway, and offset to the barrier, was shown to influence barrier effectiveness.
- Types of barriers typically used on ramps and their height, offset from the shoulder, and vertical orientation.
- Examples of typical ramp situations in two categories—normal (typical or most common) designed ramps, and tight or difficult ramps (designed to accommodate site limits or under past practices). It was hoped that agencies would provide a few examples in each category by name so the research team could use digital aerial imagery to view them.
- Crash safety perspectives of the persons responsible for the design and deployment roles, to provide the basis for formulating improved guidelines.
The survey was directed to different agency personnel to include, but not be limited to, agency staff from various offices and departments (e.g., Chief Engineer, Safety Director, Construction/Maintenance Staff, Standards Engineer/Director). This was intended to ensure that for any given state, the respondent could be identified to reflect varying perspectives and depth of specific knowledge (e.g., road design, barrier requirements).
A survey instrument developed through iterations of panel review, is shown in Appendix A: State DOT Survey Questionnaire. The instrument is similar to the one used in earlier research but was revised to be shorter, which meant that some of the noted aspects did not get the intended emphasis. The survey also made it easier for respondents to provide links to state documents. However, it was found to require more time from the research team to wade through varying guidelines from online documents to isolate key factors.
The survey was sent to all state DOT representatives in 2019 and again in 2020. After a few followups, a total of 33 states replied. Those states are as follows: Alabama, Alaska, Arizona, Arkansas, Delaware, Hawaii, Idaho, Illinois, Indiana, Iowa, Kansas, Kentucky, Louisiana, Maine, Michigan, Mississippi, Montana, Nebraska, New Hampshire, New Jersey, New York, North Dakota, Ohio, Oklahoma, Oregon, Pennsylvania, South Carolina, South Dakota, Tennessee, Utah, Washington, Wisconsin, and Wyoming. The research team followed up with the remaining states and collected, reviewed, and summarized the received information for inclusion in the project’s final report. Pertinent responses for the survey-specific questions are summarized in this section. A summary of the responses relative to ramp design requirements by state is provided in Table 1. A summary of cited CSOR requirements is presented in Table 2.
Table 1. Specific ramp design values cited by survey respondents.
| Responding states | Specific design criteria? | Minimum radii | Arterial loop ramp | Maximum superelevation | Downgrade | Maximum grades for vertical alignment |
|---|---|---|---|---|---|---|
| Alabama | Yes | 38 ft | 38 ft | 8% | ||
| Arizona | Yes | 230 ft | 6% | 5%; 6% is acceptable for site restrictions | 4%; 6% is also acceptable for site restrictions | |
| Arkansas | Yes | AASHTO GB | ||||
| Delaware | No | AASHTO GB | ||||
| Hawaii | No | |||||
| Idaho | No | |||||
| Illinois | Yes | 134 ft | 8% | −6% | 4% | |
| Indiana | Yes | 200 ft (180 ft if restricted) | 150 ft | 8% | 6% max. | 5% max. |
| Kansas | No | |||||
| Kentucky | No | |||||
| Louisiana | Yes | 76 ft AASHTO GB | 8% rural, 4% urban | 5% | 5% | |
| Maine | Yes | AASHTO GB | AASHTO | AASHTO 6% highways 4% urban | AASHTO | AASHTO |
| Michigan | Yes | 260 ft | 232 ft 222 ft | 7% | 6% | |
| Mississippi | Yes | |||||
| Montana | Yes | 255 ft | 8% | 7% | ||
| New Hampshire | Yes | 188 ft | 100 ft for 30 mph and 8% max | 6% | 8% | |
| North Dakota | Yes | 4-degree curve | 6% | |||
| Ohio | Yes | 150 ft | 5% | 8% | 7% | |
| Oklahoma | No | AASHTO GB | AASHTO GB | AASHTO GB | ||
| Oregon | Yes | Max. degree of curve should be 30°, 190.99 ft 159.15 for 36o | 12% | 8% vertical alignment: descending | 7% ascending | |
| South Carolina | Yes | 134 ft | 8% | 5% to 7% | ||
| South Dakota | Yes | 300 ft typical | Lower acceptable | 6% for loop | 6% and 8% 9% for 55 mph + acceptable | |
| Tennessee | Yes | 100 ft | 4% | 15–25 mph 6%–8% 25–30 mph 5%–7% 40 mph 4%–6% 45 mph + 3%–5% | 15–25 mph 6%–8% 25–30 mph 5%–7% 40 mph 4%–6% ≥45 mph 3%–5% | |
| Washington | No | 50 ft | 10% | 9% | 7% | |
| Wyoming | No | 500 ft | 8% in rural, 6% in mountain 4% in urban | Follows AASHTO GB |
Table 2. Minimum reported widths for ramp shoulders and traveled way.
| Responding states | Right shoulder width | Left shoulder width | Traveled way | |||
|---|---|---|---|---|---|---|
| Typically | Restricted areas | Typically | Restricted areas | Min. | Max. | |
| Alabama | 10 ft | 8 ft | 4 ft | 2 ft | 9 ft | |
| Alaska | AASHTO GB | |||||
| Arizona | 10 ft, Add 2 ft w/ barrier | 10 ft, Add 2 ft w/ barrier | 6 ft, Add 2 ft w/ barrier | 6 ft, Add 2 ft w/ barrier | 12 ft | |
| Arkansas | AASHTO GB | AASHTO GB | AASHTO GB | AASHTO GB | AASHTO GB | |
| Hawaii | AASHTO GB | AASHTO GB | AASHTO GB | AASHTO GB | AASHTO GB | |
| Illinois | 8 ft, 6 ft if paved | 8 ft, 6 ft if paved | 6 ft, 4 ft paved | 6 ft, 4 ft if paved | 12 ft | 14 ft, 15 ft ok |
| Indiana | 8 ft | 6 ft | 4 ft | 16 ft | ||
| Iowa | 6 ft | 4 ft | 10 ft (non-interstate) | 12 ft (interstate) | ||
| Kansas | 8 ft AASHTO GB | 8 ft AASHTO GB | 2 ft AASHTO GB | 2 ft AASHTO GB | AASHTO GB | |
| Louisiana | 10 ft | 6 ft | 4 ft | AASHTO GB | ||
| Maine | 8 ft AASHTO GB | 8 ft AASHTO GB | 4 ft AASHTO GB | 4 ft AASHTO GB | 14 ft AASHTO GB | |
| Michigan | 8 ft, 7 ft paved | 6 ft, 4 ft paved | 16 ft | |||
| Mississippi | 10 ft | 10 ft | 8 ft | 8 ft | ||
| Montana | 6 ft | 4 ft | 16 ft | |||
| Nebraska | 8 ft | 0 ft | 16 ft | |||
| New Jersey | 12 ft | 7 ft | 7 ft | 1 ft (urban) 0 ft (existing) | 22 ft paved | |
| North Dakota | 8 ft, 6 ft paved | |||||
| Ohio | 8 ft | 8 ft | 6 ft | 6 ft | 18 ft (for radius less than 200 ft) | |
| Oregon | 6 ft | 6 ft | 4 ft | 4 ft | 14 ft ok on arterials | 16 ft |
| Pennsylvania | 8 ft | 4 ft | AASHTO | |||
| South Carolina | 10 ft; 6 ft paved (+3.75 ft w/ guardrail) | 10 ft; 6 ft paved (+3.75 ft w/ guardrail) | 10ft; 4 ft paved (+3.75 ft w/ guardrail) | 10 ft; 4 ft paved (+3.75 ft w/ guardrail) | ||
| South Dakota | 8 ft | 8 ft | 2 ft | 2 ft | 15 ft | 19 ft |
| Tennessee | 8 ft; 6 ft paved | 8 ft; 6 ft paved | 6 ft; 4 ft paved | 6 ft; 4 ft paved | 16 ft | |
| Utah | 8 ft + 2 ft | 4 ft + 2 ft | 12 ft | |||
| Washington | 8 ft | 4 ft | 2 ft | 2 ft | 11 ft | 13 ft |
| Wisconsin | 14 ft | 6 ft | 14 ft | 6 ft | ||
| Wyoming | 8 ft | 4 ft | 4 ft | 4 ft | 12 ft | |
Question 1. Do you have specific design criteria (e.g., minimum radii, maximum superelevation, downgrade) for the geometrics of curved, superelevated ramp sections? If yes, please include information or provide a link to where this information can be accessed.
Twenty-one states mentioned that they have specific design criteria, whereas 11 states do not have them. The states without design criteria are Alaska, Delaware, Hawaii, Idaho, Kansas, Kentucky, Oklahoma, Pennsylvania, Washington, Wisconsin, and Wyoming. Of these states, Delaware, Oklahoma, and Pennsylvania follow the general guidelines of the AASHTO Green Book (1). From the states that have criteria, three states list a radius of 100 ft or less, four states list a radius between 101 ft and 200 ft, and six
states list a radius at or above 201 ft. Louisiana has the minimum radius at 76 ft for a 20-mph design speed and an 8% superelevation in rural areas. Eight states did not list their criteria in the survey. Superelevation ranges from 4% to 12% were reported. Oregon is the only state with the maximum value of 12%, and Washington has a 10% superelevation value. Seven states list 8% as the maximum superelevation, mainly in rural areas on highways. Four states have 4% as the maximum superelevation in urban areas. Six states follow AASHTO Green Book guidelines (1). Seven states list 6% as the maximum superelevation, mainly for highway roads. Only two states have a maximum superelevation of 7% and 5% each. The maximum grades for vertical alignment for New Jersey are 11% for mountainous roads. South Dakota has a maximum vertical grade of 9%. Vertical grades of 6% and 8% were mentioned by three states each. Seven states have the maximum vertical grade at 7%. Two states have the maximum vertical grade at 5%. Eight states follow AASHTO Green Book guidelines for minimum and maximum vertical grades (1). The maximum downgrade for vertical alignment is for Utah and Washington at 9%. For downgrades of 8% and 6%, four and three states, respectively, mentioned them. Louisiana has set the maximum vertical grade at 5%. Seven states follow AASHTO Green Book guidelines for downgrades (1). The specific values are summarized in Table 1.
Question 2. Does your State/Agency specify the design speed for curved, superelevated ramp sections? If yes, please include information, provide a link to where this information can be accessed.
Twenty-two states mentioned that they have and 10 states mentioned that they do not have a design criterion. Kansas, Maine, and Utah follow the general AASHTO Green Book guidelines (1). Six states have a minimum speed of 25 mph, and three other states have a minimum speed of 30 mph. Some states mentioned that they do not specify design speeds for ramps. Instead, they recommend a desirable ramp design speed.
Question 3. Do you have special criteria to decide if a longitudinal barrier is warranted on a ramp? If yes, please include criteria, provide a link to where this information can be accessed.
Nine states mentioned that they have a warranted longitudinal barrier on a ramp and 23 states mentioned that they do not. The states with warranted longitudinal barrier criteria are Alabama, Illinois, Indiana, Louisiana, Mississippi, Nebraska, New Jersey, Ohio, and South Dakota. Illinois warrants longitudinal barriers on ramps similarly to other roadways while taking into consideration the clear zone, barrier warrants, and length of need. The clear zones are established using the Roadside Design Guide (2). The hazard elimination and traversable design treatments are warranted and designed using a stepwise procedure. Louisiana uses a barrier if the clear zone for a design speed cannot be met. The state generally follows guidelines from the Roadside Design Guide (2). Alabama considers clear zone issues and the need to provide positive separation of ramps. Mississippi typically provides a longitudinal barrier if slopes are steeper than 3:1, if the ramp is located within the clear zone, or if any obstructions are located within the clear zone. New Jersey considers a guide rail warranted if an obstruction’s physical characteristics and location are within the clear zone. Barriers are evaluated on an individual basis. Additionally, a final analysis must usually be solved by engineering judgment and cost-effective analysis (i.e., the Roadside Safety Analysis Program).
Question 4. Please include below how ramp posted speed is determined and/or upload relevant information files.
New Hampshire and Indiana have advisory speed limits of 18 mph and 20 mph, respectively. Nine states mentioned that they post an advisory speed of 25 mph. These states are Alabama, Illinois (urban roads), Iowa, Montana, Ohio, Oregon, South Carolina, Tennessee, and Washington. Five states, Arkansas, Kentucky, Louisiana, New Jersey, and Wyoming, use ball-bank indicators on the ramps to determine the advisory speed that should be posted. Arkansas, Illinois (rural roads), Michigan, and South Dakota (lower is allowed) have a speed limit of 30 mph.
Question 5. Please describe how shoulder widths are determined for ramp sections where barriers are installed and/or upload relevant information files.
Every state has different requirements, and the results are tabulated as shown in Table 2. The states of Alaska, Delaware, Idaho, Kentucky, New Hampshire, and Oklahoma did not reply, so they are not included in the table.
Question 6. The research team is also very interested in obtaining information about geometry of old sharply curved ramps that are no longer on your State’s standard plans and roadside barriers used on these ramps. Please include or upload any relevant information below.
No state provided any documentation. Many states did not understand the questions, and only four states gave examples. These responding states provided actual highway ramps (highway and exit numbers) that
would be examined on available online maps to see actual examples. The states usually reconstruct old ramps, and others use warning devices (chevrons, blinking advance curve signs, blinking delineators, and, most recently, sequential lights on the outside of the curve that are visible in daylight) to prepare drivers before taking the ramp. More details will be analyzed after Question 7.
Question 7. Please include any additional comments, concerns, or questions that you would like to convey to the research team below. Cite examples of sites where barriers have been used on CSORs.
Very few states answered this question, while others posted their websites or state manuals as guidelines. Tennessee suggests the need for “a conclusion providing the minimum barrier height and type for curve radius and speed adjusted with max. superelevation (i.e., use concrete rail at 36” for all outside the ramps with a minimum 6’ offset).” Iowa reflected that “much of our knowledge regarding longitudinal barriers on curved ramps is a combination of our Design Manual and institutional knowledge, i.e., the knowledge designers have developed over the course of their careers.” Hawaii summarizes that “generally, evaluation for barrier installation would be based on the Road Design Guide (e.g., clear zone) and accident history (e.g., existing ramps).” Oregon mentioned that its DOT “uses spirals for horizontal alignment criteria, including interchange ramps.” Illinois says agency personnel “do not explicitly consider adjacent superelevation rates in the design of our roadside barriers. The max rollover on the high side is 8 percent, and with the typical Emax of 6 percent we experience a break of 4% to 8% at a point often 6 to 8 ft in front of the face of the barrier. We would be interested to know what issues are pertinent to this type of condition, and what is identified in testing/research.” Utah refers to “TRB Report 894” that the research team developed (3). The respondents would recommend analyzing what types of ramps are effective at what speeds, curve radii, and superelevation conditions.
The survey also asked the agencies to cite specific interchange sites where curved, superelevated ramps had been treated with barriers. Sites offered are described in the following section, an example is provided, and additional details are included in Appendix B: Links to State DOT Documents.
2.3 Review of Typical Sites
The research team received information about the geometry of sharply curved ramps from four states in the survey. The specific ramp sites of “concern” or as “examples” were cited. The research team obtained aerial and driver-level views for most of these sites. This effort was possible using aerial and driver-view images from Google Maps. These interchange sites and the details of these locations served to depict the variety of situations faced by agency staff in their roles to design and maintain their highway system.
Indiana Sites:
-
“Eastbound I-70 to Northbound Keystone Ave. (Exit #85).”
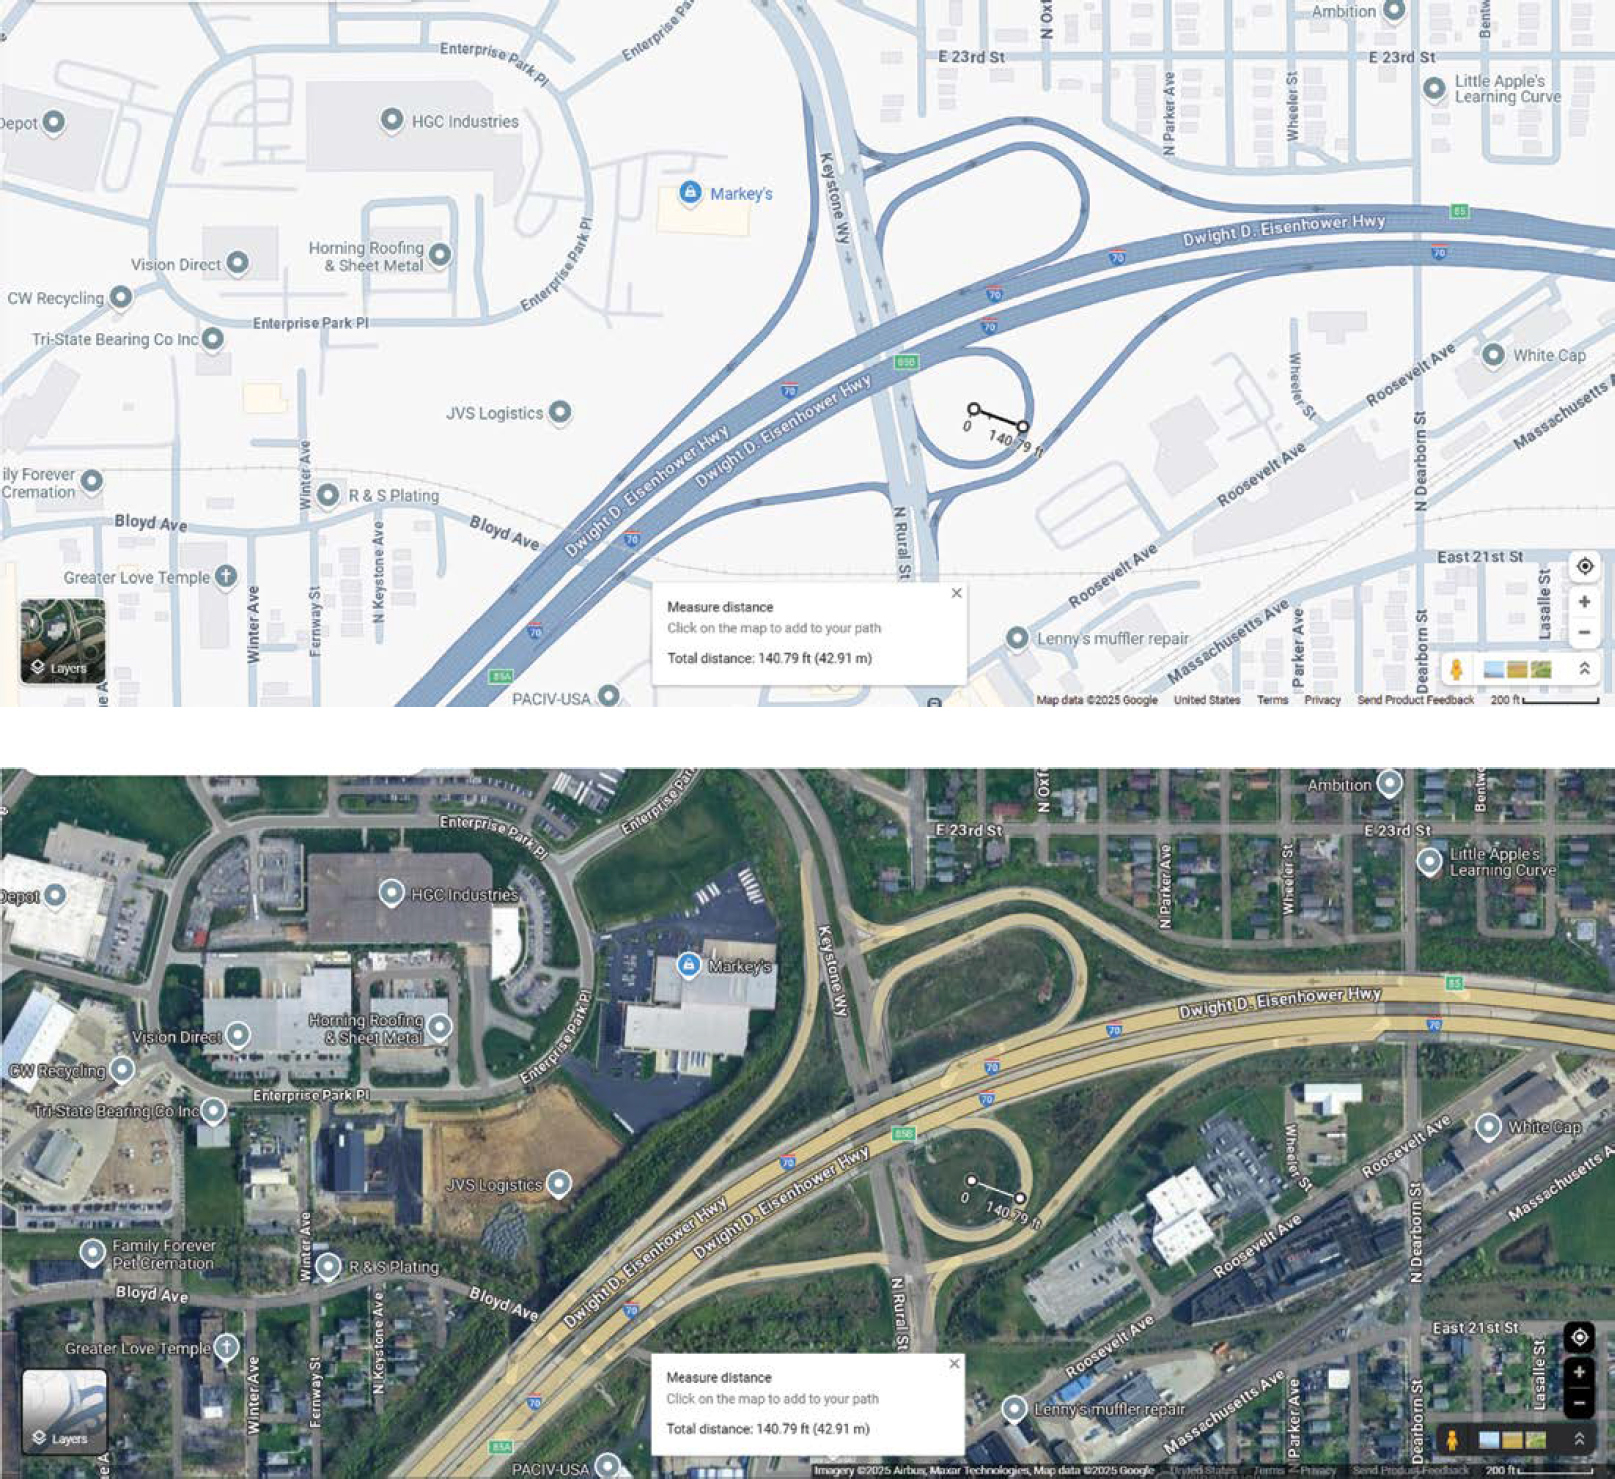
This ramp is shown as an example in Figure 4. Measurements (based on the general technique depicted in Figure 5) indicate a radius of curvature of 141 ft.
-
“Northbound I-465 to Westbound I-465 (Exit #106).”
The specific location could not be located.
-
“Westbound I-74 to US 52 (Exit #169).”
Measurements indicate a radius of curvature of 174 ft. The ramp inside curvature is short and is measured at approximately 460 ft in length (for ∼120 degrees), connecting the interstate to the local roadway (US 52).
Oklahoma Sites:
The responder commented, “We have lots of antique ramps with guardrail to share, although ‘off your state standard’ doesn’t really apply to us, since we don’t really have state standards, unless I’m not reading that right.”
- “NW Expwy Off-Ramp from I-44: One of our more notorious ones, we’ve done chevrons, blinking advance curve signs, chevrons on the guardrail, blinking delineators on the top of the F wall, and most recently some kind of sequential lights on the outside of the curve that are visible in daylight.”
- “NW Expwy On-Ramp to I-44 EB.”
-
“I-244 WB to US-169 SB.”
Measurements indicate a radius of 176 ft.
-
“US-169 SB to I-244 EB.”
Measurements indicate a radius of 193 ft.
-
“US-75 SB to I-44 EB.”
Measurements indicate a radius of 170 ft.
-
“I-44 EB to US-75 NB.”
Measurements indicate a radius of 168 ft.
Utah Sites:
The safety engineer responding to the survey shared with the research team an Excel sheet that summarizes ramps on the state-maintained roadways. Thousands of ramps are listed in the file. Most of the tight radius exits in the Excel sheet were left turn of a diamond-type ramp, not useful to this study. In continued review, a tight loop ramp was identified as follows:
-
“I-15 SB to W-200 N Exit 59”
Measurements indicate a radius of 132 ft.
Nebraska Sites:
-
“I-180 SB (US-34) to US-6 EB Cornhusker Hwy”
Measurements indicate a radius of 121 ft.
-
“S 84th St. NB to I-80 W”
Measurements indicate a radius of 122 ft.
-
“S 13th St. NB to I-80 W”
Measurements indicate a radius of 132 ft.
The states have provided many of their state DOT documents and links to download. Additional documents had to be retrieved from state DOT websites to answer the questions of the survey. The links that were shared and the file names that were compiled are documented.
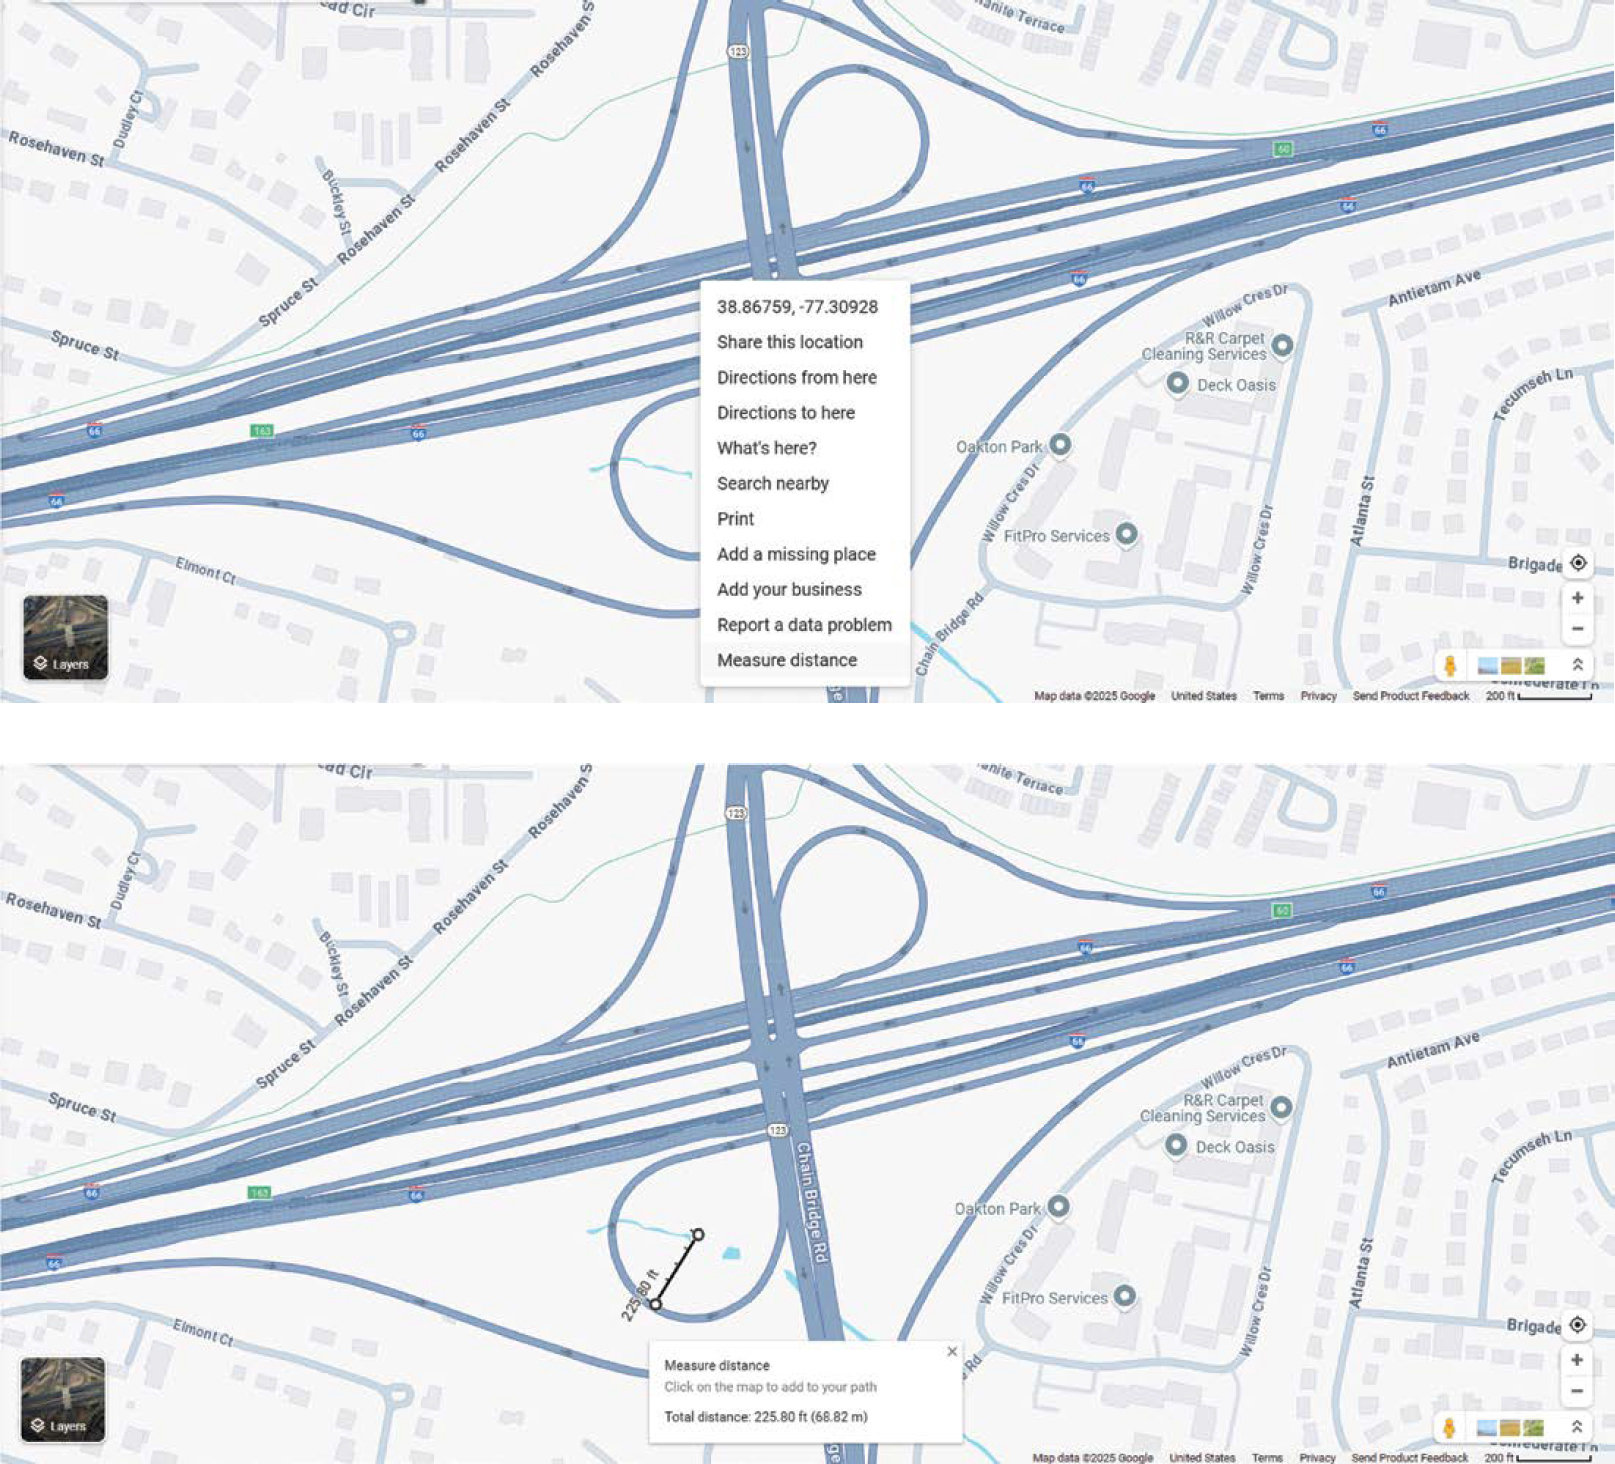
These ramps cited by the states were located on Google Maps and analyzed, and an approximate radius was measured using the tools available. The process to measure radii from Google Maps is straightforward. Once a specific location is opened, the user can right click on a precise feature on the maps and choose “measure distance” from the menu window. Then, the user can select the other side to measure, and Google Maps gives the total distance. The distance is not 100% accurate but it is a useful tool to get approximate values. These steps are shown in Figure 5. For each ramp, several measurements were taken along the ramp diameter, then the curvature radius was estimated and the radius of curvature was measured.
2.4 Overview of Background Study Findings
The background studies indicate, as expected, that limited effort has been made to create a comprehensive understanding of safety on curved, superelevated off-ramps. By extension, highway agencies have not developed uniform practices for the deployment of barriers or criteria (or guidelines) for when they are most often used. The many differences in ramp situations that complicate design efforts, the frequent difficulties in locating crashes on ramps, driver issues, and other factors probably explain the great variations in ramp designs and barrier selections and placement.
Generally, efforts have been made to understand the relationships between ramp design, operation, and maintenance and safety related to the applications of longitudinal barriers. The development of guidelines is complicated by the many factors that must be considered. Agency
personnel reflect appropriate concerns in their survey responses, as well as their need for more guidelines. These facets are reflected in the variations of CSOR designs and standard guidelines for barrier selection and placement. The background studies failed to identify sufficiently deep crash analyses across the range of ramps to provide clear indications of critical points and the effectiveness of barrier options and associated placement requirements.
Research into the most common ramp situations is needed, with a focus on the criticality of the tire-to-pavement interface and on the short-radius designs where driver control and the interfaces between the vehicle and the pavement can be issues when speeds are too high (particularly for vehicles that have been traveling at higher speeds). Efforts are needed to identify critical conditions, enhance the knowledge of the vehicle-to-barrier interface for various types of vehicles, and assess the effectiveness of various types of barriers for the most critical locations where short-radius or “tight” curves must exist. A broad analysis is necessary to identify conditions outside the limits and to develop guidelines for individual agencies or the nation.
The efforts of this first part of the research, which included a review of the literature, a survey of the states, and an overview of typical curved, superelevated ramp sites, provided more depth to the research team’s understanding of the problem but revealed few surprises. It is possible that continued digging through the data and information compiled in these efforts, with the help of software improvements, could lead to other locations and possible new insights.


